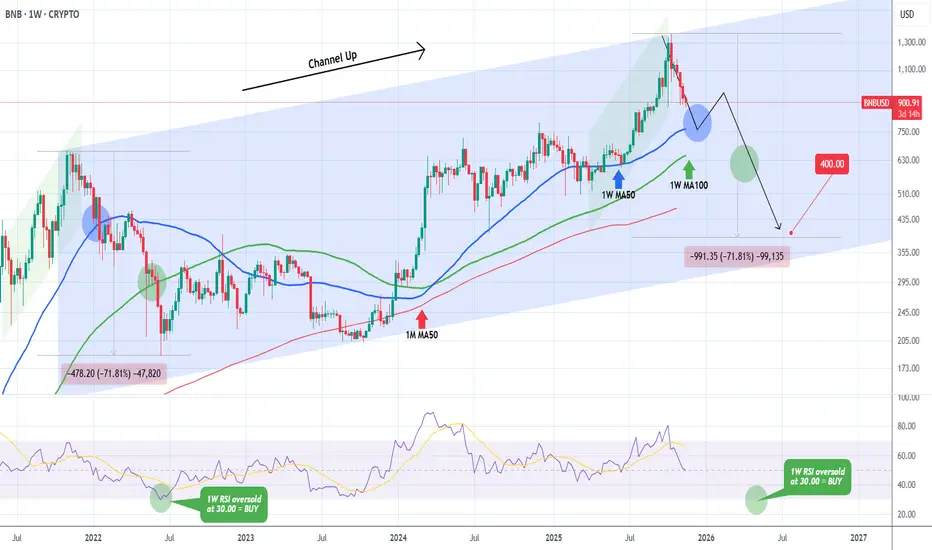
BNBUSD Bear Cycle started and can even crash to $400.Binance Coin (BNBUSD) is currently on its 4th straight red week (and 5 in the last 6), declining aggressively following the October 13 All Time High (ATH). That was also a technical Higher High for the 4-year Channel Up that started following the November 01 2021 Top of the previous Cycle.
As you
Key stats
About Binance Coin
Previously named Binance Smart Chain, BNB Smart Chain is unsurprisingly the blockchain network developed by crypto exchange giant Binance. The ecosystem is host to dApps, DEXes, GameFi platforms and an NFT community, with its BNB token now counted amongst the top 5 cryptocurrencies by market cap. ‘BNB’ is an abbreviation for ‘Build n’ Build’, with building very much at the core of the platform’s ethos. BNB Smart Chain has certainly been a catalyst for Binance’s move into market dominance.
Related coins
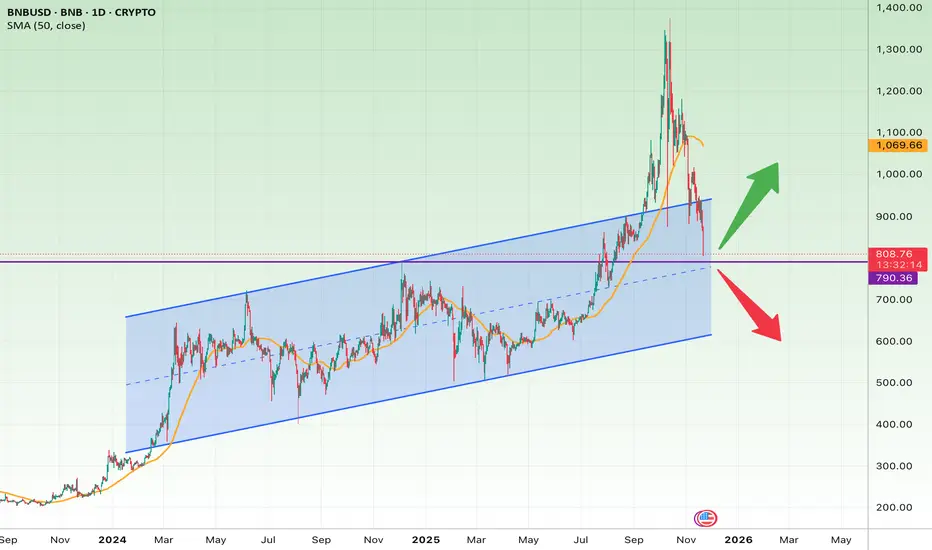
BNB at Reversal Incoming or Start of a Deep Correction?BNB has pulled back sharply from its parabolic run above $1,300, and price is now sitting exactly on the bottom boundary of the rising channel that has guided the trend since late 2023.
This area is extremely important because:
• It is the channel support
• It aligns with a previous consolidation
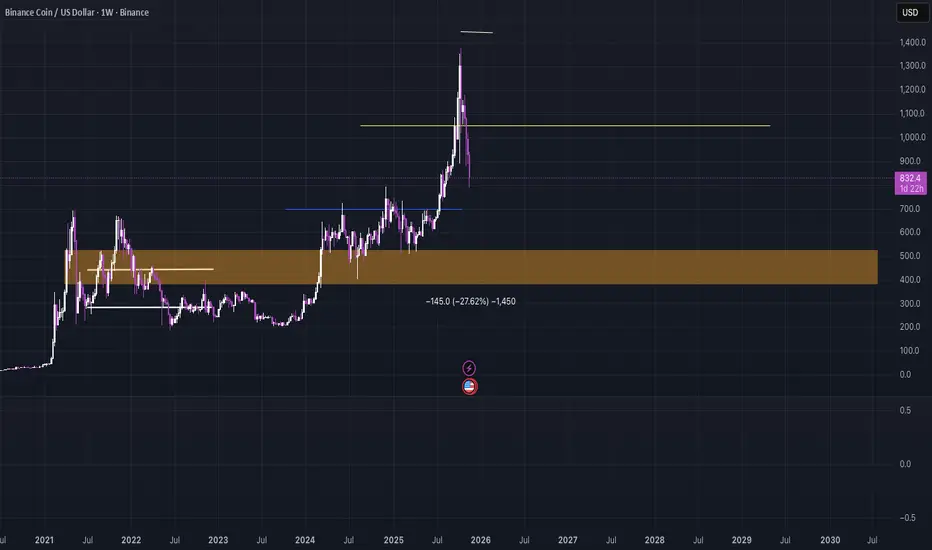
BNB/USD Main Trend. 11 18 2025Logarithm. Time frame: 1 week.
🔵Main trend: lower zone of the ascending channel As previously shown on HBAR.
🟡🟣Secondary and local trends
There's a pullback to the breakout zone, that is, to the mirror level of the former resistance of the large bowl (currently strong support), meaning the pri

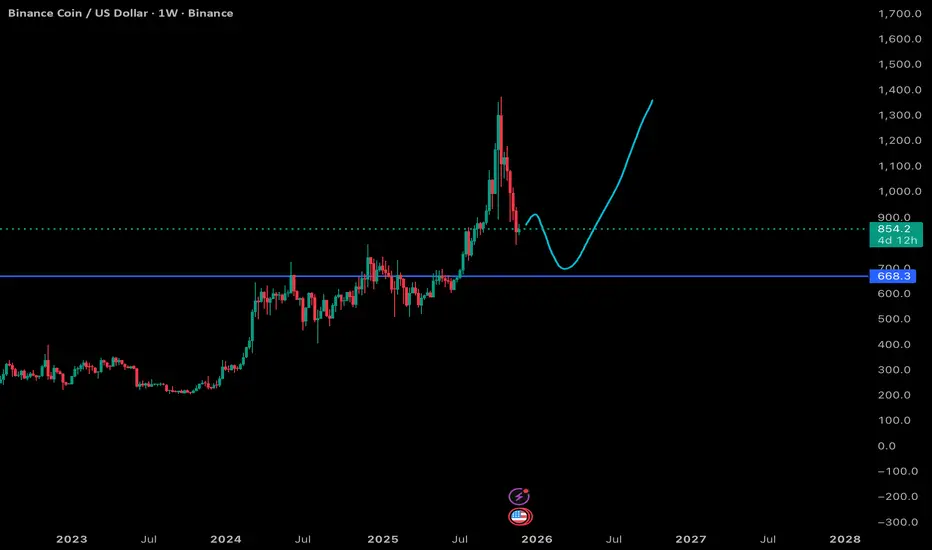
BNB Wave Analysis – 24 November 2025- BNB reversed from support area
- Likely to rise to resistance level 900.00
BNB cryptocurrency recently reversed from support area between the round support level 800.00 (which has been reversing the price from August) and the lower daily Bollinger Band.
The upward reversal from this support are

Can BNB Print Some USDT for Us?Well, time will tell. Let's see how this trade will play out on BINANCE:BNBUSD
Set your limit order now, and when it is triggered, manage your trade.
I would risk 1% of the account balance on this.
Risk management is essential.
See you at full TP or SL.
What do you think about this analysis

BNB/USD – Strongest Structure Here🟢 Bias: Neutral → Bullish
Price: $932
Still well above SMA200 ($835) — rare strength in this environment. RSI ~37 → oversold but flattening.
Key Levels
Resistance: $960 → $1,020
Support: $880 → $835
Read:
BNB continues to behave better than nearly every major alt. Price is holding a higher-time

BNB Weekly Chart Analysis - My thoughts Nov 26 20251. Structure After the Blowoff Top
BNB has clearly broken its parabolic structure. The rejection wick near the 1500 zone and the sustained multi-week sell pressure indicate the trend has shifted into corrective mode. Momentum has cooled, and candles are now printing lower highs and lower lows on t
BNB, downtrend in tact.The downtrend is intact. Price completed macro wave (3) at the R1 pivot, retraced and lost the daily 200EMA, 0.236 Fibonacci retracement and S1 pivot, but the downtrend looks exhausted.
Wave 4 appears complete with a textbook ABC correction ending at strong support and the channel bottom. The downt

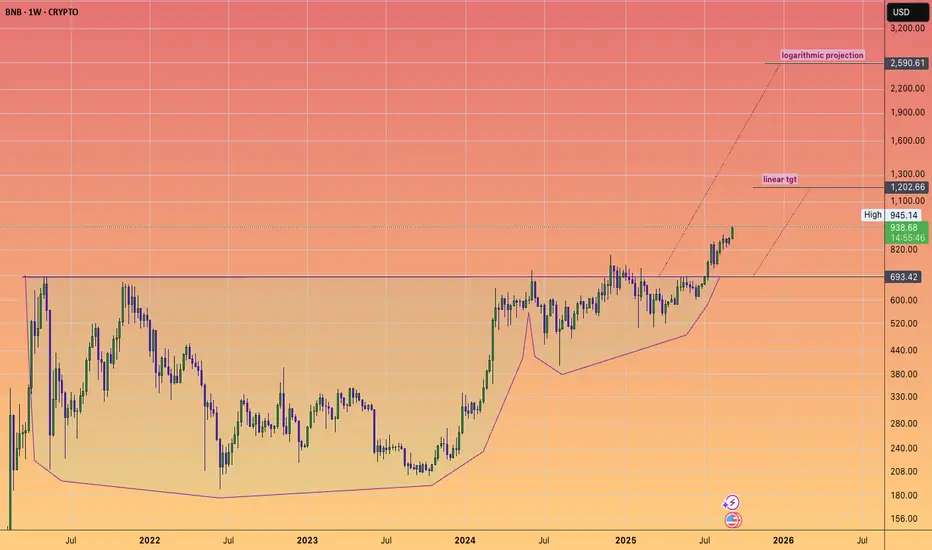
BNB is in price discovery. How high can it go?We're looking at around $2600, and indeed these projections can be met and exceeded.
So plenty of upside left it appears.
If we compare BNB to ETH
BNB has a marketcap of $130 Billion
ETH = $562 B
BNB has a deflationary model;
Quarterly formulaic burns.
And real time burning of gas fees via smar
See all ideas
Summarizing what the indicators are suggesting.
Oscillators
Neutral
SellBuy
Strong sellStrong buy
Strong sellSellNeutralBuyStrong buy
Oscillators
Neutral
SellBuy
Strong sellStrong buy
Strong sellSellNeutralBuyStrong buy
Summary
Neutral
SellBuy
Strong sellStrong buy
Strong sellSellNeutralBuyStrong buy
Summary
Neutral
SellBuy
Strong sellStrong buy
Strong sellSellNeutralBuyStrong buy
Summary
Neutral
SellBuy
Strong sellStrong buy
Strong sellSellNeutralBuyStrong buy
Moving Averages
Neutral
SellBuy
Strong sellStrong buy
Strong sellSellNeutralBuyStrong buy
Moving Averages
Neutral
SellBuy
Strong sellStrong buy
Strong sellSellNeutralBuyStrong buy
Displays a symbol's price movements over previous years to identify recurring trends.
Curated watchlists where BNBUSD is featured.

Centralized exchange tokens: Stuck in the middle with you
7 No. of Symbols

Crypto tokens: Chips and dips
24 No. of Symbols

Staking Coins: Pick up a stake
18 No. of Symbols

Top altcoins: Choose your alternatives carefully
28 No. of Symbols
See all sparks
Frequently Asked Questions
The current price of Binance Coin (BNB) is 893.1 USD — it has risen 1.63% in the past 24 hours. Try placing this info into the context by checking out what coins are also gaining and losing at the moment and seeing BNB price chart.
The current market capitalization of Binance Coin (BNB) is 123.01 B USD. To see this number in a context check out our list of crypto coins ranked by their market caps or see crypto market cap charts.
Binance Coin (BNB) trading volume in 24 hours is 1.85 B USD. See how often other coins are traded in this list.
Binance Coin price has fallen by −5.98% over the last week, its month performance shows a −22.86% decrease, and as for the last year, Binance Coin has increased by 40.45%. See more dynamics on BNB price chart.
Keep track of coins' changes with our Crypto Coins Heatmap.
Keep track of coins' changes with our Crypto Coins Heatmap.
Binance Coin (BNB) reached its highest price on Oct 13, 2025 — it amounted to 1,375.9 USD. Find more insights on the BNB price chart.
See the list of crypto gainers and choose what best fits your strategy.
See the list of crypto gainers and choose what best fits your strategy.
Binance Coin (BNB) reached the lowest price of 0.02141498 USD on Jul 14, 2017. View more Binance Coin dynamics on the price chart.
See the list of crypto losers to find unexpected opportunities.
See the list of crypto losers to find unexpected opportunities.
The current circulating supply of Binance Coin (BNB) is 137.74 M USD. To get a wider picture you can check out our list of coins with the highest circulating supply, as well as the ones with the lowest number of tokens in circulation.
Binance Coin has the limit of 137.74 M coins. No matter how the currency evolves, no new coins will be released after this number is reached.
The safest choice when buying BNB is to go to a well-known crypto exchange. Some of the popular names are Binance, Coinbase, Kraken. But you'll have to find a reliable broker and create an account first. You can trade BNB right from TradingView charts — just choose a broker and connect to your account.
Crypto markets are famous for their volatility, so one should study all the available stats before adding crypto assets to their portfolio. Very often it's technical analysis that comes in handy. We prepared technical ratings for Binance Coin (BNB): today its technical analysis shows the neutral signal, and according to the 1 week rating BNB shows the buy signal. And you'd better dig deeper and study 1 month rating too — it's buy. Find inspiration in Binance Coin trading ideas and keep track of what's moving crypto markets with our crypto news feed.
Binance Coin (BNB) is just as reliable as any other crypto asset — this corner of the world market is highly volatile. Today, for instance, Binance Coin is estimated as 4.81% volatile. The only thing it means is that you must prepare and examine all available information before making a decision. And if you're not sure about Binance Coin, you can find more inspiration in our curated watchlists.
You can discuss Binance Coin (BNB) with other users in our public chats, Minds or in the comments to Ideas.