When the Market Begins to Whisper RecoveryHello everyone,
Solana (SOL) is showing encouraging signs of recovery after a notable correction. Currently trading around $185.9, SOL has bounced from the 190–200 USD region, leaving behind a Fair Value Gap (FVG) just above. This suggests the market is rebalancing after a sell-off, with buying pr
Key facts today
Key stats
About Solana
Solana is a blockchain fairly new to the crypto game, but that's not to say it's not a serious player. Attempting to rival smart-contract titan Ethereum for the NFT and web3 crown, Solana has a strong focus on scalability through its hybrid proof-of-history/proof-of-stake consensus that aims to accommodate a flourishing dApp ecosystem. Its native token SOL has enjoyed the successes of Solana-based NFTs and dApps, but since its inception has also felt the strain of the network’s tendency to experience outages. Although that hasn't stopped it from reaching the top 15 coins by market cap.
Related coins

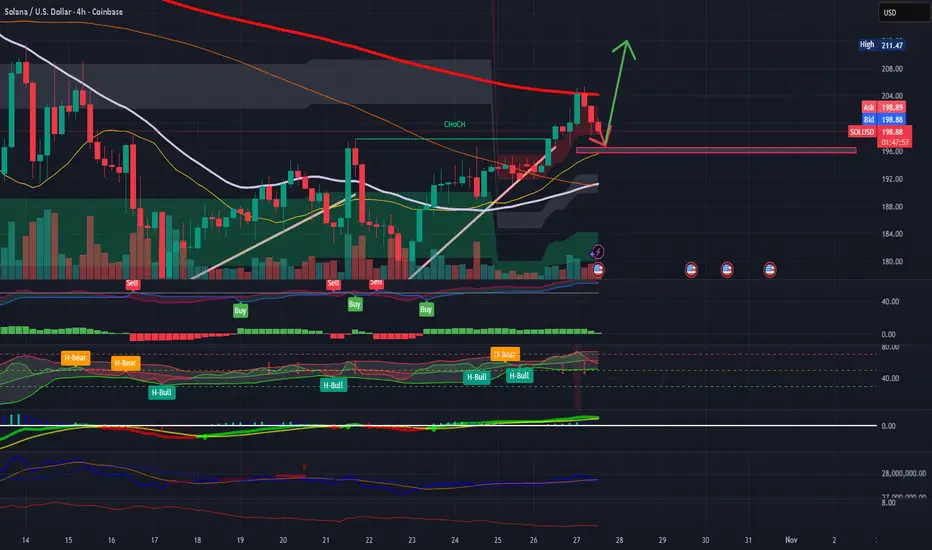
SOL/USD Strong Bullish Trend Bullish from key support 199.30📈 SOLUSD Technical Update (30-Min Time Frame) 💰
🚀 Bullish Trend in play — Buyers holding strong around the 198.30 zone!
If momentum continues, we’re eyeing the following
target levels:
🎯 1st Target: 201.60
🎯 2nd Target: 202.50
🎯 3rd Target: 205.20
Stay alert, traders! Watch for confirmations and

Bullish or Bearish for Solana? give me your opinions here these are the levels I have considered for solana future price. what is your opinions.
and also, share your targets frens 👇

SOL/USD Short Term Wave (4) Dip Before Wave (5) Rally (1h-4h OutSolana is currently consolidating near $200–$205 after a strong impulsive move from the $177 base. On the 1H–4H timeframes, price action suggests that Wave (3) has completed, and the market is preparing for a short-term Wave (4) correction toward $195–$196.
This zone aligns with key confluences — 0
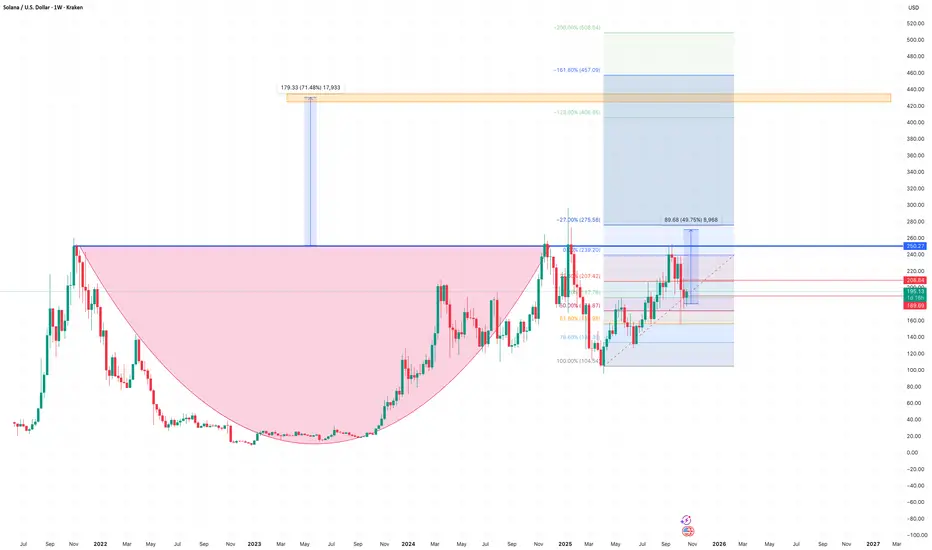
$SOL Solana is sandwiched between the nearly 4-year resistance level of 2021's ATH and the approaching 3-year uptrend.
A squeeze lasting this long typically ends not with a minor breakout but with a major blowout.

SOLANA Dream Buy ZoneSolana is currently forming a very interesting potential ABC corrective structure leading into the 1-1 trend based fibonacci extension being approx. $215. The end of this current Wave C is forming an ending diagonal nearing the apex.
According to Elliot Wave theory, ending diagonals (wedges) tend

Cup and Handle pattern about to playout?A very possible scenario that could playout. All we need is some good news in this world: end of FED QT, more rate cuts and of course the tariff deal with China we have all been waiting for.
Important levels to look for for a breakout in this case are highlighted with green and of course the fib re
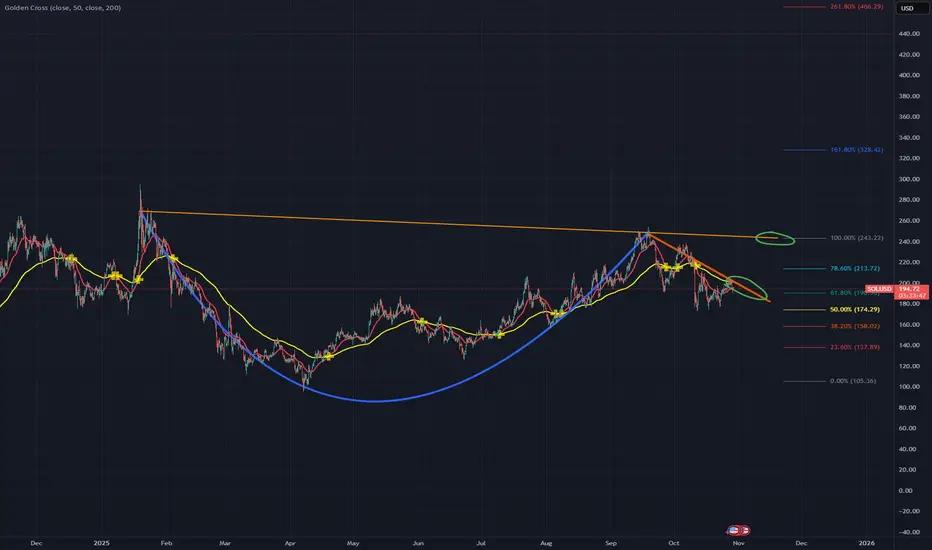
SOLCRYPTOCAP:SOL has formed a clear inverse head and shoulders pattern, a classic bullish reversal setup. The measured move from this structure projects a significant upside if neckline resistance breaks with volume, suggesting the pattern is likely to play out.

(b) Wave Retracement Almost CompleteEarlier, I had some concern that this (b) wave might be concluding too quickly relative to the preceding (a) wave.
While time symmetry isn’t a strict requirement in Elliott Wave analysis, there are moments when a pattern’s timing simply doesn’t pass the “smell test.”
Now, however, we’re seeing pr

See all ideas
Summarizing what the indicators are suggesting.
Oscillators
Neutral
SellBuy
Strong sellStrong buy
Strong sellSellNeutralBuyStrong buy
Oscillators
Neutral
SellBuy
Strong sellStrong buy
Strong sellSellNeutralBuyStrong buy
Summary
Neutral
SellBuy
Strong sellStrong buy
Strong sellSellNeutralBuyStrong buy
Summary
Neutral
SellBuy
Strong sellStrong buy
Strong sellSellNeutralBuyStrong buy
Summary
Neutral
SellBuy
Strong sellStrong buy
Strong sellSellNeutralBuyStrong buy
Moving Averages
Neutral
SellBuy
Strong sellStrong buy
Strong sellSellNeutralBuyStrong buy
Moving Averages
Neutral
SellBuy
Strong sellStrong buy
Strong sellSellNeutralBuyStrong buy
Displays a symbol's price movements over previous years to identify recurring trends.
Curated watchlists where SOLUSD is featured.

Gen 3 crypto: A new day dawns…
25 No. of Symbols

Smart contracts: Make the smart decision
36 No. of Symbols

Staking Coins: Pick up a stake
18 No. of Symbols

Top altcoins: Choose your alternatives carefully
28 No. of Symbols

Up-and-coming crypto: New kids on the block
30 No. of Symbols
See all sparks
Frequently Asked Questions
The current price of Solana (SOL) is 184.37 USD — it has fallen −1.61% in the past 24 hours. Try placing this info into the context by checking out what coins are also gaining and losing at the moment and seeing SOL price chart.
The current market capitalization of Solana (SOL) is 101.86 B USD. To see this number in a context check out our list of crypto coins ranked by their market caps or see crypto market cap charts.
Solana (SOL) trading volume in 24 hours is 2.99 B USD. See how often other coins are traded in this list.
Solana price has fallen by −5.46% over the last week, its month performance shows a −21.97% decrease, and as for the last year, Solana has increased by 11.07%. See more dynamics on SOL price chart.
Keep track of coins' changes with our Crypto Coins Heatmap.
Keep track of coins' changes with our Crypto Coins Heatmap.
Solana (SOL) reached its highest price on Jan 19, 2025 — it amounted to 295.00 USD. Find more insights on the SOL price chart.
See the list of crypto gainers and choose what best fits your strategy.
See the list of crypto gainers and choose what best fits your strategy.
Solana (SOL) reached the lowest price of 8.00 USD on Dec 29, 2022. View more Solana dynamics on the price chart.
See the list of crypto losers to find unexpected opportunities.
See the list of crypto losers to find unexpected opportunities.
The current circulating supply of Solana (SOL) is 613.13 M USD. To get a wider picture you can check out our list of coins with the highest circulating supply, as well as the ones with the lowest number of tokens in circulation.
The safest choice when buying SOL is to go to a well-known crypto exchange. Some of the popular names are Binance, Coinbase, Kraken. But you'll have to find a reliable broker and create an account first. You can trade SOL right from TradingView charts — just choose a broker and connect to your account.
Crypto markets are famous for their volatility, so one should study all the available stats before adding crypto assets to their portfolio. Very often it's technical analysis that comes in handy. We prepared technical ratings for Solana (SOL): today its technical analysis shows the sell signal, and according to the 1 week rating SOL shows the neutral signal. And you'd better dig deeper and study 1 month rating too — it's buy. Find inspiration in Solana trading ideas and keep track of what's moving crypto markets with our crypto news feed.
Solana (SOL) is just as reliable as any other crypto asset — this corner of the world market is highly volatile. Today, for instance, Solana is estimated as 3.42% volatile. The only thing it means is that you must prepare and examine all available information before making a decision. And if you're not sure about Solana, you can find more inspiration in our curated watchlists.
You can discuss Solana (SOL) with other users in our public chats, Minds or in the comments to Ideas.