4h double top | 1d Stoch RSI curl | Watch 6800
Thanks for watching my analysis and give me a thumbs up or share your thoughts/ideas! Cheers
Comment:
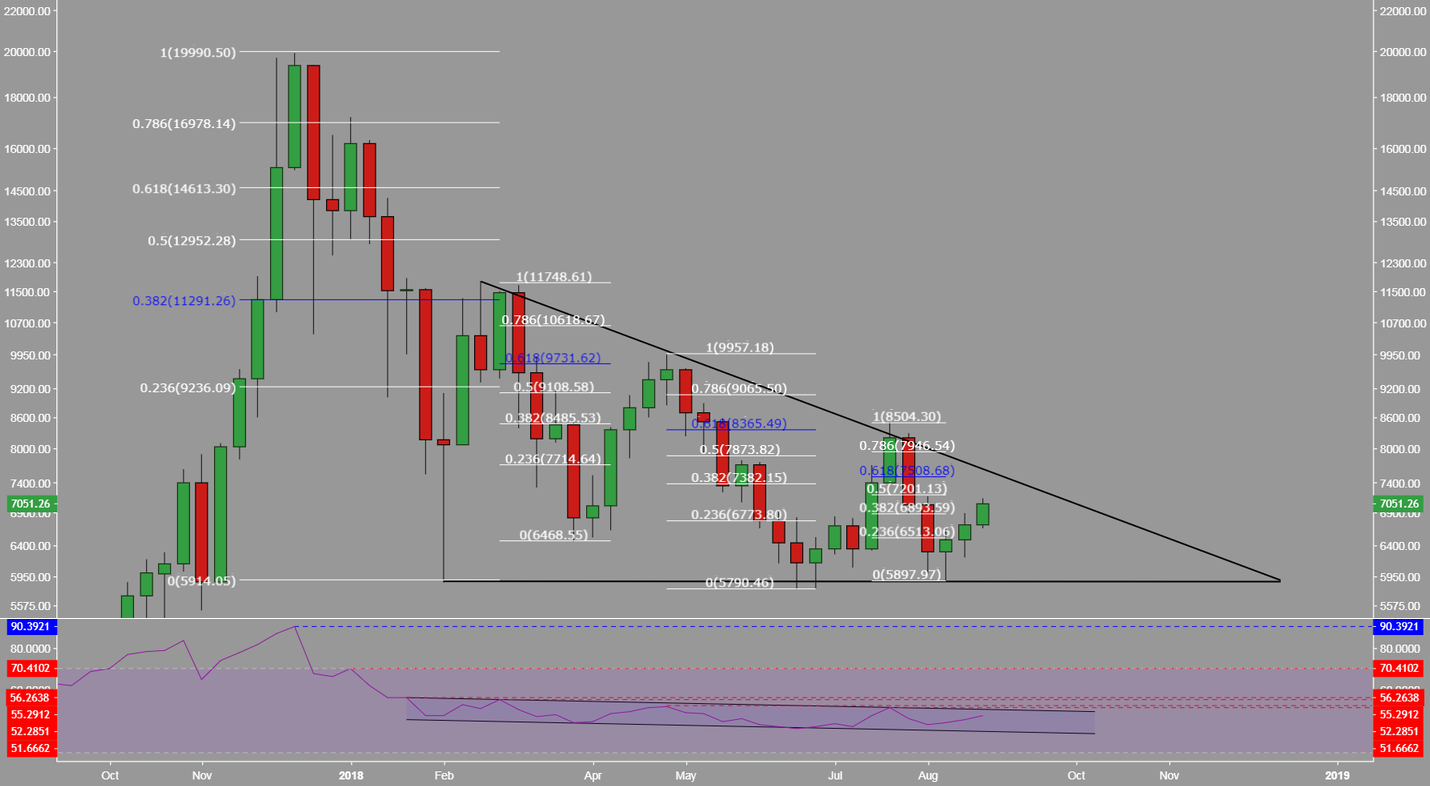
Weekly, long-term view update as per fibs:

Comment:
Since the beginning of December we've seen every subsequent bounce create a lower high. However if we map this lower high to the previous corrective cycle's fibs, we can barely get over the 618 fib level for the past two cycles. This also creates an interesting descending triangle--a bearish pattern when the prevailing trend is down. So if we try to map our current move, the height of it could potentially be around $7400-7500 max. We also have the weekly RSI showing that it's trapped in a channel and creating lower highs. Overall we are still in an overwhelming macro downtrend. Be cautious in this market in thinking we've marked the end of the bear cycle.

Join our Crypto movement with Alpha Trades
1h ascending triangle broken down
4h srsi coming down + catching support on $6950 + middle band Bollinger + double top forming (momentum and bull pressure slowing down) Red rectangle area of range trading
1d ichi cloud kijun + kumo bottom meeting us + 50 fibonacci + red trend line (Bitfinex) + find support on 50MA
Bitcoin breaking out of rising wedge and 1d bear flag but will it last
1d shooting star, gravestone dojo or a bearish engulfing If broken watch for retrace to 6800 then 6600