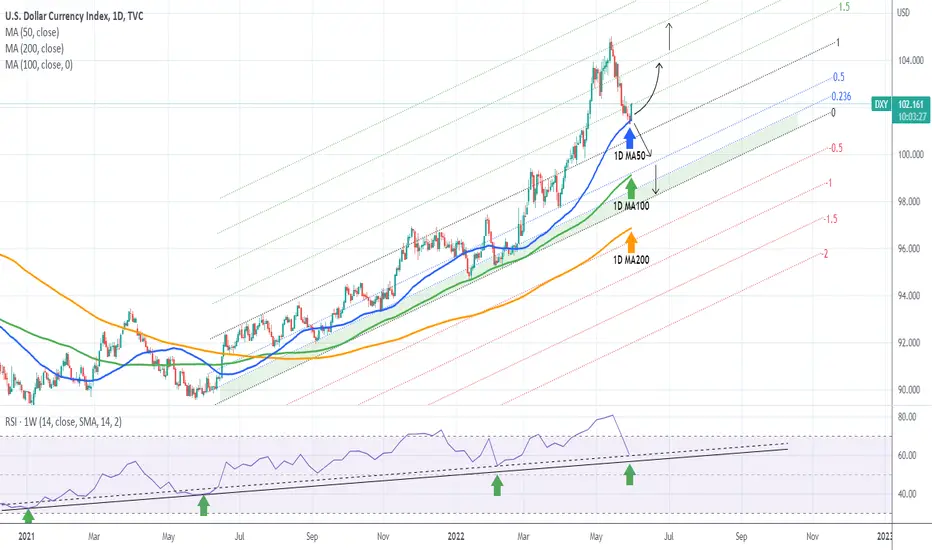
The U.S. Dollar Index (DXY) hit yesterday the 1D MA50 (blue trend-line) for the first time since February 23. Today's rebound simply shows why this MA level is considered such an important short/ medium-term Support. As long as it holds, expect a rebound to the upper Fibonacci extension levels of 2.0 and 2.5 that previously led to the May 13 High.
A weekly closing below the 1D MA50 though would mean an extension of this correction towards the 1D MA100 (green trend-line), which acted as a Support on Feb 10 and the 1D MA200 (orange trend-line), which has been untouched since June 23 2021.
Pay very close attention to the RSI on the 1W time-frame on the pane below the chart as it is testing the Higher Lows trend-line that practically started this aggressive multi-month trend back in January 2021.
--------------------------------------------------------------------------------------------------------
** Please support this idea with your likes and comments, it is the best way to keep it relevant and support me. **
--------------------------------------------------------------------------------------------------------
👑Best Signals (Forex/Crypto+70% accuracy) & Account Management (+20% profit/month on 10k accounts)
💰Free Channel t.me/tradingshotglobal
🤵Contact info@tradingshot.com t.me/tradingshot
🔥New service: next X100 crypto GEMS!
💰Free Channel t.me/tradingshotglobal
🤵Contact info@tradingshot.com t.me/tradingshot
🔥New service: next X100 crypto GEMS!
Disclaimer
The information and publications are not meant to be, and do not constitute, financial, investment, trading, or other types of advice or recommendations supplied or endorsed by TradingView. Read more in the Terms of Use.