Introduction (Market Context)
Ether Futures (ETH) and Micro Ether Futures (MET) have been at the center of market attention since April 2025, when prices staged a remarkable rally of more than +250%. This surge was not just a technical phenomenon—it came in the wake of major macro events such as Liberation Day and the reemergence of U.S. tariff policies under Donald Trump’s administration. Those developments sparked speculative flows into digital assets, with Ether acting as one of the prime beneficiaries of capital rotation.
Yet markets rarely move in one direction forever. After such a sharp rise, technical exhaustion often follows, and signs of that exhaustion are beginning to surface on ETH’s daily chart. Traders who enjoyed the rally now face a critical juncture: whether to protect gains or to consider new opportunities in the opposite direction. The key lies in a pattern that has appeared many times in history, often marking important reversals—the Rising Wedge.
What is a Rising Wedge?
A Rising Wedge is one of the most recognizable bearish reversal formations in technical analysis. It typically develops after a strong uptrend, where price continues to push higher but does so with diminishing momentum. On the chart, the highs and lows still point upward, but the slope of the highs is shallower than the slope of the lows, creating a narrowing upward channel.
The psychology behind the wedge is critical: buyers are still in control, but they are running out of strength with every push higher. Sellers begin to absorb demand more aggressively, and eventually, price breaks through the lower boundary of the wedge. This breakdown often accelerates as trapped buyers unwind positions.
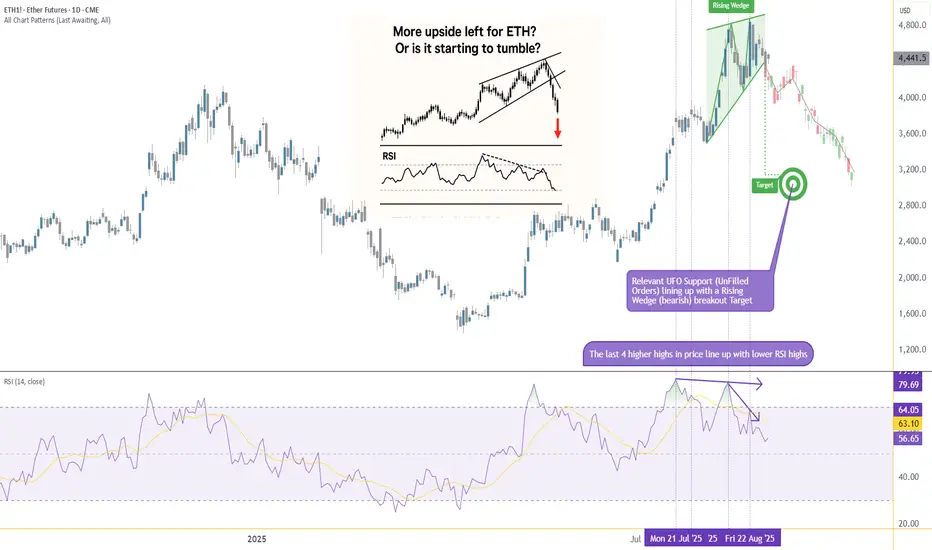
From a measurement perspective, technicians project the maximum width of the wedge at its start, and then apply that distance downward from the point of breakdown. This projection offers a technical target for where price may gravitate in the following weeks. In the case of Ether Futures, that target points toward the 3,200 area, a level of strong technical interest and a logical area for traders to watch closely.
RSI and Bearish Divergence
Alongside the wedge, momentum indicators add further weight to the bearish case. The Relative Strength Index (RSI) is a widely used oscillator that measures momentum on a scale of 0 to 100. Values above 70 are generally interpreted as “overbought,” while values below 30 suggest “oversold.”
The most powerful signals often emerge not when RSI is at an extreme, but when it diverges from price action. A bearish divergence occurs when price sets higher highs while RSI forms lower highs. This is an indication that upward momentum is weakening even as price appears to climb.
Ether Futures have displayed this phenomenon clearly over the past few weeks. The daily chart shows four successive higher highs in price, yet RSI failed to confirm these moves, instead tracing a series of lower peaks. Notably, RSI pierced the overbought zone above 70 twice during this period, but momentum faded quickly after each attempt. This divergence is a classic early warning sign that a bullish run is running out of steam.
Forward-Looking Trade Idea
With the Rising Wedge breakdown and RSI divergence in place, a structured trade plan emerges. Futures traders can express this view through either the standard Ether Futures contract (ETH) or its smaller counterpart, the Micro Ether Futures contract (MET).
Contract Specs & Margins
Trade Plan (Bearish Setup)
The projected wedge target around 3,200 is not only a measured move from the pattern but also sits close to a previously established UFO support zone. While anecdotal, this confluence reinforces the credibility of the level as a potential magnet for price.
Risk Management
Regardless of how compelling a technical setup may appear, the most decisive factor in trading remains risk management. Defining risk in advance ensures that losses are limited if the market behaves unexpectedly. In this case, placing the stop at 4,702 not only keeps risk under control but also aligns with a minor resistance level, making the trade plan technically coherent.
Position sizing also plays a crucial role. The availability of Micro Ether Futures (MET) allows traders to participate with significantly reduced capital requirements compared to the full-sized ETH contract. This flexibility makes it easier to fine-tune exposure and manage account risk more precisely.
Equally important is the discipline of adhering to precise entries and exits. Chasing a trade or ignoring pre-defined stop levels can erode the edge provided by technical analysis. Markets often deliver multiple opportunities, but without sound risk management, traders may not survive long enough to benefit from them. Ultimately, capital preservation is the foundation on which consistent performance is built.
Closing
Ether’s spectacular rally since April 2025 is a reminder of the asset’s ability to deliver explosive moves under the right conditions. Yet history shows that parabolic advances rarely continue uninterrupted. The combination of a Rising Wedge breakdown and a confirmed RSI divergence provides strong evidence that the current uptrend is losing momentum, and the market may be entering a corrective phase.
For traders, this is less about predicting the future and more about recognizing when probabilities align in favor of a defined setup. With clear entry, target, and stop levels, the ETH and MET contracts offer a structured opportunity for those willing to take a bearish stance while managing their risk appropriately.
When charting futures, the data provided could be delayed. Traders working with the ticker symbols discussed in this idea may prefer to use CME Group real-time data plan on TradingView: tradingview.com/cme/ - This consideration is particularly important for shorter-term traders, whereas it may be less critical for those focused on longer-term trading strategies.
General Disclaimer:
The trade ideas presented herein are solely for illustrative purposes forming a part of a case study intended to demonstrate key principles in risk management within the context of the specific market scenarios discussed. These ideas are not to be interpreted as investment recommendations or financial advice. They do not endorse or promote any specific trading strategies, financial products, or services. The information provided is based on data believed to be reliable; however, its accuracy or completeness cannot be guaranteed. Trading in financial markets involves risks, including the potential loss of principal. Each individual should conduct their own research and consult with professional financial advisors before making any investment decisions. The author or publisher of this content bears no responsibility for any actions taken based on the information provided or for any resultant financial or other losses.
Ether Futures (ETH) and Micro Ether Futures (MET) have been at the center of market attention since April 2025, when prices staged a remarkable rally of more than +250%. This surge was not just a technical phenomenon—it came in the wake of major macro events such as Liberation Day and the reemergence of U.S. tariff policies under Donald Trump’s administration. Those developments sparked speculative flows into digital assets, with Ether acting as one of the prime beneficiaries of capital rotation.
Yet markets rarely move in one direction forever. After such a sharp rise, technical exhaustion often follows, and signs of that exhaustion are beginning to surface on ETH’s daily chart. Traders who enjoyed the rally now face a critical juncture: whether to protect gains or to consider new opportunities in the opposite direction. The key lies in a pattern that has appeared many times in history, often marking important reversals—the Rising Wedge.
What is a Rising Wedge?
A Rising Wedge is one of the most recognizable bearish reversal formations in technical analysis. It typically develops after a strong uptrend, where price continues to push higher but does so with diminishing momentum. On the chart, the highs and lows still point upward, but the slope of the highs is shallower than the slope of the lows, creating a narrowing upward channel.
The psychology behind the wedge is critical: buyers are still in control, but they are running out of strength with every push higher. Sellers begin to absorb demand more aggressively, and eventually, price breaks through the lower boundary of the wedge. This breakdown often accelerates as trapped buyers unwind positions.
From a measurement perspective, technicians project the maximum width of the wedge at its start, and then apply that distance downward from the point of breakdown. This projection offers a technical target for where price may gravitate in the following weeks. In the case of Ether Futures, that target points toward the 3,200 area, a level of strong technical interest and a logical area for traders to watch closely.
RSI and Bearish Divergence
Alongside the wedge, momentum indicators add further weight to the bearish case. The Relative Strength Index (RSI) is a widely used oscillator that measures momentum on a scale of 0 to 100. Values above 70 are generally interpreted as “overbought,” while values below 30 suggest “oversold.”
The most powerful signals often emerge not when RSI is at an extreme, but when it diverges from price action. A bearish divergence occurs when price sets higher highs while RSI forms lower highs. This is an indication that upward momentum is weakening even as price appears to climb.
Ether Futures have displayed this phenomenon clearly over the past few weeks. The daily chart shows four successive higher highs in price, yet RSI failed to confirm these moves, instead tracing a series of lower peaks. Notably, RSI pierced the overbought zone above 70 twice during this period, but momentum faded quickly after each attempt. This divergence is a classic early warning sign that a bullish run is running out of steam.
Forward-Looking Trade Idea
With the Rising Wedge breakdown and RSI divergence in place, a structured trade plan emerges. Futures traders can express this view through either the standard Ether Futures contract (ETH) or its smaller counterpart, the Micro Ether Futures contract (MET).
Contract Specs & Margins
- Ether Futures (ETH): Notional = 50 Ether, Tick size = 0.50, Tick value = $25.00, Initial margin ≈ $68,800 (subject to CME updates).
- Micro Ether Futures (MET): Notional = 0.1 Ether, Tick size = 0.50, Tick value = $0.05, Initial margin ≈ $140 (subject to CME updates).
Trade Plan (Bearish Setup)
- Direction: Short
- Entry: 4,360
- Target: 3,200
- Stop Loss: 4,702 (coinciding with a minor resistance level)
- Reward-to-Risk Ratio: ≈ 3.39 : 1
The projected wedge target around 3,200 is not only a measured move from the pattern but also sits close to a previously established UFO support zone. While anecdotal, this confluence reinforces the credibility of the level as a potential magnet for price.
Risk Management
Regardless of how compelling a technical setup may appear, the most decisive factor in trading remains risk management. Defining risk in advance ensures that losses are limited if the market behaves unexpectedly. In this case, placing the stop at 4,702 not only keeps risk under control but also aligns with a minor resistance level, making the trade plan technically coherent.
Position sizing also plays a crucial role. The availability of Micro Ether Futures (MET) allows traders to participate with significantly reduced capital requirements compared to the full-sized ETH contract. This flexibility makes it easier to fine-tune exposure and manage account risk more precisely.
Equally important is the discipline of adhering to precise entries and exits. Chasing a trade or ignoring pre-defined stop levels can erode the edge provided by technical analysis. Markets often deliver multiple opportunities, but without sound risk management, traders may not survive long enough to benefit from them. Ultimately, capital preservation is the foundation on which consistent performance is built.
Closing
Ether’s spectacular rally since April 2025 is a reminder of the asset’s ability to deliver explosive moves under the right conditions. Yet history shows that parabolic advances rarely continue uninterrupted. The combination of a Rising Wedge breakdown and a confirmed RSI divergence provides strong evidence that the current uptrend is losing momentum, and the market may be entering a corrective phase.
For traders, this is less about predicting the future and more about recognizing when probabilities align in favor of a defined setup. With clear entry, target, and stop levels, the ETH and MET contracts offer a structured opportunity for those willing to take a bearish stance while managing their risk appropriately.
When charting futures, the data provided could be delayed. Traders working with the ticker symbols discussed in this idea may prefer to use CME Group real-time data plan on TradingView: tradingview.com/cme/ - This consideration is particularly important for shorter-term traders, whereas it may be less critical for those focused on longer-term trading strategies.
General Disclaimer:
The trade ideas presented herein are solely for illustrative purposes forming a part of a case study intended to demonstrate key principles in risk management within the context of the specific market scenarios discussed. These ideas are not to be interpreted as investment recommendations or financial advice. They do not endorse or promote any specific trading strategies, financial products, or services. The information provided is based on data believed to be reliable; however, its accuracy or completeness cannot be guaranteed. Trading in financial markets involves risks, including the potential loss of principal. Each individual should conduct their own research and consult with professional financial advisors before making any investment decisions. The author or publisher of this content bears no responsibility for any actions taken based on the information provided or for any resultant financial or other losses.
🌟 Take This Analysis Further with Our AI Scripts 🎯 | Discover How at tradewithufos.com 🚀 Choose a Subscription: Monthly ᴼᴿ Yearly ᴼᴿ Lifetime 🗓️ | Unlock Intelligent UFO Scripts Free 💡
Related publications
Disclaimer
The information and publications are not meant to be, and do not constitute, financial, investment, trading, or other types of advice or recommendations supplied or endorsed by TradingView. Read more in the Terms of Use.