Summary: Employment data kept investors guessing about the Fed's timeline for bond tapering. However, that did not keep the Nasdaq and S&P 500 from hitting new all-time highs. Defensive sectors led the week, but growth sectors also closed the week with gains.
Notes
The structure is the following:
If you have been following my daily updates, you can skip down to "View on the Week." If not, then this first part is a great play-by-play recap for the week. Click the daily charts for more detail on sectors, indexes, and market leaders each day.
-=x=-=x=-=x=-=x=-=x=-=x=-=x=-
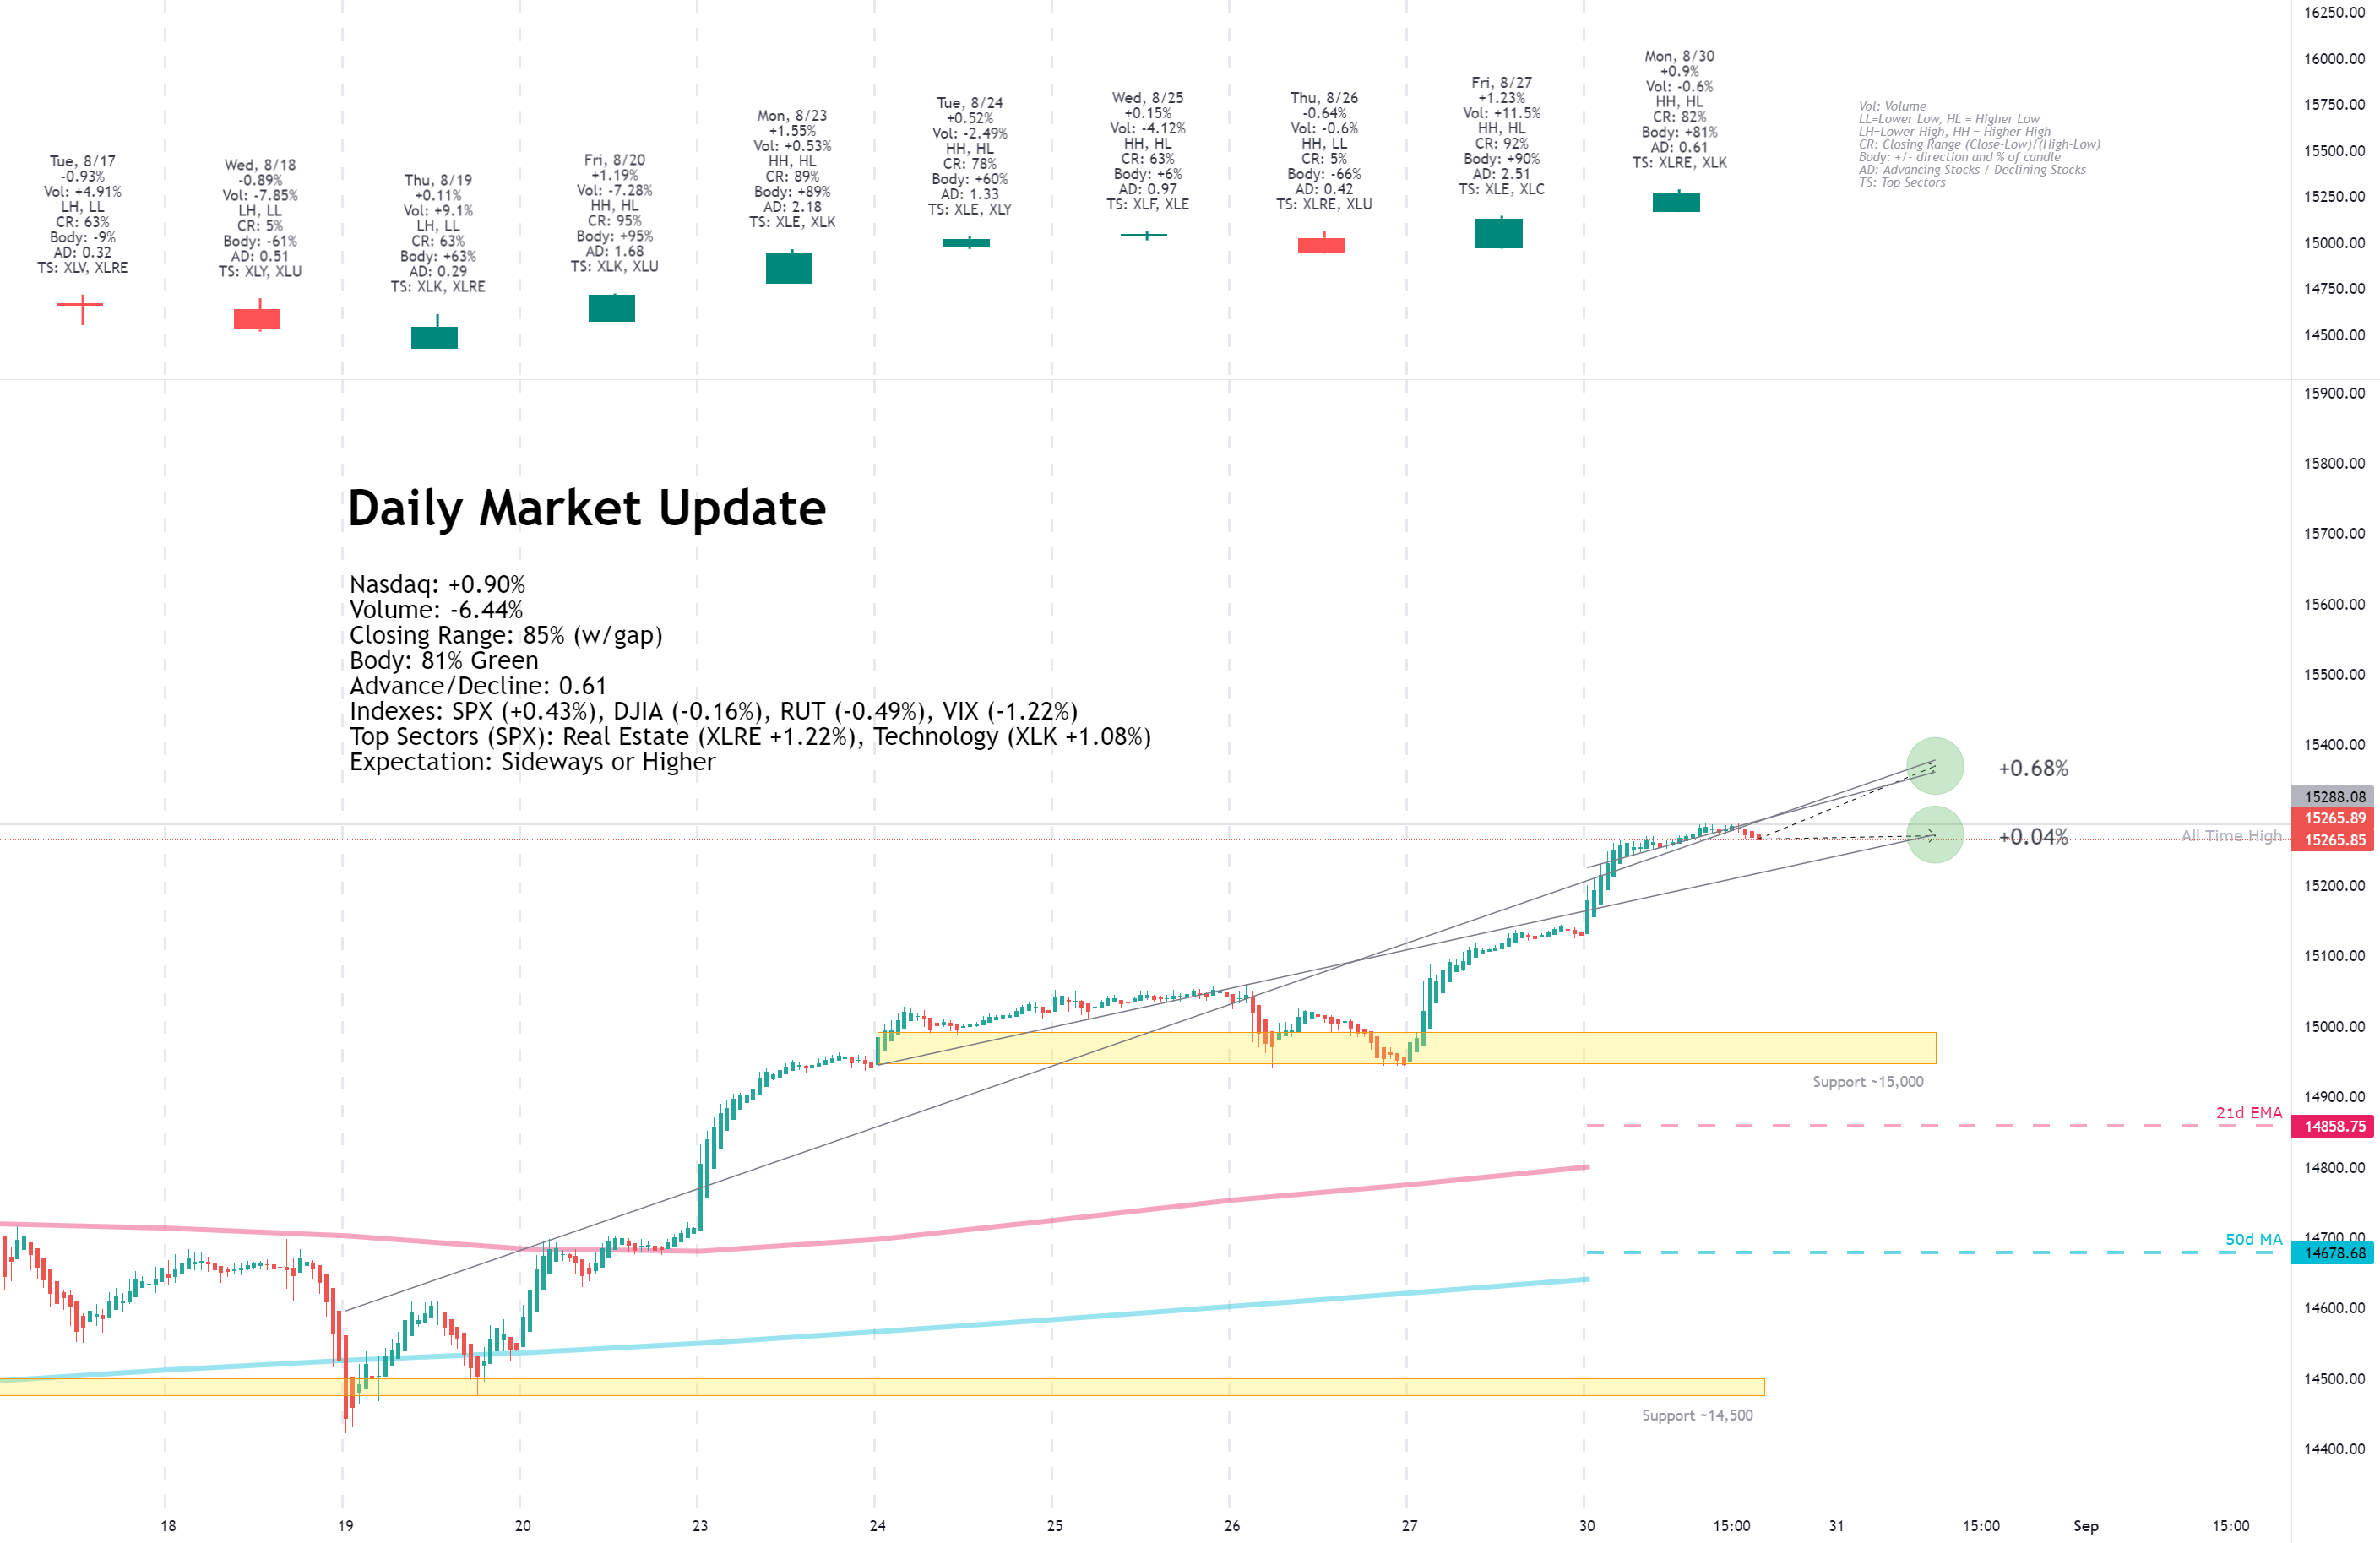
Monday, August 30, 2021

Facts: +0.90%, Volume lower, Closing Range: 85% (w/gap), Body: 81% Green
Good: Strong gain in morning, held near high in the afternoon
Bad: Lower volume, low A/D ratio
Highs/Lows: Higher high, Higher low
Candle: Gap-up at open, with tick green body and tiny upper wick. No lower wick.
Advance/Decline: 0.61, more than three declining stocks for every two advancing
Indexes: SPX (+0.43%), DJIA (-0.16%), RUT (-0.49%), VIX (-1.22%)
Sector List: Real Estate (XLRE +1.22%) and Technology (XLK +1.08%) at the top. Energy (XLE -1.18%) and Financials (XLF -1.41%) at the bottom.
Expectation: Sideways or Higher
Technology stocks rallied today after the Fed expressed a dovish stance toward tapering and interest rate hikes on Friday. Cyclical sectors faded while growth sectors dominated the top of the sector list.
The Nasdaq gained +0.90% for another record close. The closing range of 85% is just under a small upper wick, formed from a dip in the last hour of trading. The 81% Green body developed in the morning rally, with the index leveling off at a new all-time high and holding that level in the afternoon. Volume was lower than the previous day, and there were three declining stocks for every two advancing stocks.
-=x=-=x=-=x=-=x=-=x=-=x=-=x=-
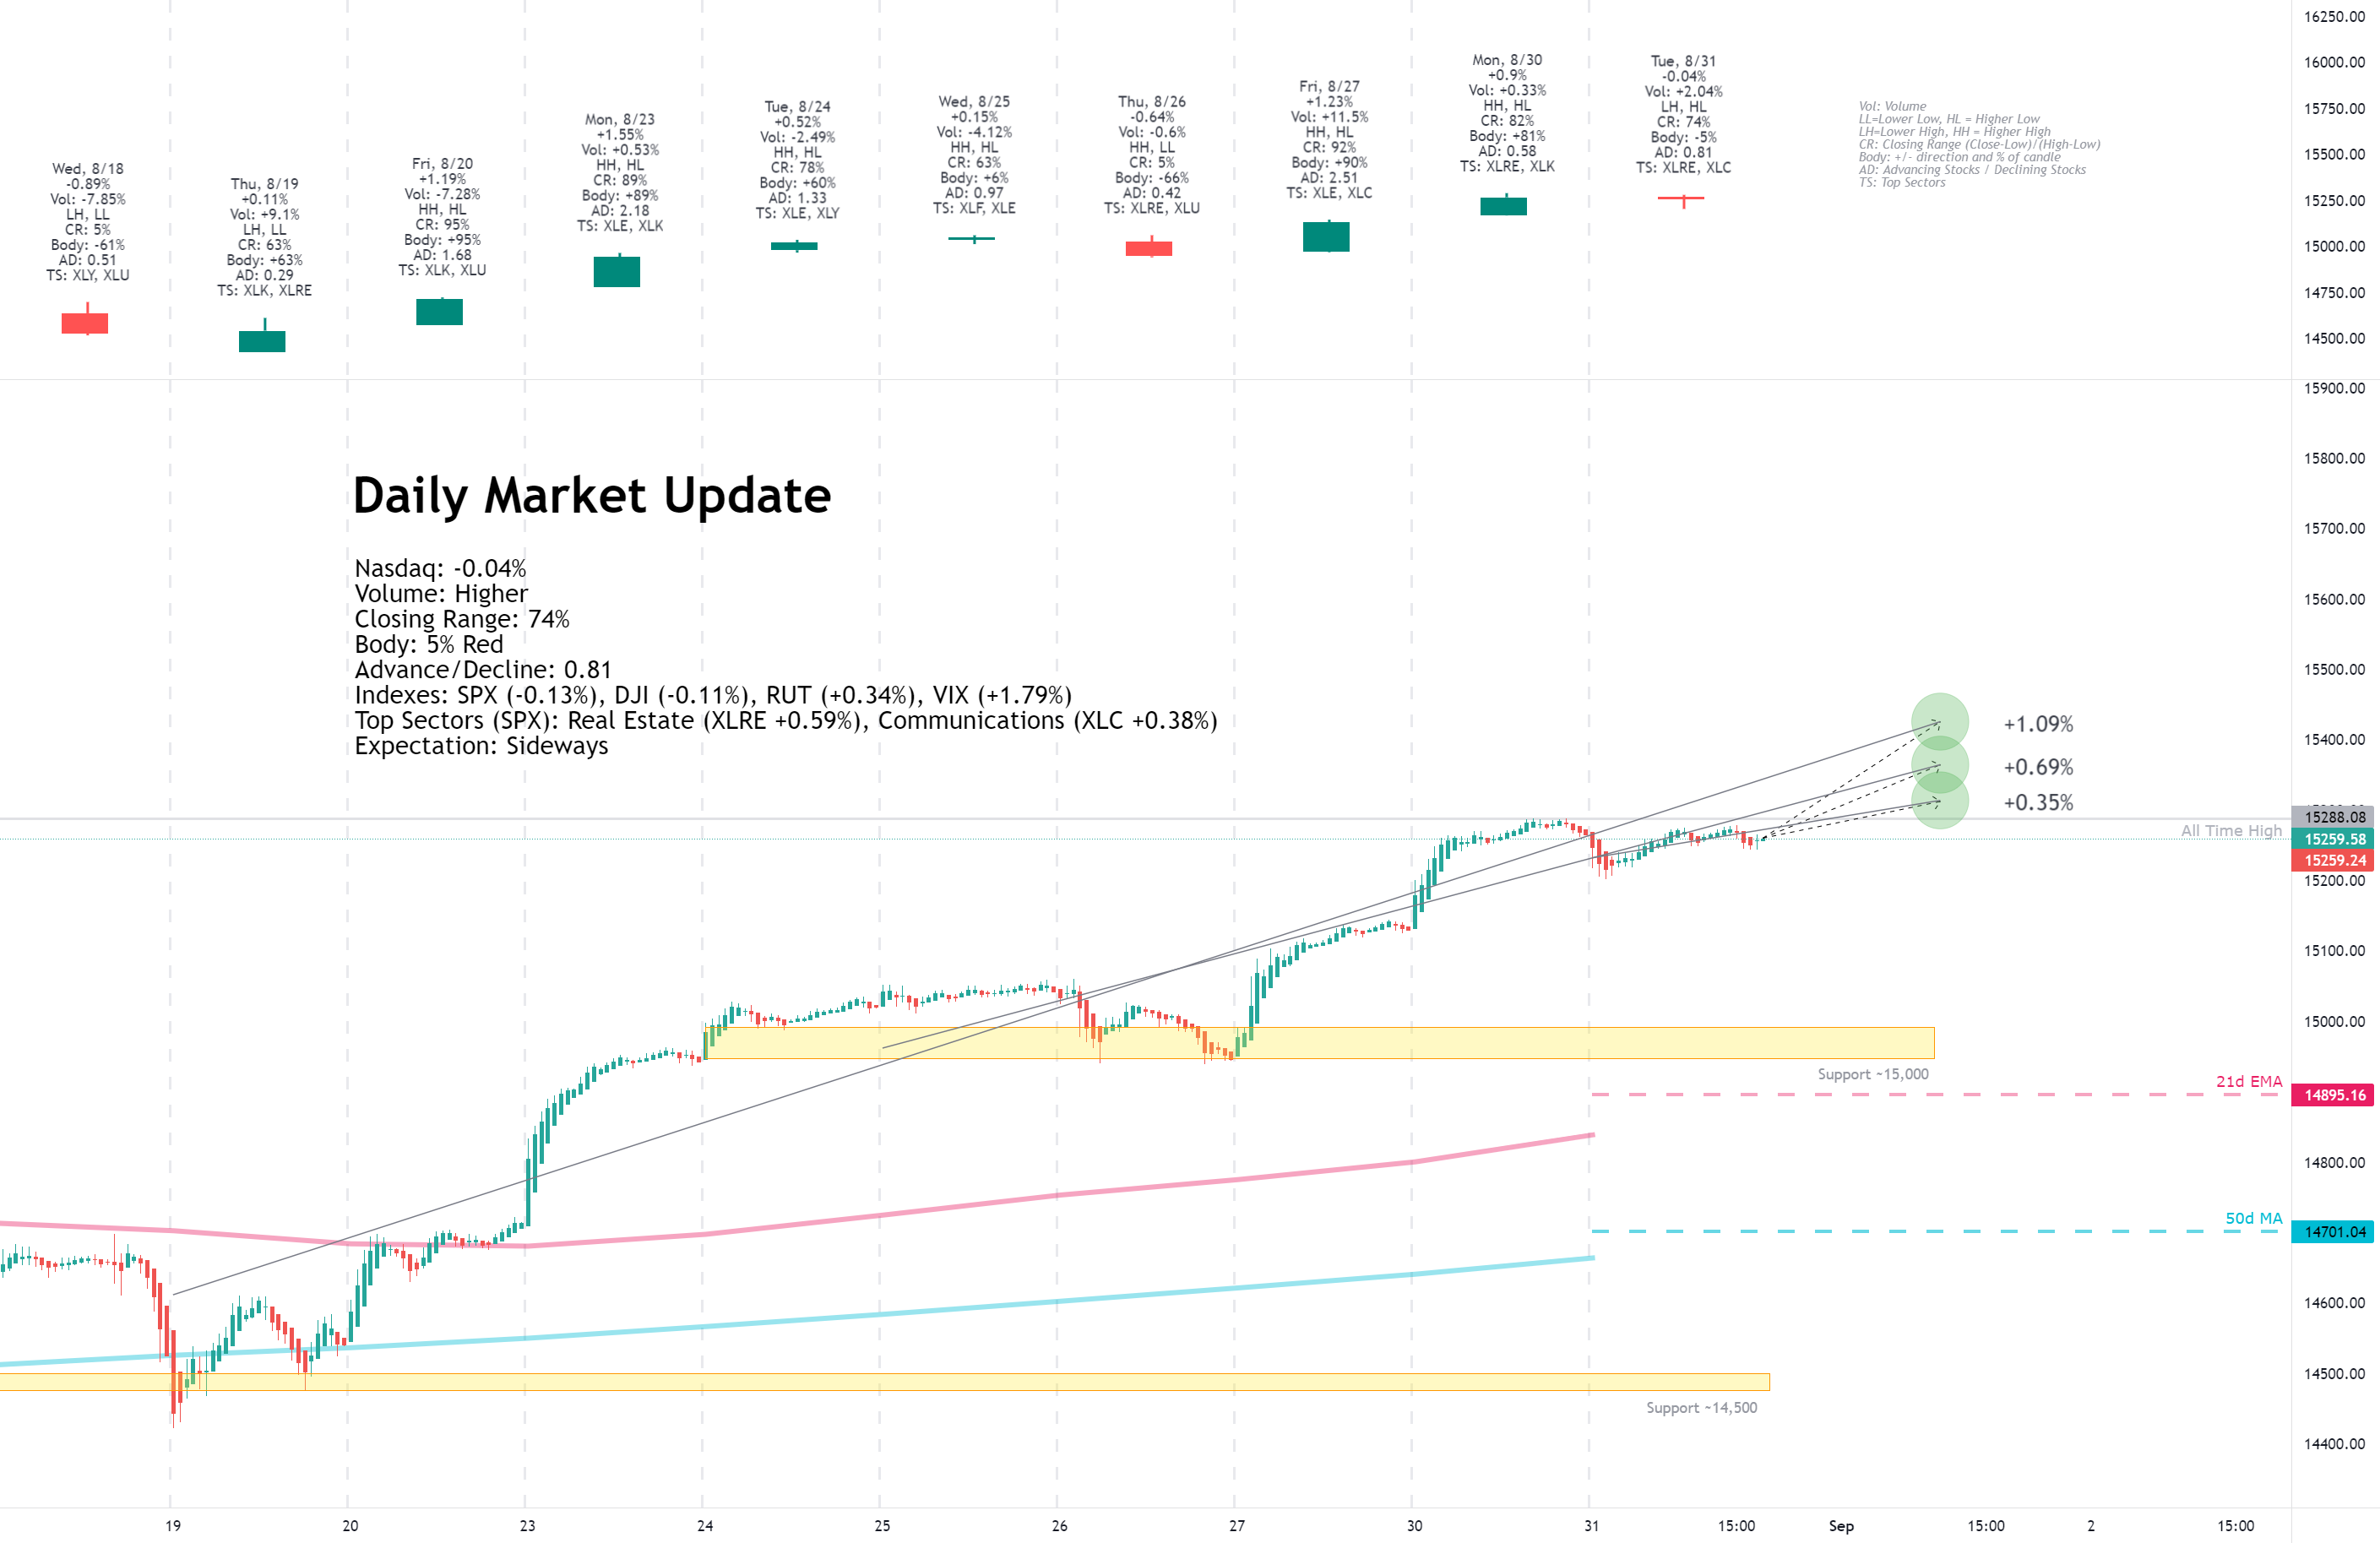
Tuesday, August 31, 2021
Facts: -0.04%, Volume higher, Closing Range: 74%, Body: 5% Red
Good: Higher low continues uptrend, sideways move allows moving averages to catch up
Bad: Lower high, higher volume on decline, A/D ratio
Highs/Lows: Lower high, Higher low
Candle: Inside day with thin body at top of the candle
Advance/Decline: 0.81, more declining than advancing stocks
Indexes: SPX (-0.13%), DJI (-0.11%), RUT (+0.34%), VIX (+1.79%)
Sector List: Real Estate (XLRE +0.59%) and Communications (XLC +0.38%) at the top. Technology (XLK -0.53%) and Energy (XLE -0.68%) at the bottom.
Expectation: Sideways
Markets closed the month of August, moving sideways, but capped another bullish month of gains. The day started with investors swarming defensive sectors, but sentiment flipped, and the sector list scrambled.
The Nasdaq closed with a -0.04% decline on higher volume than the previous day. The inside day started with a dip at open but climbed back to set an intraday high before another more minor dip before the close. That created a thin red body above a longer lower wick, all within the high and low of the previous day. There were more declining stocks than advancing stocks.
-=x=-=x=-=x=-=x=-=x=-=x=-=x=-
Wednesday, September 01, 2021
Facts: +0.33%, Volume higher, Closing Range: 30% (w/gap), Body: 1% Green
Good: Gain on higher volume, higher high, higher low
Bad: Fade from new all-time high
Highs/Lows: Higher high, Higher low
Candle: Gap-up to long upper wick, almost no body, no lower wick
Advance/Decline: 0.99, one advancing for every declining stock
Indexes: SPX (+0.03%), DJI (-0.14%), RUT (+0.58%), VIX (-2.25%)
Sector List: Real Estate (XLRE +1.72%) and Utilities (XLU +1.31%) at the top. Financials (XLF -0.57%) and Energy (XLE -1.47%) at the bottom.
Expectation: Sideways or Lower
Markets rallied in the morning before investors turned defensive and the gains faded, weighed down by big tech stocks that all sold off in the later afternoon. Regardless, most of the market held onto some gain for the day.
The Nasdaq closed with a +0.33% gain but was up 0.80% midday. Volume was higher than the previous day. A gap-up at open turned into a morning rally, creating a long upper wick with no lower wick. However, the index faded in the afternoon, leaving a green body covering only 1% of the candle. There was an equal number of advancing and declining stocks for the day.
-=x=-=x=-=x=-=x=-=x=-=x=-=x=-
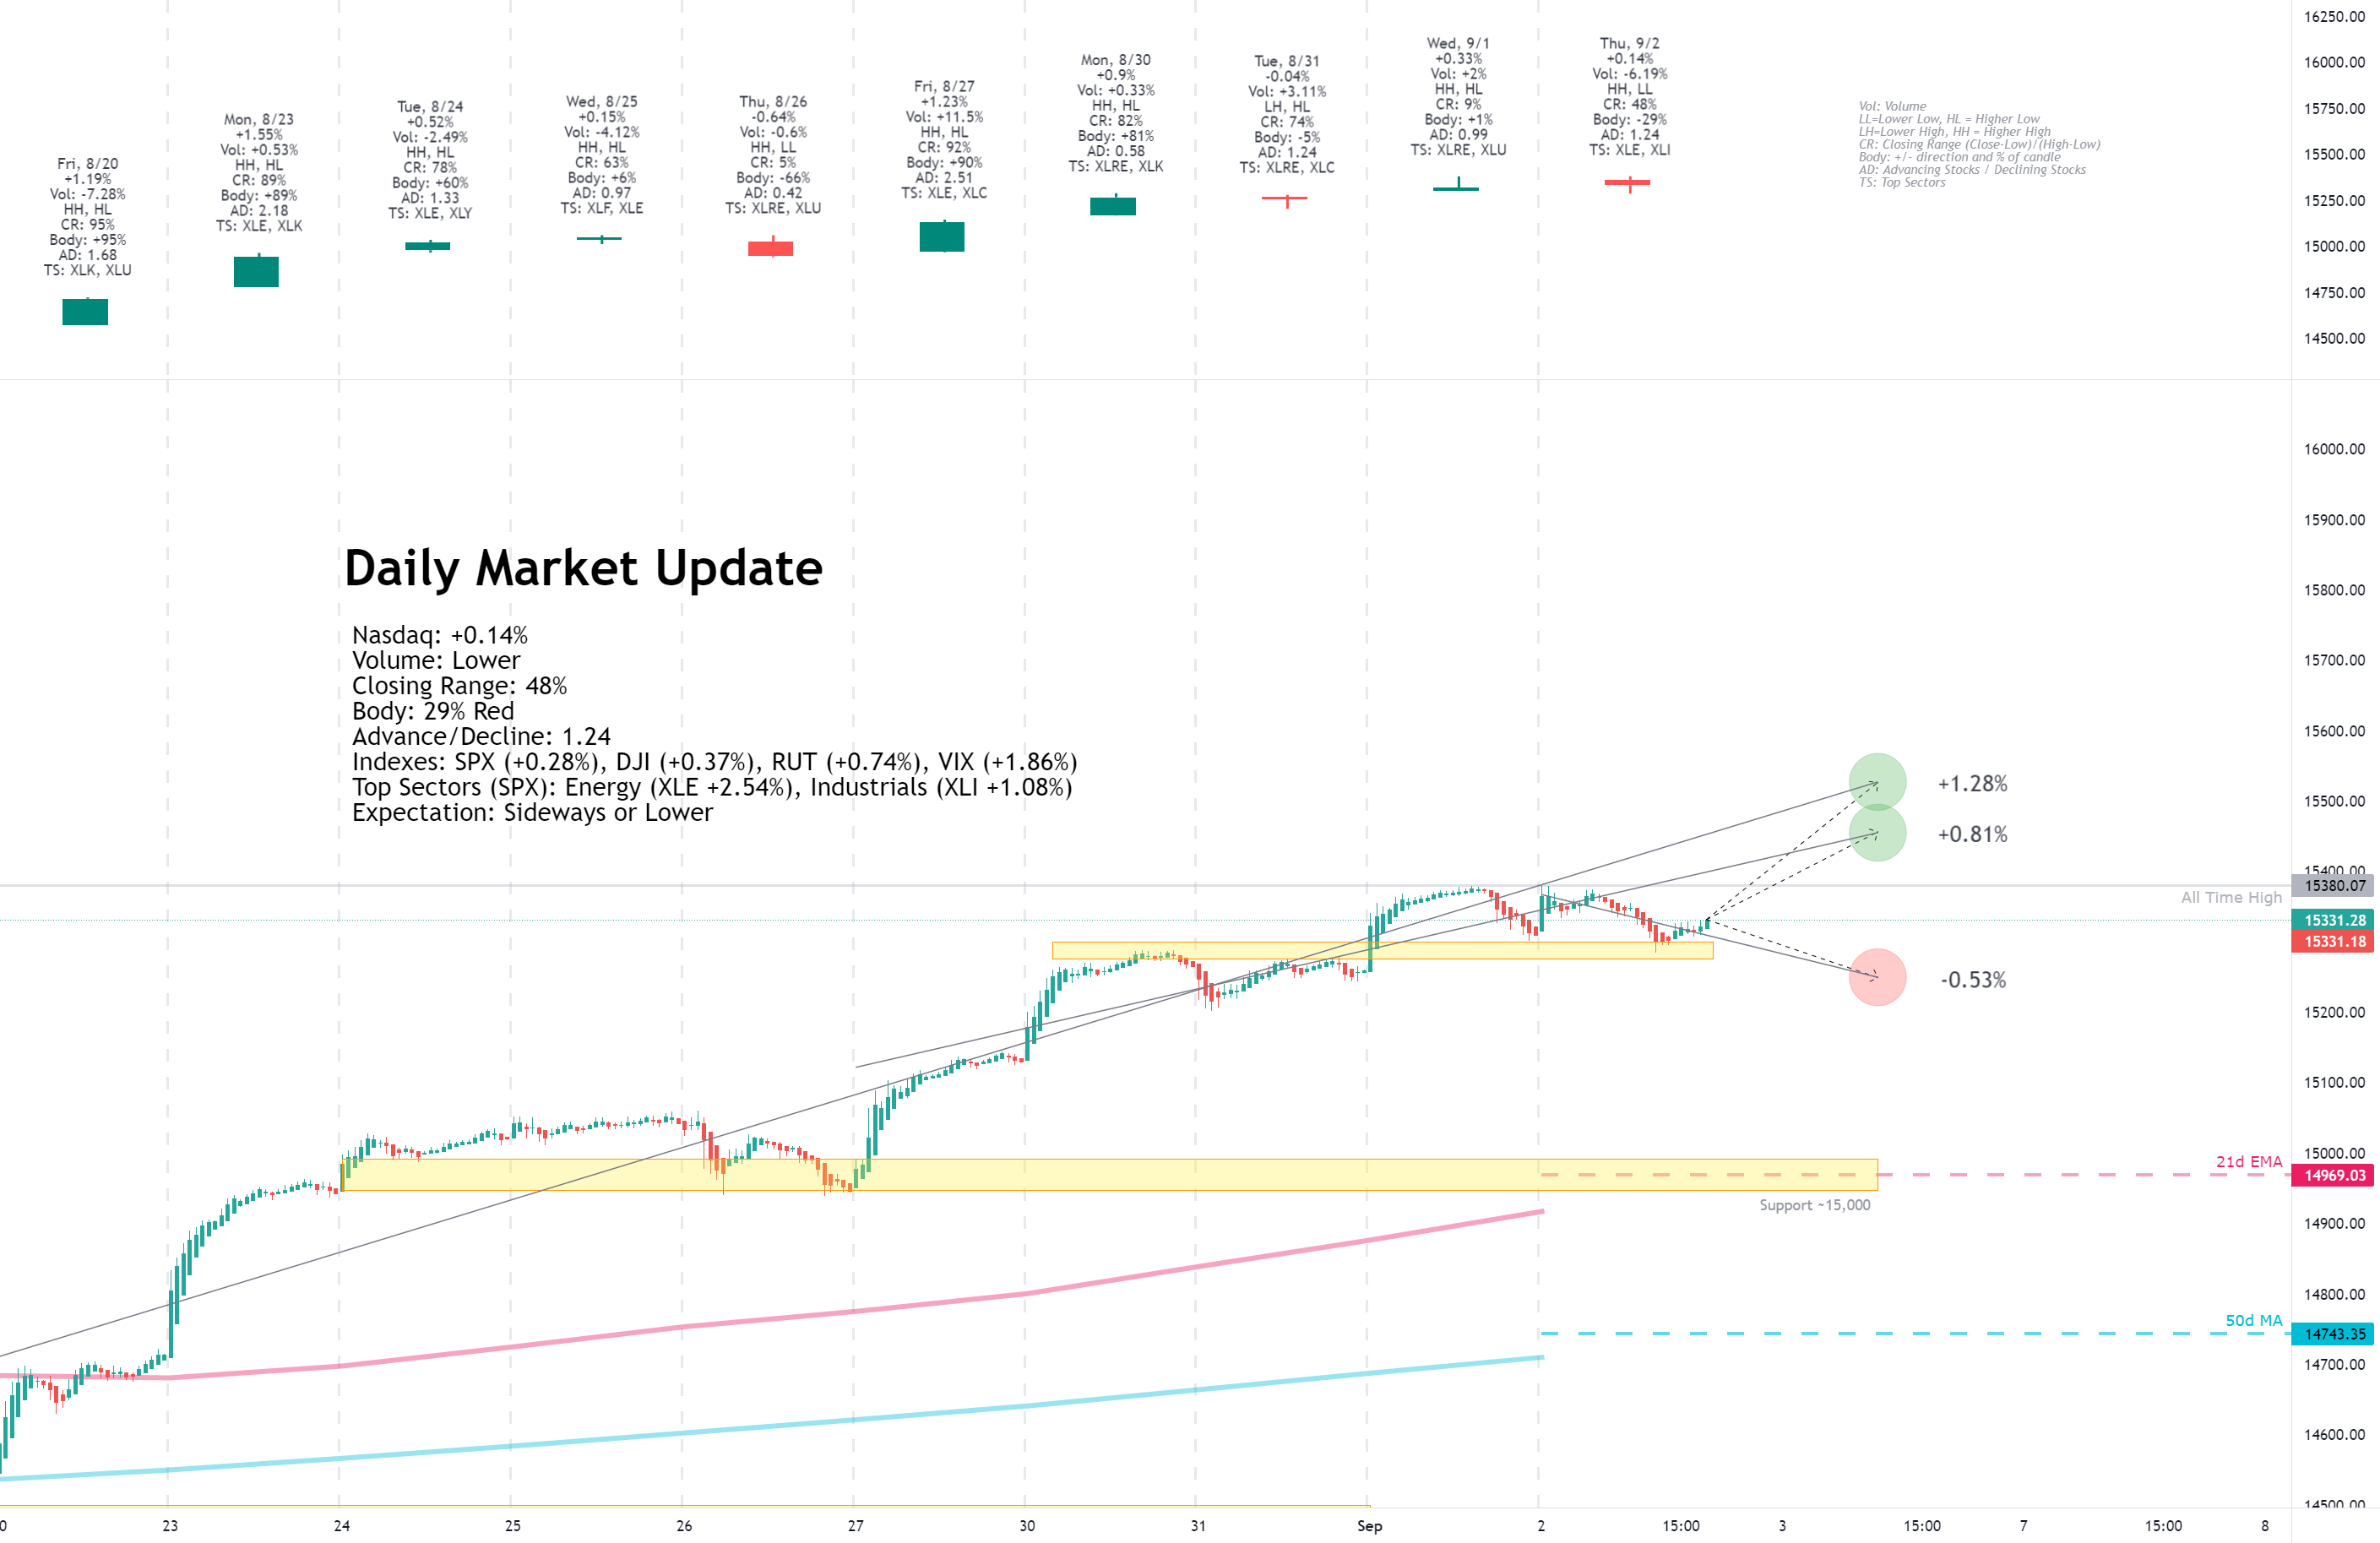
Thursday, September 02, 2021
Facts: +0.14%, Volume lower, Closing Range: 48%, Body: 29% Red
Good: Support forming at 15,300. Sideways move allowing moving averages to catch up.
Bad: Resistance near the weekly high
Highs/Lows: Higher high, Higher low
Candle: Outside day, red body above longer lower wick
Advance/Decline: 1.24, more advancing stocks than declining stocks
Indexes: SPX (+0.28%), DJI (+0.37%), RUT (+0.74%), VIX (+1.86%)
Sector List: Energy (XLE +2.54%) and Industrials (XLI +1.08%) at the top. Technology (XLK -0.11%) and Communications (XLC -0.67%) at the bottom.
Expectation: Sideways or Lower
Jobs data in the morning improved the economic outlook even while the pandemic remains relentless. Cyclical and defensive sectors outperformed while growth sectors declined for the day.
The Nasdaq gained +0.14% for the day. Volume was lower than the previous day. The 29% red body sits above a longer lower wick and below a shorter upper wick. The closing range of 48% is in the middle of an outside day where the high is higher, and the low is lower than the previous day. That’s two days of sideways trading near the all-time high for the index. There were more advancing stocks than declining stocks today.
-=x=-=x=-=x=-=x=-=x=-=x=-=x=-
Friday, September 03, 2021
Facts: +0.21%, Volume lower, Closing Range: 87%, Body: 55% Green
Good: Progress all day after a dip at open
Bad: Lower volume gain with low A/D ratio
Highs/Lows: Lower high, Lower low
Candle: Mostly green body in the middle of candle, longer lower wick
Advance/Decline: 0.47, two declining stocks for every advancing stock
Indexes: SPX (-0.03%), DJI (-0.21%), RUT (-0.52%), VIX (+0.00%)
Sector List: Technology (XLK +0.40%) and Health (XLV +0.11%) at the top. Materials (XLB -0.66%) and Utilities (XLU -0.83%) at the bottom.
Expectation:
Investors rushed to safety in big tech today after payroll growth data came in much lower than expected. The result was losses across most sectors and indexes, but enough gains in tech mega-caps for the Nasdaq to end the day higher.
The Nasdaq closed the day with a +0.21% gain. Volume was lower than the previous day. The closing range of 87% came after a volatile morning which turned into a steady climb to close near the intraday high. The lower wick is longer than the upper wick, and the green body covers 55% of the candle. There were two declining stocks for every advancing stock.
-=x=-=x=-=x=-=x=-=x=-=x=-=x=-
View on the Week
Employment data kept investors guessing about the Fed's timeline for bond tapering. However, that did not keep the Nasdaq and S&P 500 from hitting new all-time highs. Defensive sectors led the week, but growth sectors also closed the week with gains.
The week opened with momentum from the previous week's dovish speech by Jerome Powell at the Jackson Hole economic symposium. The speech indicated bond tapering could start this year, but the Fed would hold off on interest rate hikes until further progress in the economic recovery. That turned all eyes toward the labor market as the Fed's primary concern.
So how is the labor market doing? The answer varies depending on the labor data indicator. ADP Nonfarm Employment change data was lower than expected on Wednesday. Continuing and Initial jobless claims data was better than expected on Thursday. Then Nonfarm payrolls data on Friday was surprisingly lower than expected. The data had investors guessing what impact that would have on Fed policy.
The result of the swings in expectations had investors rotating between big tech and defensive stocks on poor labor market data and small-caps and cyclicals on good labor market data. That was on display on Wednesday as big tech soared in the morning after the Nonfarm Employment change data indicated a delay to tapering but then fell back after the Fed's Bostic said tapering could start as early as October.
Many of the economic indicators are showing that supply issues are holding back growth. The payrolls data, for example, shows the number of jobs filled but does not show the number of job openings without employees. Other data show there are plenty of jobs, but not people to fill them. Walmart and Amazon both made announcements this week that they will be adding a total of 75,000 in the coming months.
Manufacturers reported significant supply issues. A key component of PMI data shows order backlogs at their highest point in the past 70 years. Aluminum futures were up over 3% to new all-time highs. Aluminum is an essential material in the manufacturing of products and packaging.
Pending Home Sales data released on Monday was much lower than expected. However, the shortage of contracts pending is not a sign of low demand but rather a sign of low supply. That has housing prices growing at their highest rate on record.
Real Estate stocks are benefitting the most from the data. The sector is undoubtedly getting a boost from the housing data. However, investors are also rotating into Real Estate as a hedge against inflation and as a sector that benefits from continuing low-interest rates.
Federal Unemployment Benefits that have been in place since March 2020 are scheduled to end this week. That may force the current dynamic in the economy to change quite a bit.
The Nasdaq advanced +1.55% for the week. Volume was lower than the previous week. The closing range is 93%. Like the previous week, the weekly candle has no lower wick and only a tiny upper wick.
The Russell 2000 (RUT) gained +0.65% this week. The S&P 500 (SPX) advanced +0.58%. The Dow Jones Industrial Average (DJI) fell -0.24% for the week.
The VIX volatility index ended the week flat.
-=x=-=x=-=x=-=x=-=x=-=x=-=x=-
Sectors
Defensive sectors led the sector list during a week where employment data kept investors guessing on the Fed's timeline for bond tapering.
Real Estate ( XLRE ) led the list throughout the week. The sector is benefiting from low interest rates while it also remains a good hedge against inflation. The Fed continues to put full employment ahead of inflation as the priority for interest rate hikes, so the sector will continue to perform if labor recovery slows.
Health Care ( XLV ) was the second-best sector, following by Consumer Staples ( XLP ) and Utilities ( XLU ).
The cyclical sectors ended the week lower, with Financials ( XLF ) and Energy ( XLE ) sitting at the bottom of the sector list. The slowing labor market and missed PMI numbers this week showed some weakness in the economy.
-=x=-=x=-=x=-=x=-=x=-=x=-=x=-
Economic Indicators
The US Dollar (DXY) declined -0.61% this week. The dollar continues to weaken as the Fed remains dovish toward interest rates and seems poised to continue economic support until the labor market recovers fully.
US Treasuries 30y and 10y yields rose for a second week while the 2y yield declined, widening the gap between long-term and short-term yields for another week.
Both High Yield (HYG) Corporate Bond prices rose this week while Investment Grade (LQD) Corporate Bond prices fell.
Silver and Gold continue to rise as the US Dollar declines. Timber and Aluminum prices are rising as growth in demand continues to outpace supply. However, Copper declined for the week.
Crude Oil Futures were up and down throughout the week but ended the week flat.
-=x=-=x=-=x=-=x=-=x=-=x=-=x=-
Investor Sentiment
The put/call ratio (PCCE) ended the week at 0.626. It's in the bullish range but not overly bullish compared to earlier in the week when it hit 0.505.
The CNN Fear & Greed Index moved back to Neutral after sliding into Greed mid-week.
The NAAIM money manager exposure index rose to 93.95 from 92.83 in the previous week.
-=x=-=x=-=x=-=x=-=x=-=x=-=x=-
Stocks of the Week
Amazon (AMZN) moved back above its 10w moving average line with a +3.83% gain. Apple (AAPL) had a similar advance of +3.84$. Microsoft gained +0.47% but faded from mid-week highs. Alphabet (GOOGL) declined -0.18% for the week but hit a new all-time high on Wednesday. All four are trading above the key moving average lines.
MongoDB (MDB) was the big earnings winner for the week, smashing expectations and closing the week with a +28.26% gain. Digital Turbine (APPS) also had a massive gain of +21.46% after the S&P decided to add the company to its mid-cap 400 index.
RobinHood (HOOD) declined -7.51% this week. The SEC discussed the possibility of blocking payment for order flow, a huge part of RobinHood's business model.
Chewy (CHWY) and Zoom Video (ZM) disappointed investors with slowing growth. Chewy declined -12.89%, and Zoom Video declined -12.48% for the week.
-=x=-=x=-=x=-=x=-=x=-=x=-=x=-
Cryptocurrency
After moving sideways for a few weeks, Ethereum (ETHUSD) took off with a +22.49% gain this week. Ethereum got a boost from a general increase in cryptocurrencies but also an increase in demand for non-fungible tokens (NFT) that trade using the Ethereum network.
Bitcoin (BTCUSD) grew +6.12% this week. Litecoin (LTCUSD) gained +33.14%. Bitcoin Cash (BCHUSD) rose +16%.
-=x=-=x=-=x=-=x=-=x=-=x=-=x=-
The Week Ahead
Monday
Markets will be closed on Monday for the US Labor Day holiday.
Tuesday
There are some short-term Treasury auctions on Tuesday. Otherwise, there is not much economic news planned.
There are no notable earnings reports for the daily update on Tuesday.
Wednesday
The JOLTs Job Openings report is due on Wednesday. The information could contrast last week's employment data and show more openings than people willing to fill. With Federal Unemployment Benefits ending this week, supply in the labor market will pick up.
There is a 10-year note auction in the afternoon. Around the same time, the NY Fed's John Williams is scheduled to speak, and investors will be listening for any taper talk.
Lululemon (LULU), Coupa Software (COUP), GameStop (GME), and RH (RH) will report earnings on Wednesday.
Thursday
The weekly Initial and Continuing Jobless Claims report come on Thursday. Crude Oil Inventories will get an update after the market opens. The Fed's Mary Daly speaks in the morning, and John Williams speaks in the afternoon.
Zscaler (ZS) will report earnings.
Friday
We will get a forward-looking update on inflation with the Produce Price Index data in the morning.
Kroger (KR) and UP Fintech (TIGR) release earnings on Friday.
-=x=-=x=-=x=-=x=-=x=-=x=-=x=-
The Bullish Side
Despite pockets of the US still experiencing a high number of Delta variant cases, the economy continues to move forward. Many of the indicators that show otherwise are suffering from a shortage of supply to meet demand. US Households are ready to spend, still having one of the highest savings rates in recent history. Corporations benefit from low interest rates and cash reserves that they want to put to work for growth.
As the job market recovery slows, the Fed is likely to continue stimulus longer and leave interest rates untouched through 2022. That means companies will continue to benefit from cheap money. The US Dollar will continue to weaken, helping large multi-national corporations.
-=x=-=x=-=x=-=x=-=x=-=x=-=x=-
The Bearish Side
The end to Federal Unemployment Benefits happens at the end of this week. The impact on the economy isn't certain, but there are a few things that could happen. One possible outcome is a surge in supply for the labor market, allowing employment to catch up with job openings. That may be a good thing for the economy but may also cause the Fed to taper sooner and send bond investors into a taper tantrum.
There is considerable divergence in the typical market-timing indicators. While economic data show a slowing recovery, investor sentiment remains neutral to bullish. Indexes are setting new all-time highs each week, but the breadth of those gains is often limited to narrow segments such as big tech. The subcomponents of the CNN Fear & Greed index are at opposite ends of the spectrum. Junk bonds show Extreme Greed while stocks show Extreme Fear.
September is historically a bearish month. It won't take much for investors to get skittish and send indexes lower in the next few weeks.
-=x=-=x=-=x=-=x=-=x=-=x=-=x=-
Key Nasdaq Levels to Watch
The Nasdaq set another all-time high this week, closing the week at a record.
On the positive side, the levels are:
On the downside, there are a few key levels:
-=x=-=x=-=x=-=x=-=x=-=x=-=x=-
Wrap-up
Even as the Nasdaq and S&P 500 hit new all-time highs this week, there was uncertainty in the market. Defensive sectors outperformed the other sectors. Big tech and Junk Bonds advanced as some of the few options to find higher returns as the economy stumbles.
Expect investors to continue responding to any clues on Fed tapering, including economic indicators and language in the several Fed speeches scheduled for next week.
Good luck, stay healthy, and trade safe!
Notes
- The Market Week in Review is my weekend homework where I look over what happened in the previous week and what might come in the next week.
- I occasionally have some errors or typos and will correct them in my blog or the comments on TradingView. I do not have an editor and do this in my free time.
- If you find this helpful, please let me know in the comments. I am also more than happy to add new perspectives and data points if you have ideas.
The structure is the following:
- A recap of the daily updates that I do here on TradingView.
- View on the past week
- What's coming in the next week
- The Bullish View, The Bearish View
- Key index levels to watch out for
- Wrap-up
If you have been following my daily updates, you can skip down to "View on the Week." If not, then this first part is a great play-by-play recap for the week. Click the daily charts for more detail on sectors, indexes, and market leaders each day.
-=x=-=x=-=x=-=x=-=x=-=x=-=x=-
Monday, August 30, 2021
Facts: +0.90%, Volume lower, Closing Range: 85% (w/gap), Body: 81% Green
Good: Strong gain in morning, held near high in the afternoon
Bad: Lower volume, low A/D ratio
Highs/Lows: Higher high, Higher low
Candle: Gap-up at open, with tick green body and tiny upper wick. No lower wick.
Advance/Decline: 0.61, more than three declining stocks for every two advancing
Indexes: SPX (+0.43%), DJIA (-0.16%), RUT (-0.49%), VIX (-1.22%)
Sector List: Real Estate (XLRE +1.22%) and Technology (XLK +1.08%) at the top. Energy (XLE -1.18%) and Financials (XLF -1.41%) at the bottom.
Expectation: Sideways or Higher
Technology stocks rallied today after the Fed expressed a dovish stance toward tapering and interest rate hikes on Friday. Cyclical sectors faded while growth sectors dominated the top of the sector list.
The Nasdaq gained +0.90% for another record close. The closing range of 85% is just under a small upper wick, formed from a dip in the last hour of trading. The 81% Green body developed in the morning rally, with the index leveling off at a new all-time high and holding that level in the afternoon. Volume was lower than the previous day, and there were three declining stocks for every two advancing stocks.
-=x=-=x=-=x=-=x=-=x=-=x=-=x=-
Tuesday, August 31, 2021
Facts: -0.04%, Volume higher, Closing Range: 74%, Body: 5% Red
Good: Higher low continues uptrend, sideways move allows moving averages to catch up
Bad: Lower high, higher volume on decline, A/D ratio
Highs/Lows: Lower high, Higher low
Candle: Inside day with thin body at top of the candle
Advance/Decline: 0.81, more declining than advancing stocks
Indexes: SPX (-0.13%), DJI (-0.11%), RUT (+0.34%), VIX (+1.79%)
Sector List: Real Estate (XLRE +0.59%) and Communications (XLC +0.38%) at the top. Technology (XLK -0.53%) and Energy (XLE -0.68%) at the bottom.
Expectation: Sideways
Markets closed the month of August, moving sideways, but capped another bullish month of gains. The day started with investors swarming defensive sectors, but sentiment flipped, and the sector list scrambled.
The Nasdaq closed with a -0.04% decline on higher volume than the previous day. The inside day started with a dip at open but climbed back to set an intraday high before another more minor dip before the close. That created a thin red body above a longer lower wick, all within the high and low of the previous day. There were more declining stocks than advancing stocks.
-=x=-=x=-=x=-=x=-=x=-=x=-=x=-
Wednesday, September 01, 2021

Facts: +0.33%, Volume higher, Closing Range: 30% (w/gap), Body: 1% Green
Good: Gain on higher volume, higher high, higher low
Bad: Fade from new all-time high
Highs/Lows: Higher high, Higher low
Candle: Gap-up to long upper wick, almost no body, no lower wick
Advance/Decline: 0.99, one advancing for every declining stock
Indexes: SPX (+0.03%), DJI (-0.14%), RUT (+0.58%), VIX (-2.25%)
Sector List: Real Estate (XLRE +1.72%) and Utilities (XLU +1.31%) at the top. Financials (XLF -0.57%) and Energy (XLE -1.47%) at the bottom.
Expectation: Sideways or Lower
Markets rallied in the morning before investors turned defensive and the gains faded, weighed down by big tech stocks that all sold off in the later afternoon. Regardless, most of the market held onto some gain for the day.
The Nasdaq closed with a +0.33% gain but was up 0.80% midday. Volume was higher than the previous day. A gap-up at open turned into a morning rally, creating a long upper wick with no lower wick. However, the index faded in the afternoon, leaving a green body covering only 1% of the candle. There was an equal number of advancing and declining stocks for the day.
-=x=-=x=-=x=-=x=-=x=-=x=-=x=-
Thursday, September 02, 2021
Facts: +0.14%, Volume lower, Closing Range: 48%, Body: 29% Red
Good: Support forming at 15,300. Sideways move allowing moving averages to catch up.
Bad: Resistance near the weekly high
Highs/Lows: Higher high, Higher low
Candle: Outside day, red body above longer lower wick
Advance/Decline: 1.24, more advancing stocks than declining stocks
Indexes: SPX (+0.28%), DJI (+0.37%), RUT (+0.74%), VIX (+1.86%)
Sector List: Energy (XLE +2.54%) and Industrials (XLI +1.08%) at the top. Technology (XLK -0.11%) and Communications (XLC -0.67%) at the bottom.
Expectation: Sideways or Lower
Jobs data in the morning improved the economic outlook even while the pandemic remains relentless. Cyclical and defensive sectors outperformed while growth sectors declined for the day.
The Nasdaq gained +0.14% for the day. Volume was lower than the previous day. The 29% red body sits above a longer lower wick and below a shorter upper wick. The closing range of 48% is in the middle of an outside day where the high is higher, and the low is lower than the previous day. That’s two days of sideways trading near the all-time high for the index. There were more advancing stocks than declining stocks today.
-=x=-=x=-=x=-=x=-=x=-=x=-=x=-
Friday, September 03, 2021

Facts: +0.21%, Volume lower, Closing Range: 87%, Body: 55% Green
Good: Progress all day after a dip at open
Bad: Lower volume gain with low A/D ratio
Highs/Lows: Lower high, Lower low
Candle: Mostly green body in the middle of candle, longer lower wick
Advance/Decline: 0.47, two declining stocks for every advancing stock
Indexes: SPX (-0.03%), DJI (-0.21%), RUT (-0.52%), VIX (+0.00%)
Sector List: Technology (XLK +0.40%) and Health (XLV +0.11%) at the top. Materials (XLB -0.66%) and Utilities (XLU -0.83%) at the bottom.
Expectation:
Investors rushed to safety in big tech today after payroll growth data came in much lower than expected. The result was losses across most sectors and indexes, but enough gains in tech mega-caps for the Nasdaq to end the day higher.
The Nasdaq closed the day with a +0.21% gain. Volume was lower than the previous day. The closing range of 87% came after a volatile morning which turned into a steady climb to close near the intraday high. The lower wick is longer than the upper wick, and the green body covers 55% of the candle. There were two declining stocks for every advancing stock.
-=x=-=x=-=x=-=x=-=x=-=x=-=x=-
View on the Week
Employment data kept investors guessing about the Fed's timeline for bond tapering. However, that did not keep the Nasdaq and S&P 500 from hitting new all-time highs. Defensive sectors led the week, but growth sectors also closed the week with gains.
The week opened with momentum from the previous week's dovish speech by Jerome Powell at the Jackson Hole economic symposium. The speech indicated bond tapering could start this year, but the Fed would hold off on interest rate hikes until further progress in the economic recovery. That turned all eyes toward the labor market as the Fed's primary concern.
So how is the labor market doing? The answer varies depending on the labor data indicator. ADP Nonfarm Employment change data was lower than expected on Wednesday. Continuing and Initial jobless claims data was better than expected on Thursday. Then Nonfarm payrolls data on Friday was surprisingly lower than expected. The data had investors guessing what impact that would have on Fed policy.
The result of the swings in expectations had investors rotating between big tech and defensive stocks on poor labor market data and small-caps and cyclicals on good labor market data. That was on display on Wednesday as big tech soared in the morning after the Nonfarm Employment change data indicated a delay to tapering but then fell back after the Fed's Bostic said tapering could start as early as October.
Many of the economic indicators are showing that supply issues are holding back growth. The payrolls data, for example, shows the number of jobs filled but does not show the number of job openings without employees. Other data show there are plenty of jobs, but not people to fill them. Walmart and Amazon both made announcements this week that they will be adding a total of 75,000 in the coming months.
Manufacturers reported significant supply issues. A key component of PMI data shows order backlogs at their highest point in the past 70 years. Aluminum futures were up over 3% to new all-time highs. Aluminum is an essential material in the manufacturing of products and packaging.
Pending Home Sales data released on Monday was much lower than expected. However, the shortage of contracts pending is not a sign of low demand but rather a sign of low supply. That has housing prices growing at their highest rate on record.
Real Estate stocks are benefitting the most from the data. The sector is undoubtedly getting a boost from the housing data. However, investors are also rotating into Real Estate as a hedge against inflation and as a sector that benefits from continuing low-interest rates.
Federal Unemployment Benefits that have been in place since March 2020 are scheduled to end this week. That may force the current dynamic in the economy to change quite a bit.
The Nasdaq advanced +1.55% for the week. Volume was lower than the previous week. The closing range is 93%. Like the previous week, the weekly candle has no lower wick and only a tiny upper wick.
The Russell 2000 (RUT) gained +0.65% this week. The S&P 500 (SPX) advanced +0.58%. The Dow Jones Industrial Average (DJI) fell -0.24% for the week.
The VIX volatility index ended the week flat.
-=x=-=x=-=x=-=x=-=x=-=x=-=x=-
Sectors
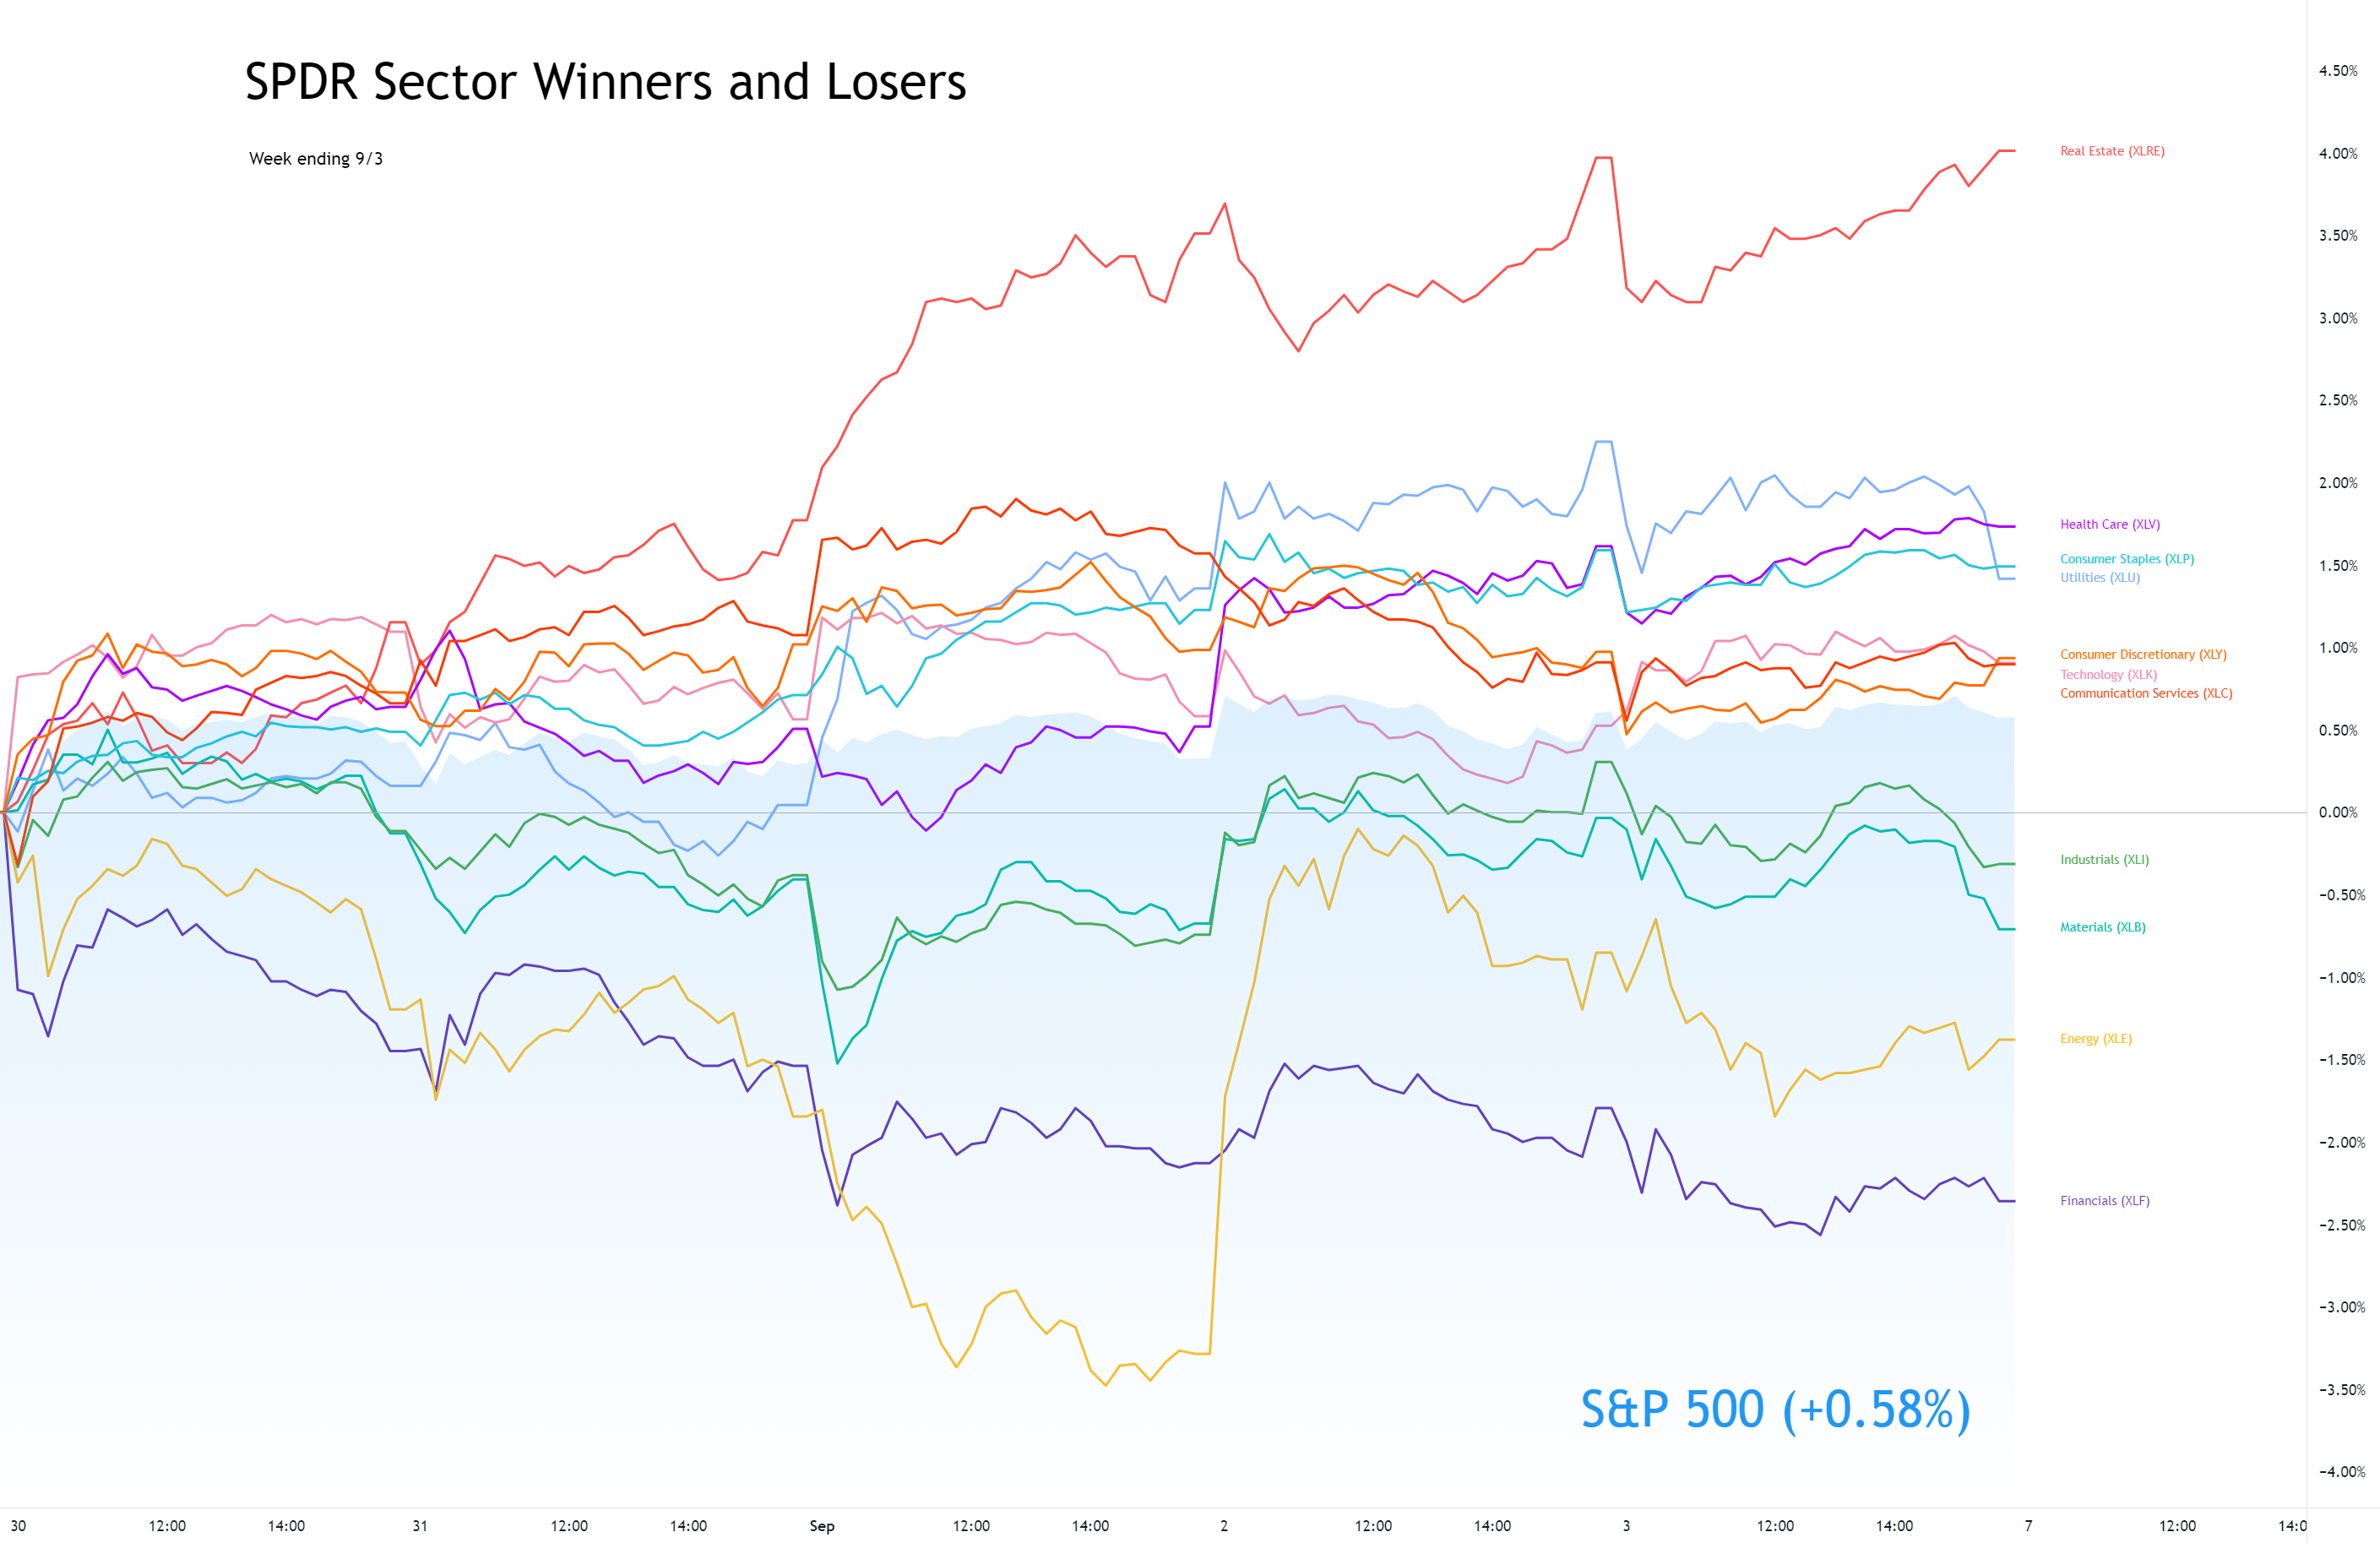
Defensive sectors led the sector list during a week where employment data kept investors guessing on the Fed's timeline for bond tapering.
Real Estate ( XLRE ) led the list throughout the week. The sector is benefiting from low interest rates while it also remains a good hedge against inflation. The Fed continues to put full employment ahead of inflation as the priority for interest rate hikes, so the sector will continue to perform if labor recovery slows.
Health Care ( XLV ) was the second-best sector, following by Consumer Staples ( XLP ) and Utilities ( XLU ).
The cyclical sectors ended the week lower, with Financials ( XLF ) and Energy ( XLE ) sitting at the bottom of the sector list. The slowing labor market and missed PMI numbers this week showed some weakness in the economy.
-=x=-=x=-=x=-=x=-=x=-=x=-=x=-
Economic Indicators
The US Dollar (DXY) declined -0.61% this week. The dollar continues to weaken as the Fed remains dovish toward interest rates and seems poised to continue economic support until the labor market recovers fully.
US Treasuries 30y and 10y yields rose for a second week while the 2y yield declined, widening the gap between long-term and short-term yields for another week.
Both High Yield (HYG) Corporate Bond prices rose this week while Investment Grade (LQD) Corporate Bond prices fell.
Silver and Gold continue to rise as the US Dollar declines. Timber and Aluminum prices are rising as growth in demand continues to outpace supply. However, Copper declined for the week.
Crude Oil Futures were up and down throughout the week but ended the week flat.
-=x=-=x=-=x=-=x=-=x=-=x=-=x=-
Investor Sentiment
The put/call ratio (PCCE) ended the week at 0.626. It's in the bullish range but not overly bullish compared to earlier in the week when it hit 0.505.
The CNN Fear & Greed Index moved back to Neutral after sliding into Greed mid-week.
The NAAIM money manager exposure index rose to 93.95 from 92.83 in the previous week.
-=x=-=x=-=x=-=x=-=x=-=x=-=x=-
Stocks of the Week
Amazon (AMZN) moved back above its 10w moving average line with a +3.83% gain. Apple (AAPL) had a similar advance of +3.84$. Microsoft gained +0.47% but faded from mid-week highs. Alphabet (GOOGL) declined -0.18% for the week but hit a new all-time high on Wednesday. All four are trading above the key moving average lines.
MongoDB (MDB) was the big earnings winner for the week, smashing expectations and closing the week with a +28.26% gain. Digital Turbine (APPS) also had a massive gain of +21.46% after the S&P decided to add the company to its mid-cap 400 index.
RobinHood (HOOD) declined -7.51% this week. The SEC discussed the possibility of blocking payment for order flow, a huge part of RobinHood's business model.
Chewy (CHWY) and Zoom Video (ZM) disappointed investors with slowing growth. Chewy declined -12.89%, and Zoom Video declined -12.48% for the week.
-=x=-=x=-=x=-=x=-=x=-=x=-=x=-
Cryptocurrency
After moving sideways for a few weeks, Ethereum (ETHUSD) took off with a +22.49% gain this week. Ethereum got a boost from a general increase in cryptocurrencies but also an increase in demand for non-fungible tokens (NFT) that trade using the Ethereum network.
Bitcoin (BTCUSD) grew +6.12% this week. Litecoin (LTCUSD) gained +33.14%. Bitcoin Cash (BCHUSD) rose +16%.
-=x=-=x=-=x=-=x=-=x=-=x=-=x=-
The Week Ahead
Monday
Markets will be closed on Monday for the US Labor Day holiday.
Tuesday
There are some short-term Treasury auctions on Tuesday. Otherwise, there is not much economic news planned.
There are no notable earnings reports for the daily update on Tuesday.
Wednesday
The JOLTs Job Openings report is due on Wednesday. The information could contrast last week's employment data and show more openings than people willing to fill. With Federal Unemployment Benefits ending this week, supply in the labor market will pick up.
There is a 10-year note auction in the afternoon. Around the same time, the NY Fed's John Williams is scheduled to speak, and investors will be listening for any taper talk.
Lululemon (LULU), Coupa Software (COUP), GameStop (GME), and RH (RH) will report earnings on Wednesday.
Thursday
The weekly Initial and Continuing Jobless Claims report come on Thursday. Crude Oil Inventories will get an update after the market opens. The Fed's Mary Daly speaks in the morning, and John Williams speaks in the afternoon.
Zscaler (ZS) will report earnings.
Friday
We will get a forward-looking update on inflation with the Produce Price Index data in the morning.
Kroger (KR) and UP Fintech (TIGR) release earnings on Friday.
-=x=-=x=-=x=-=x=-=x=-=x=-=x=-
The Bullish Side
Despite pockets of the US still experiencing a high number of Delta variant cases, the economy continues to move forward. Many of the indicators that show otherwise are suffering from a shortage of supply to meet demand. US Households are ready to spend, still having one of the highest savings rates in recent history. Corporations benefit from low interest rates and cash reserves that they want to put to work for growth.
As the job market recovery slows, the Fed is likely to continue stimulus longer and leave interest rates untouched through 2022. That means companies will continue to benefit from cheap money. The US Dollar will continue to weaken, helping large multi-national corporations.
-=x=-=x=-=x=-=x=-=x=-=x=-=x=-
The Bearish Side
The end to Federal Unemployment Benefits happens at the end of this week. The impact on the economy isn't certain, but there are a few things that could happen. One possible outcome is a surge in supply for the labor market, allowing employment to catch up with job openings. That may be a good thing for the economy but may also cause the Fed to taper sooner and send bond investors into a taper tantrum.
There is considerable divergence in the typical market-timing indicators. While economic data show a slowing recovery, investor sentiment remains neutral to bullish. Indexes are setting new all-time highs each week, but the breadth of those gains is often limited to narrow segments such as big tech. The subcomponents of the CNN Fear & Greed index are at opposite ends of the spectrum. Junk bonds show Extreme Greed while stocks show Extreme Fear.
September is historically a bearish month. It won't take much for investors to get skittish and send indexes lower in the next few weeks.
-=x=-=x=-=x=-=x=-=x=-=x=-=x=-
Key Nasdaq Levels to Watch
The Nasdaq set another all-time high this week, closing the week at a record.
On the positive side, the levels are:
- The new all-time high was set on Thursday and is 15,380.07.
- The index hit resistance at around 15,380 for the last three days.
- 15,500 may be the next area of resistance.
On the downside, there are a few key levels:
- The 10d moving average is at 15,160.88.
- The 21d EMA is at 15,004.89.
- 15,000 is an area of support.
- The 50d MA is at 14,763.22.
- 14,423.16 is the low of the most recent pullback.
- 14,200 remains a critical level if the index moves downward.
- 14,000 has been an area of support/resistance.
- There is a pivot at 13,903.73.
- A further pullback would likely hit the 200d moving average at 13,703.78. The index hasn't approached this line since rising above it in April 2020.
-=x=-=x=-=x=-=x=-=x=-=x=-=x=-
Wrap-up
Even as the Nasdaq and S&P 500 hit new all-time highs this week, there was uncertainty in the market. Defensive sectors outperformed the other sectors. Big tech and Junk Bonds advanced as some of the few options to find higher returns as the economy stumbles.
Expect investors to continue responding to any clues on Fed tapering, including economic indicators and language in the several Fed speeches scheduled for next week.
Good luck, stay healthy, and trade safe!