Summary: This week investors wrestled with worries over a slowing economic recovery and the timing of the Fed's bond tapering this fall. The short week opened with the Nasdaq reaching a new all-time high, but prices faded from that point through the end of the week. Glitches in cryptocurrency platforms sent Bitcoin and Ethereum lower, while NFTs sent Litecoin higher.
Notes
The structure is the following:
If you have been following my daily updates, you can skip down to "View on the Week." If not, then this first part is a great play-by-play recap for the week. Click the daily charts for more detail on sectors, indexes, and market leaders each day.
-=x=-=x=-=x=-=x=-=x=-=x=-=x=-
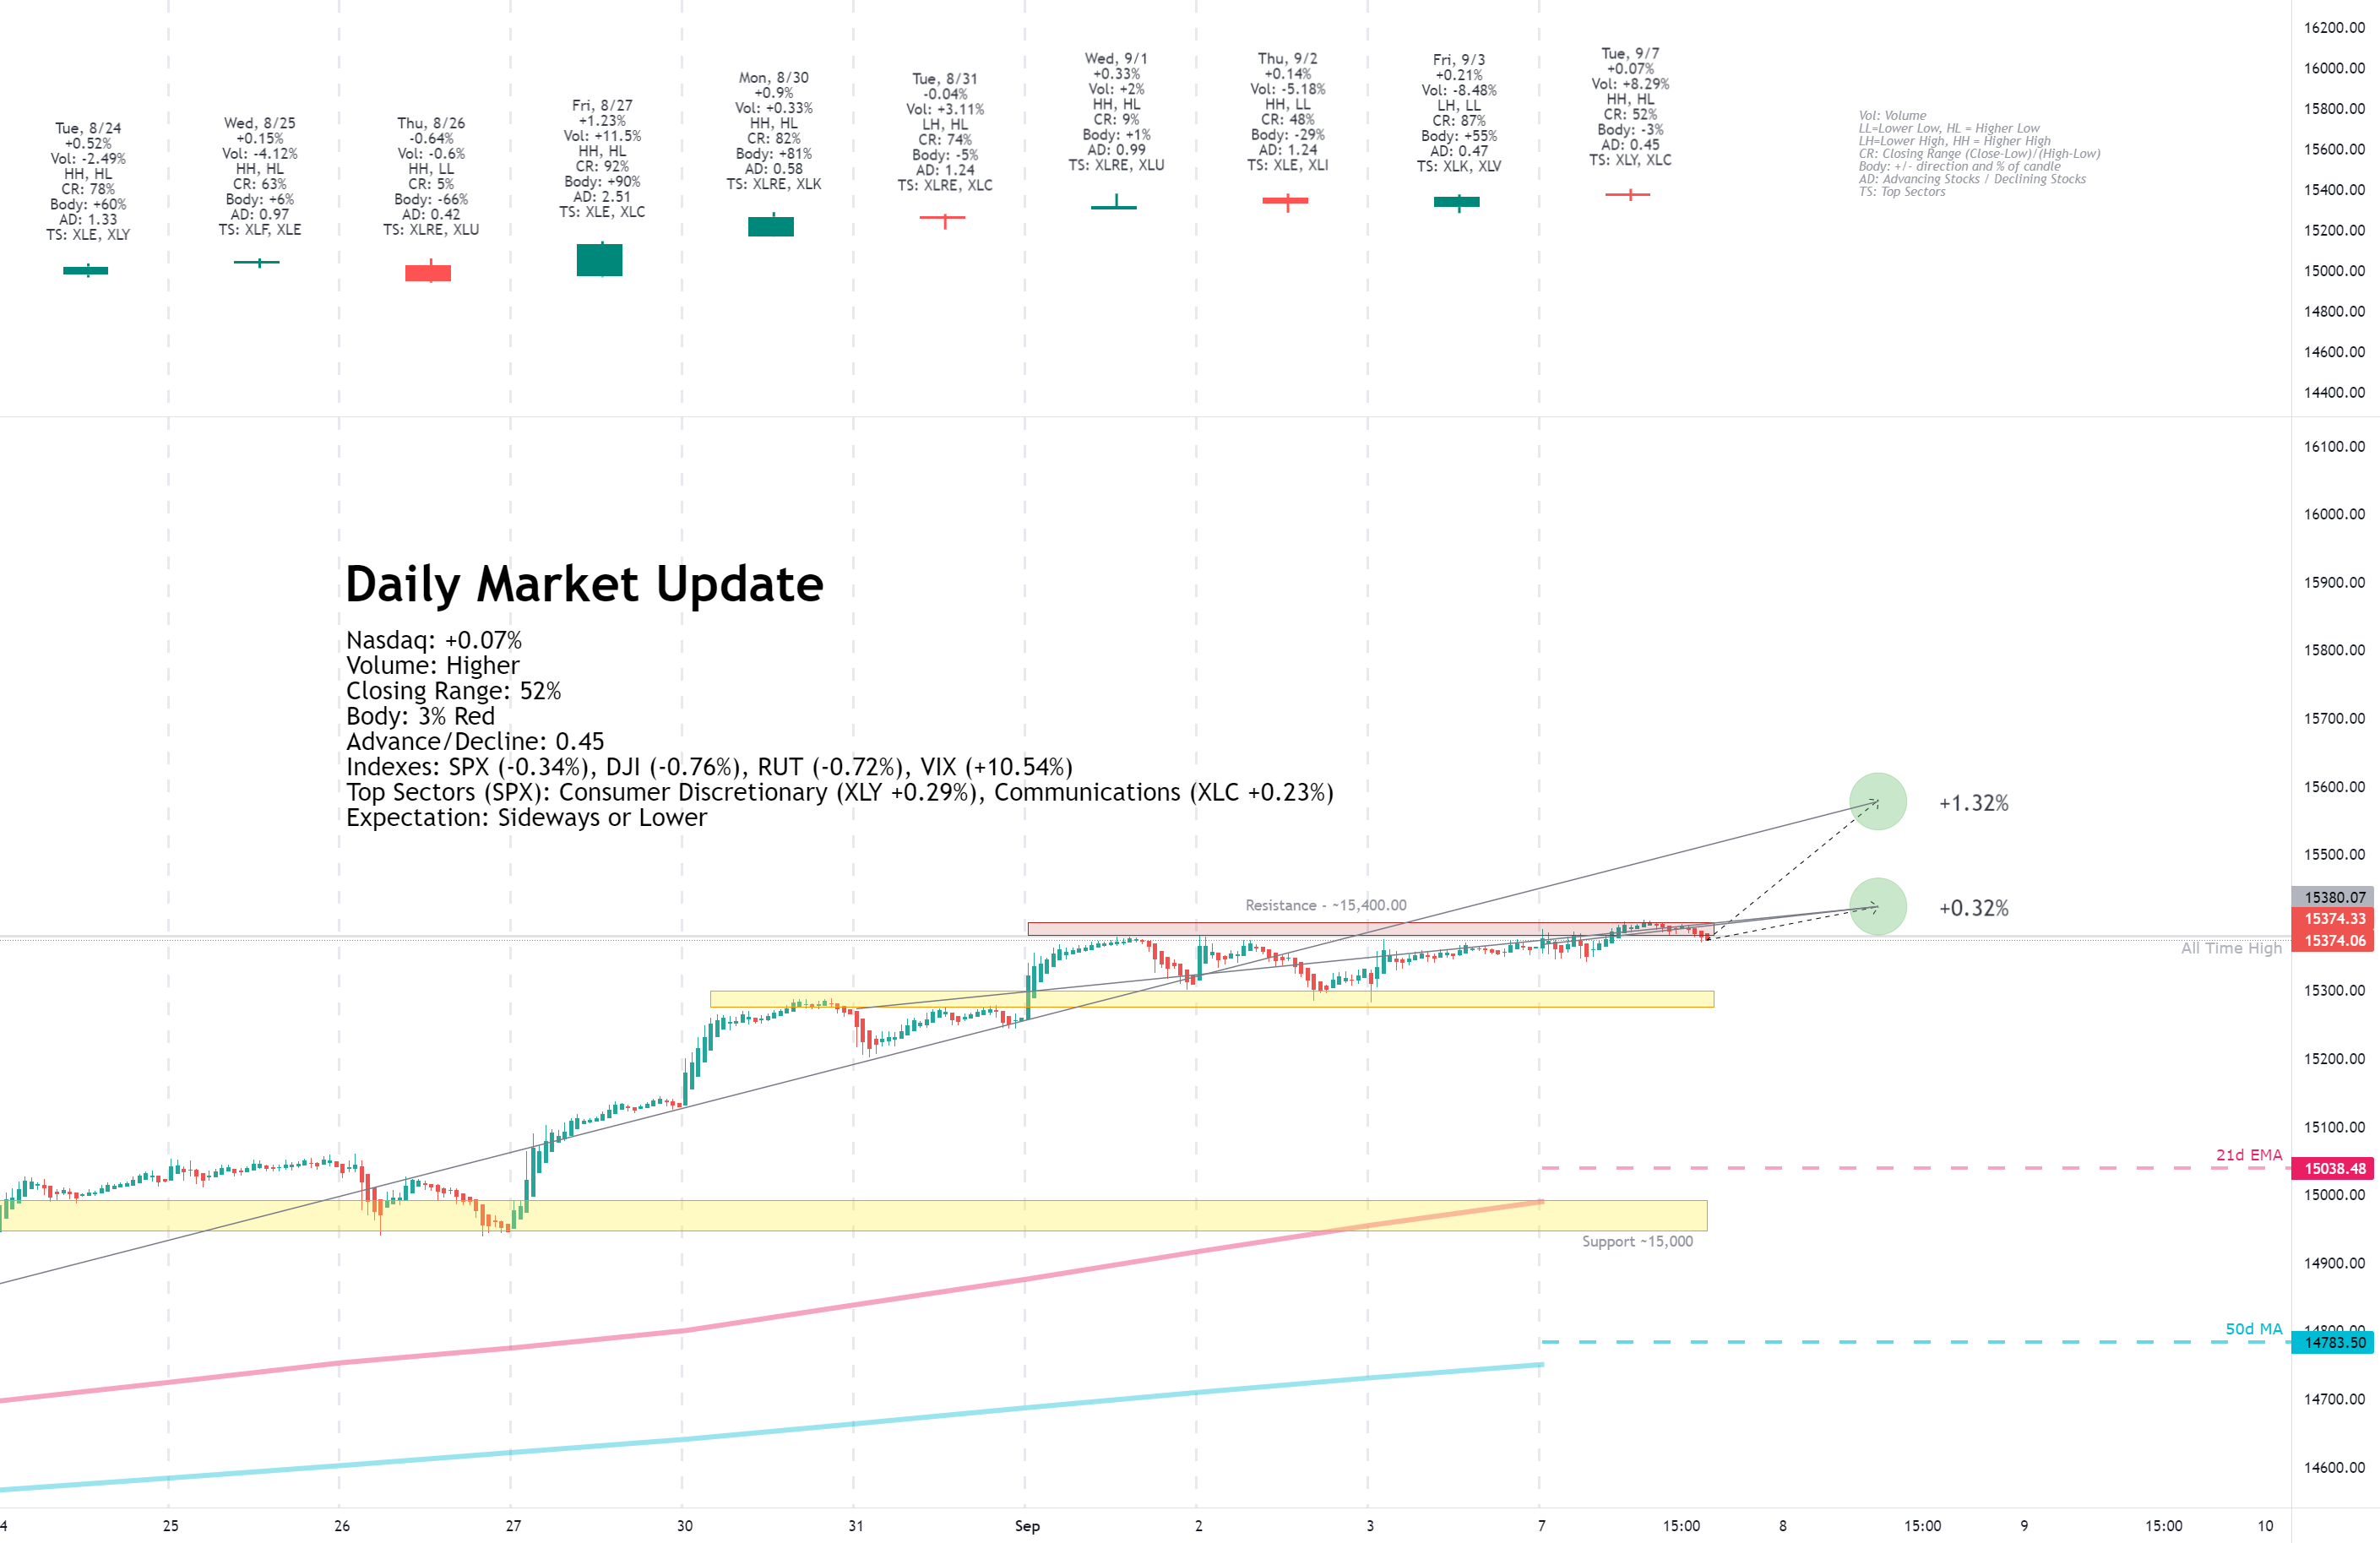
Tuesday, September 07, 2021

Facts: +0.07%, Volume lower, Closing Range: 52%, Body: 3% Red
Good: Higher high, higher low on increased volume
Bad: Low A/D ratio, thin red body in middle of candle signals indecision
Highs/Lows: Higher high, Higher low
Candle: Indecisive doji style candle shows buyers and sellers in market
Advance/Decline: 0.45, two declining stocks for every advancing stock
Indexes: SPX (-0.34%), DJI (-0.76%), RUT (-0.72%), VIX (+10.54%)
Sector List: Consumer Discretionary (XLY +0.29%) and Communications (XLC +0.23%) at the top. Utilities (XLU -1.32%) and Industrials (XLI -1.73%) at the bottom.
Expectation: Sideways or Lower
Markets closed the day with mixed results as investors worried about a slowing economy and uncertainty around when the Fed would start bond tapering. Big Tech were viewed as safe bets, helping keep the growth sectors and the Nasdaq in the positive for the day.
The Nasdaq ended the day with a +0.07% gain, setting a new all-time and another record close. The 3% red body rests in the middle of the candle, representing the indecision for buyers and sellers during the day. The closing range of 52% is ok. The fight between bulls and bears created a higher volume day than the previous day. There were over two declining stocks for every advancing stock.
-=x=-=x=-=x=-=x=-=x=-=x=-=x=-
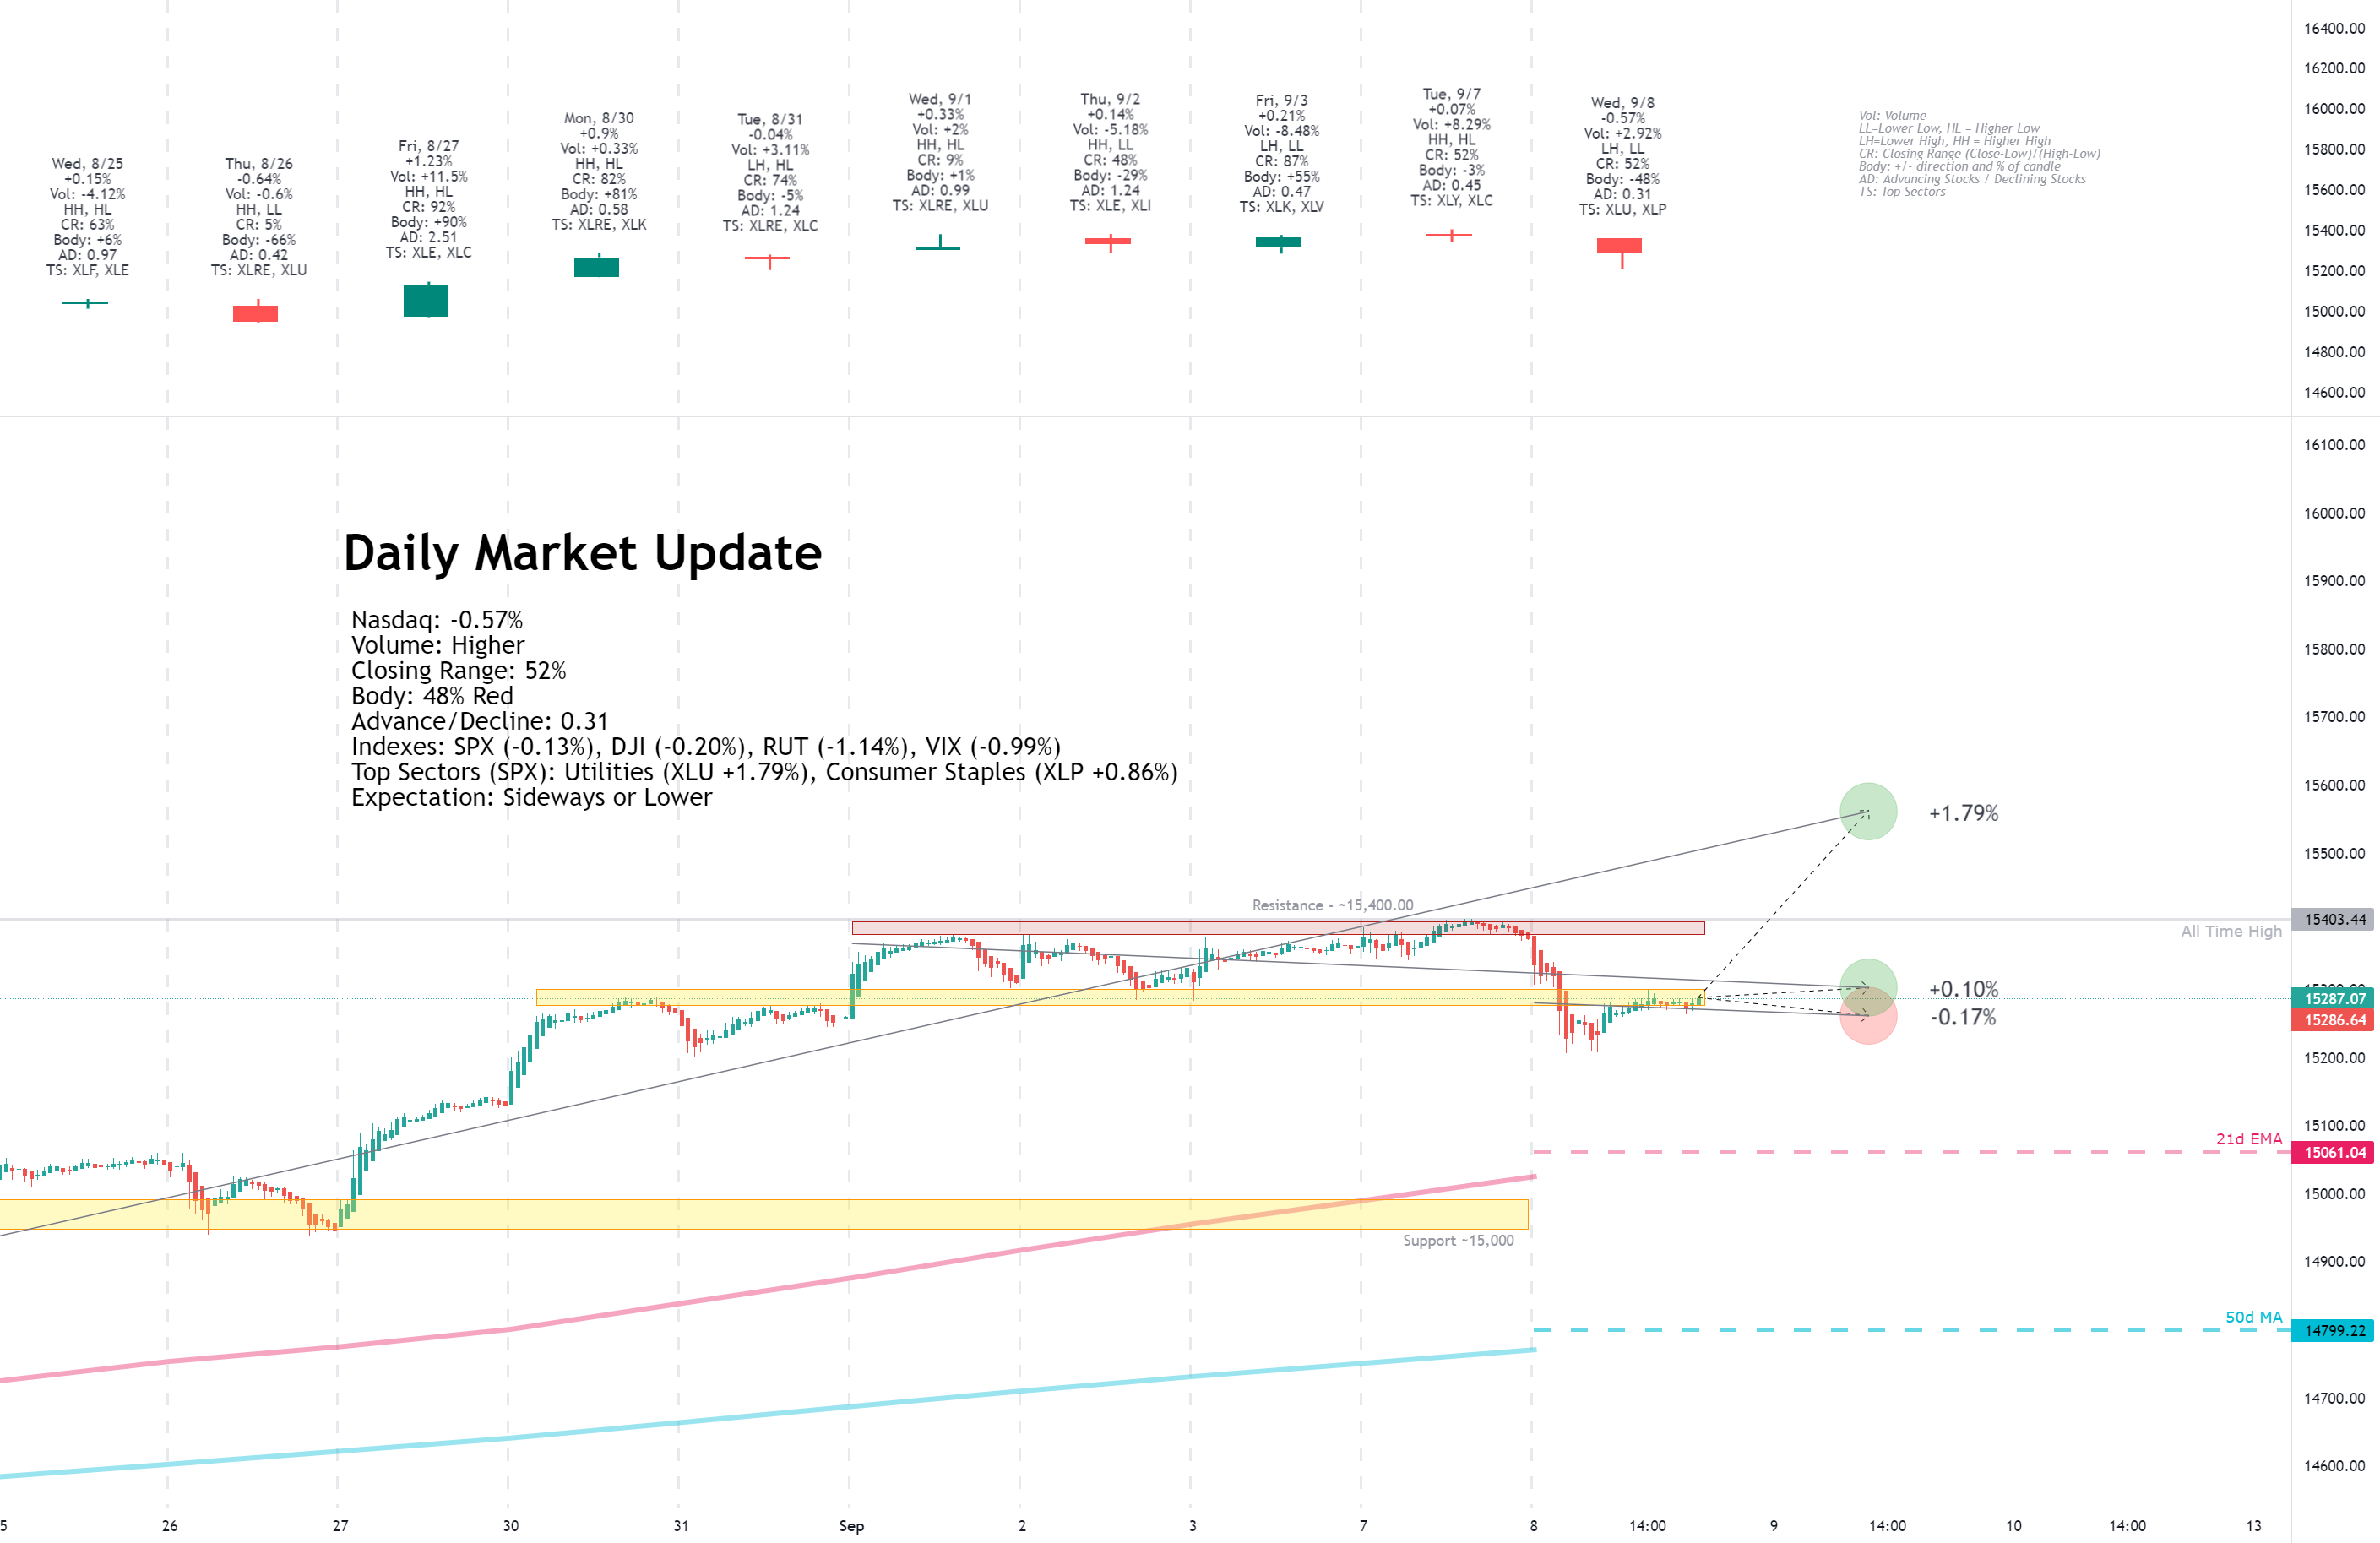
Wednesday, September 08, 2021
Facts: -0.57%, Volume higher, Closing Range: 52%, Body: 48% Red
Good: Climb back to 52% closing range after morning selling
Bad: Red body, lower high and close on higher volume
Highs/Lows: Lower high, Lower low
Candle: No upper wick, half red body and half lower wick
Advance/Decline: 0.31, more than three declining
Indexes: SPX (-0.13%), DJI (-0.20%), RUT (-1.14%), VIX (-0.99%)
Sector List: Utilities (XLU +1.79%) and Consumer Staples (XLP +0.86%) at the top. Materials (XLB -0.96%) and Energy (XLE -1.28%) at the bottom.
Expectation: Sideways or Lower
Investors were cautious on Wednesday, sending indexes lower over fears of a slowing economy. Defensive sectors led the day.
The Nasdaq closed with a -0.57% loss for the day. Volume was higher than the previous day. The closing range of 52% comes below a 48% red body that occupies the upper half of the candle. There is a long lower wick and no upper wick. More than three stocks declined for every advancing stock.
-=x=-=x=-=x=-=x=-=x=-=x=-=x=-
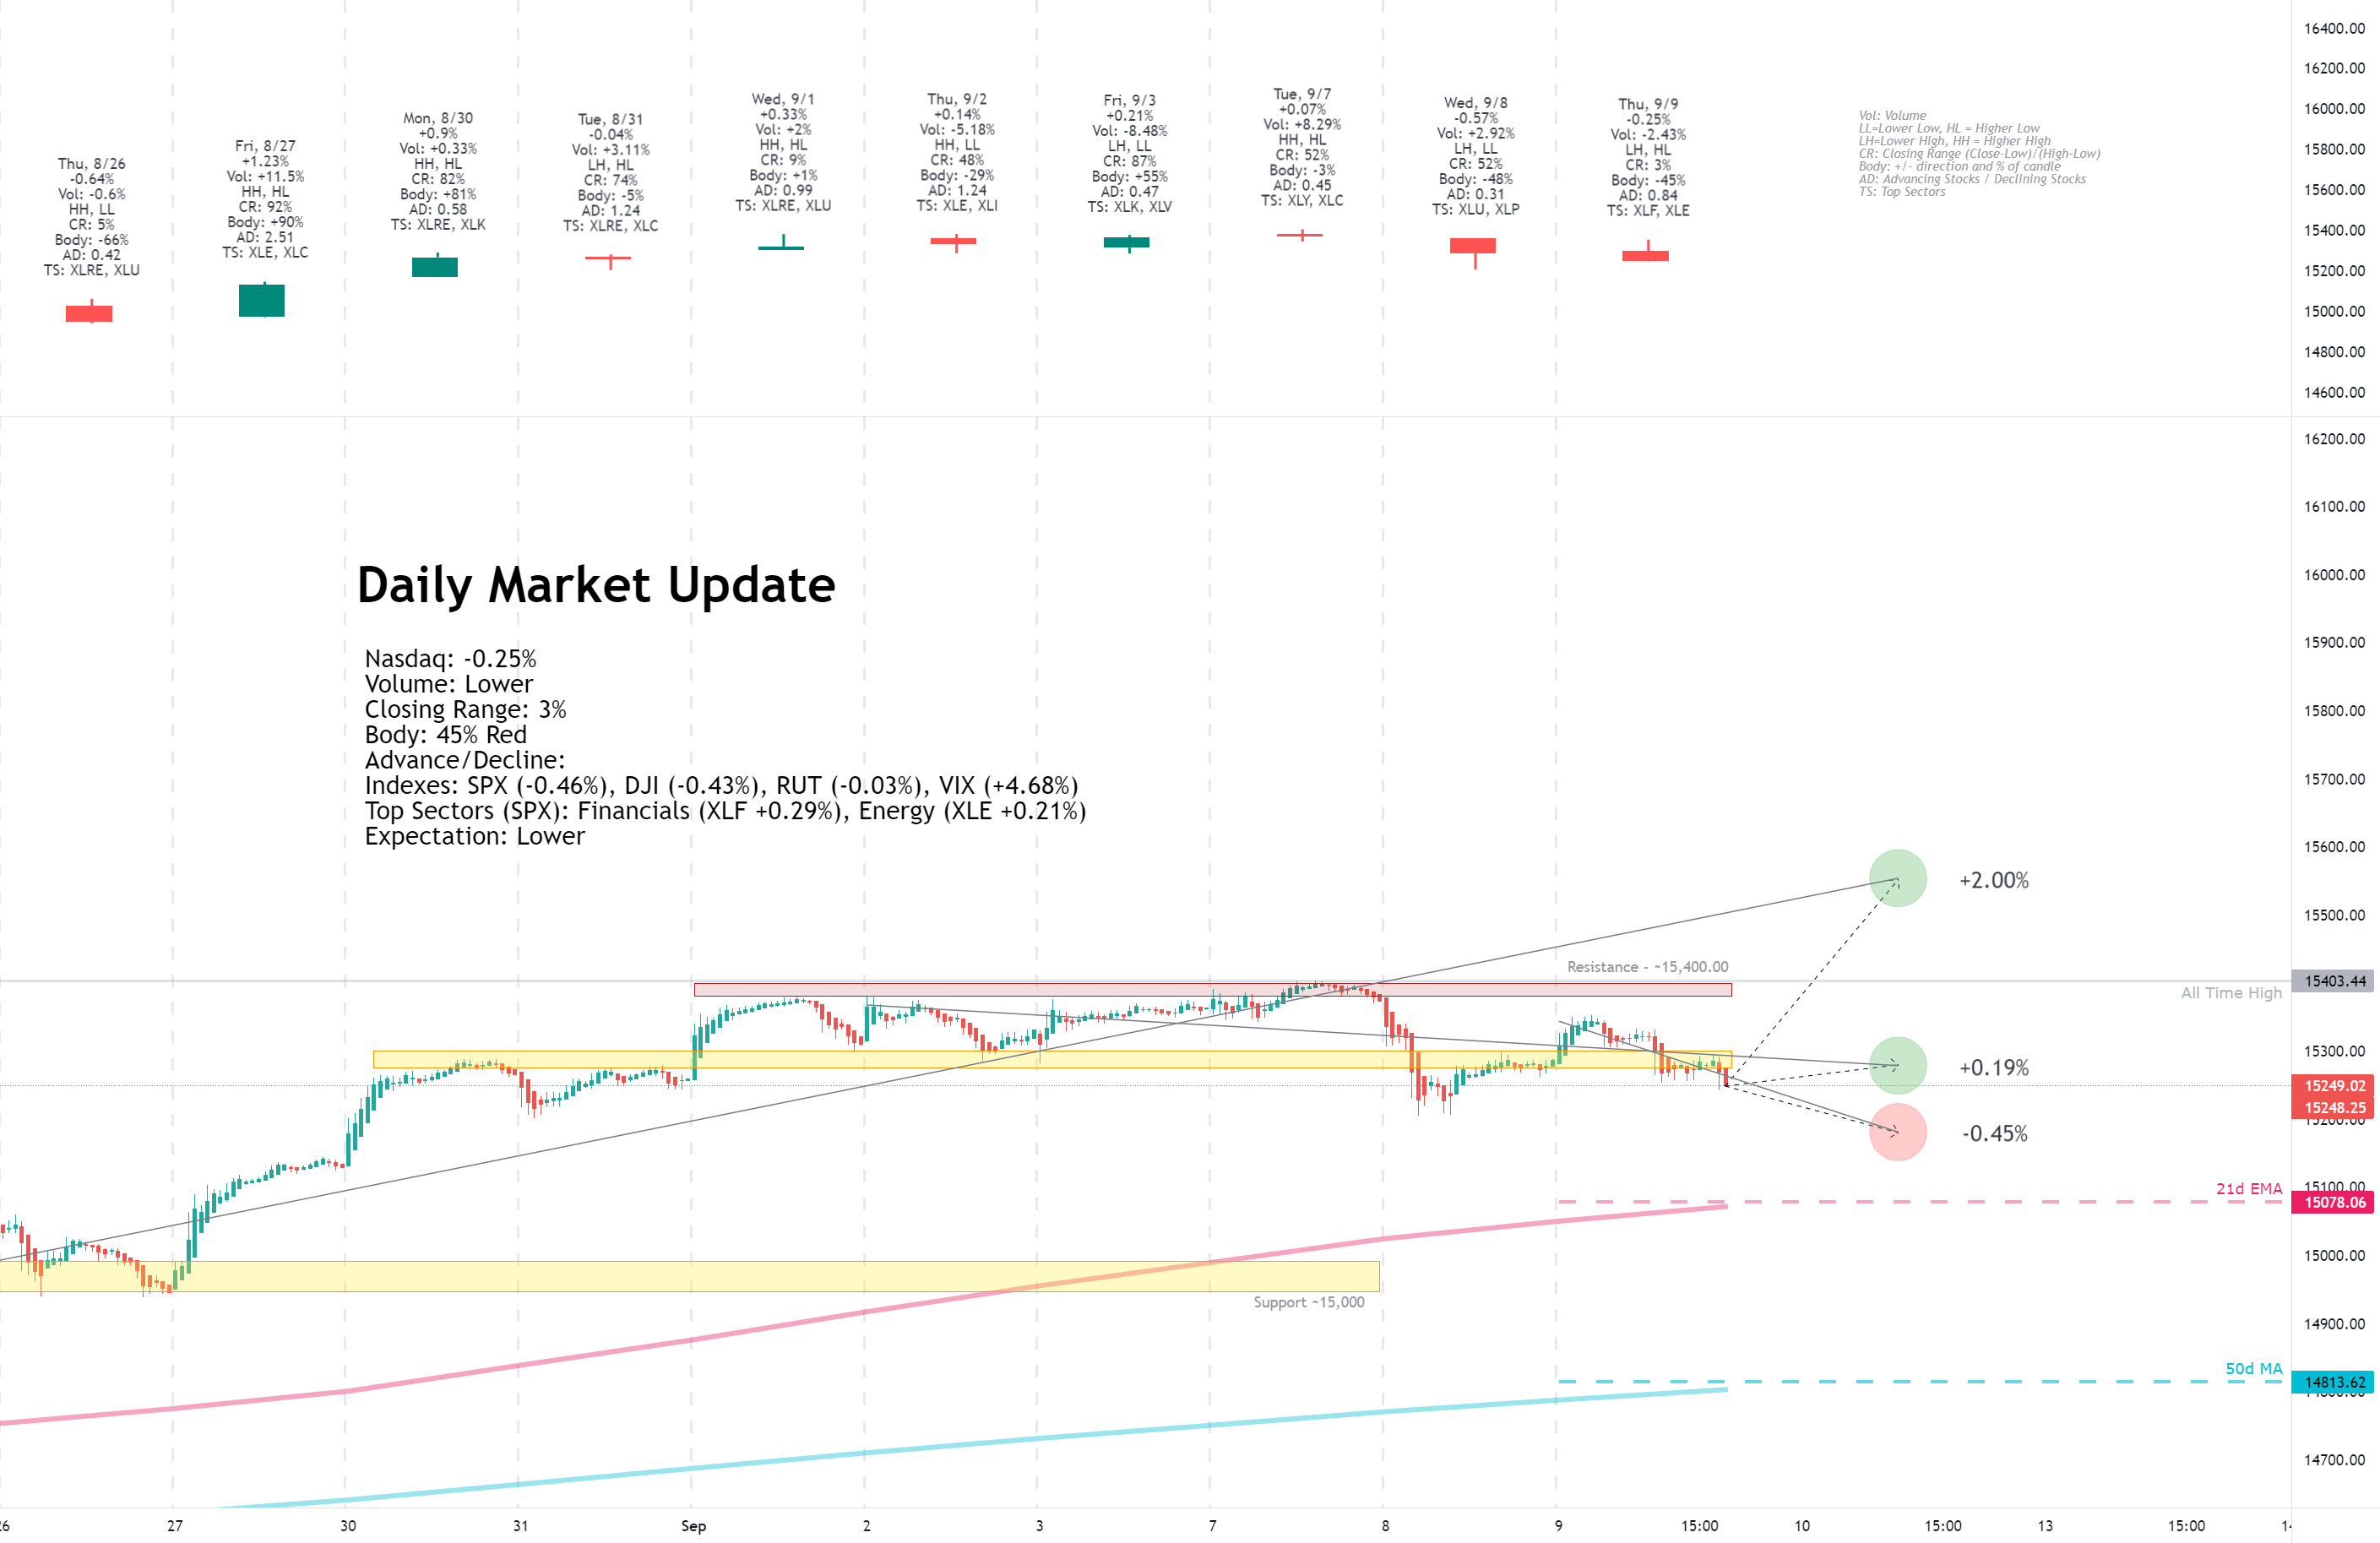
Thursday, September 09, 2021
Facts: -0.25%, Volume lower, Closing Range: 3%, Body: 45% Red
Good: Closed above yesterday's low
Bad: Long upper wick formed after a failed morning rally
Highs/Lows: Lower high, Higher low
Candle: Inside day, long upper wick with very low closing range
Advance/Decline: 0.83, more declining stocks than advancing stocks
Indexes: SPX (-0.46%), DJI (-0.43%), RUT (-0.03%), VIX (+4.68%)
Sector List: Financials (XLF +0.29%) and Energy (XLE +0.21%) at the top. Health (XLV -1.15%) and Real Estate (XLRE -2.12%) at the bottom.
Expectation: Lower
Indexes declined today after a volatile day for bonds. Yields were rising in the early morning before a robust 30y Bond auction sent yields lower. Jobless claims data released in the morning hit another pandemic low, boosting the economic outlook but raising expectations for the Fed to start tapering bond repurchasing.
The Nasdaq closed with a -0.25% gain for the day. The index could not hold onto a morning rally that formed a long upper wick. The index faded after the rally to end the day with a 3% closing range and 45% red body. Volume was lower than the previous day, and the trading range was within the high and low of Wednesday. There were more declining stocks than advancing stocks.
-=x=-=x=-=x=-=x=-=x=-=x=-=x=-
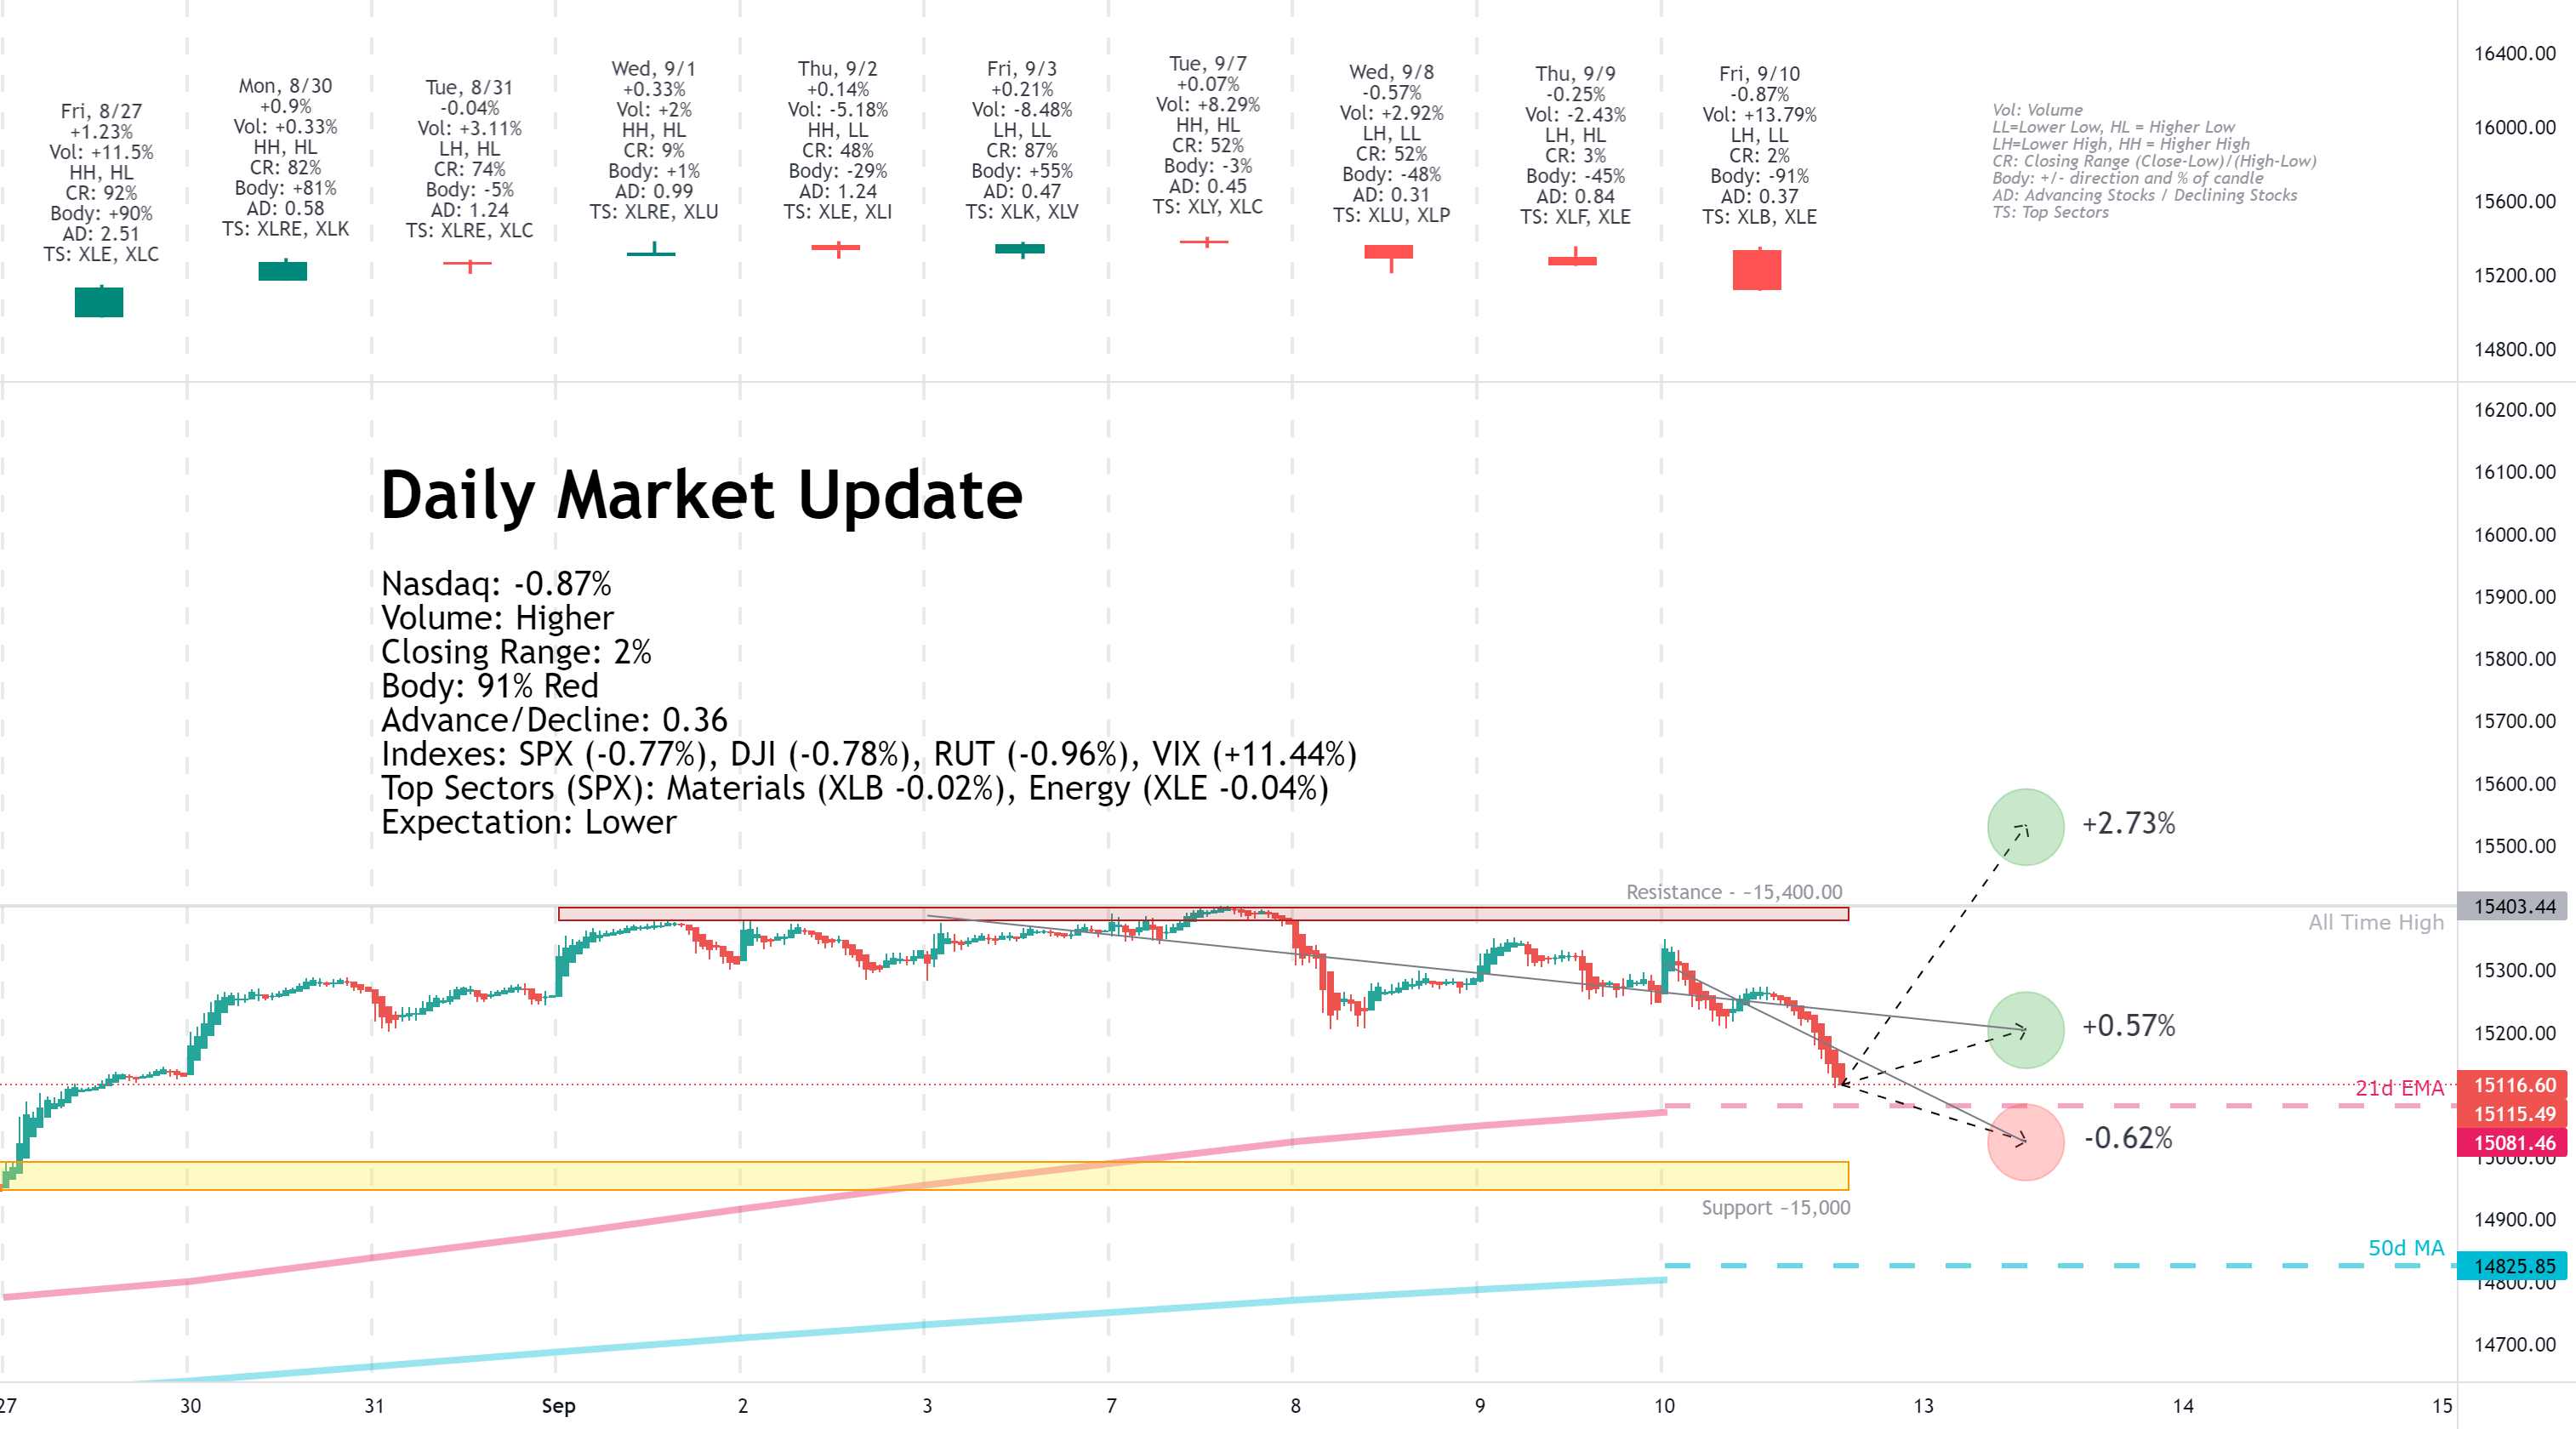
Friday, September 10, 2021
Facts: -0.87%, Volume higher, Closing Range: 2%, Body: 91% Red
Good: Stayed above 21d EMA, but maybe just because the market closed
Bad: Failed support at 15,200, all red body candle
Highs/Lows: Lower high, Lower low
Candle: Tiny upper wick and no lower wick, all red body
Advance/Decline: 0.36, three declining stocks for every advancing stock
Indexes: SPX (-0.77%), DJI (-0.78%), RUT (-0.96%), VIX (+11.44%)
Sector List: Materials (XLB -0.02%) and Energy (XLE -0.04%) at the top. Real Estate (XLRE -1.26%) and Utilities (XLU -1.40%) at the bottom.
Expectation: Lower
Markets reacted on fears of a slowing economy while demand remains higher than supply in several parts of the economy, and indicators show continued inflation for producers. The day marks the fourth straight session of declines for equities.
The Nasdaq lost -0.87% for the day on a higher volume than average. The candle is 91% red body with a tiny upper wick and barely visible lower wick. The closing range was 2%. There were three declining stocks for every advancing stock.
-=x=-=x=-=x=-=x=-=x=-=x=-=x=-
View on the Week
This week investors wrestled with worries over a slowing economic recovery and the timing of the Fed's bond tapering this fall. The short week opened with the Nasdaq reaching a new all-time high, but prices faded from that point through the end of the week. Glitches in cryptocurrency platforms sent Bitcoin and Ethereum lower, while NFTs sent Litecoin higher.
The previous Friday's employment data provided a sour outlook for investors looking for more robust economic growth. That disappointing news came amidst continued concerns over the spread of the Delta variant of COVID, causing more headwinds for the service industry. The result was investors buying up big tech at the beginning of the week. Big tech has shown resilience to the impacts of the pandemic.
The economic data brings up another concern for investors. When will the Fed start to taper bond purchases? At first glance, one could imagine that the slowing growth in payrolls would push tapering out further.
On the contrary, statements from the Fed this week indicated that the economy had recovered enough that bond tapering could still proceed in the short term.
The result was quite a bit of volatility in Treasury bonds. Volatility in the bond market is going to lead to volatility in equities. Both increase risk for large institutional investors who are inevitably going to reduce or hedge positions. So we have a week of distribution days across all the major indexes, with the huge drops coming in mid-day reactions.
The sell-off on Friday afternoon capped the bearish week and was likely investors positioning against further volatility over the weekend.
The Nasdaq declined -1.62% for the week. Volume was higher than the previous week. The closing range is 2%, reflecting the selling on Friday afternoon that continued into the market close.
The Dow Jones Industrial Average (DJI) fell -2.15% for the week. The S&P 500 (SPX) declined -1.69%. The Russell 2000 (RUT) lost -2.81% this week.
The VIX volatility index ended the week up +27.68% over the previous week.
-=x=-=x=-=x=-=x=-=x=-=x=-=x=-
Sectors
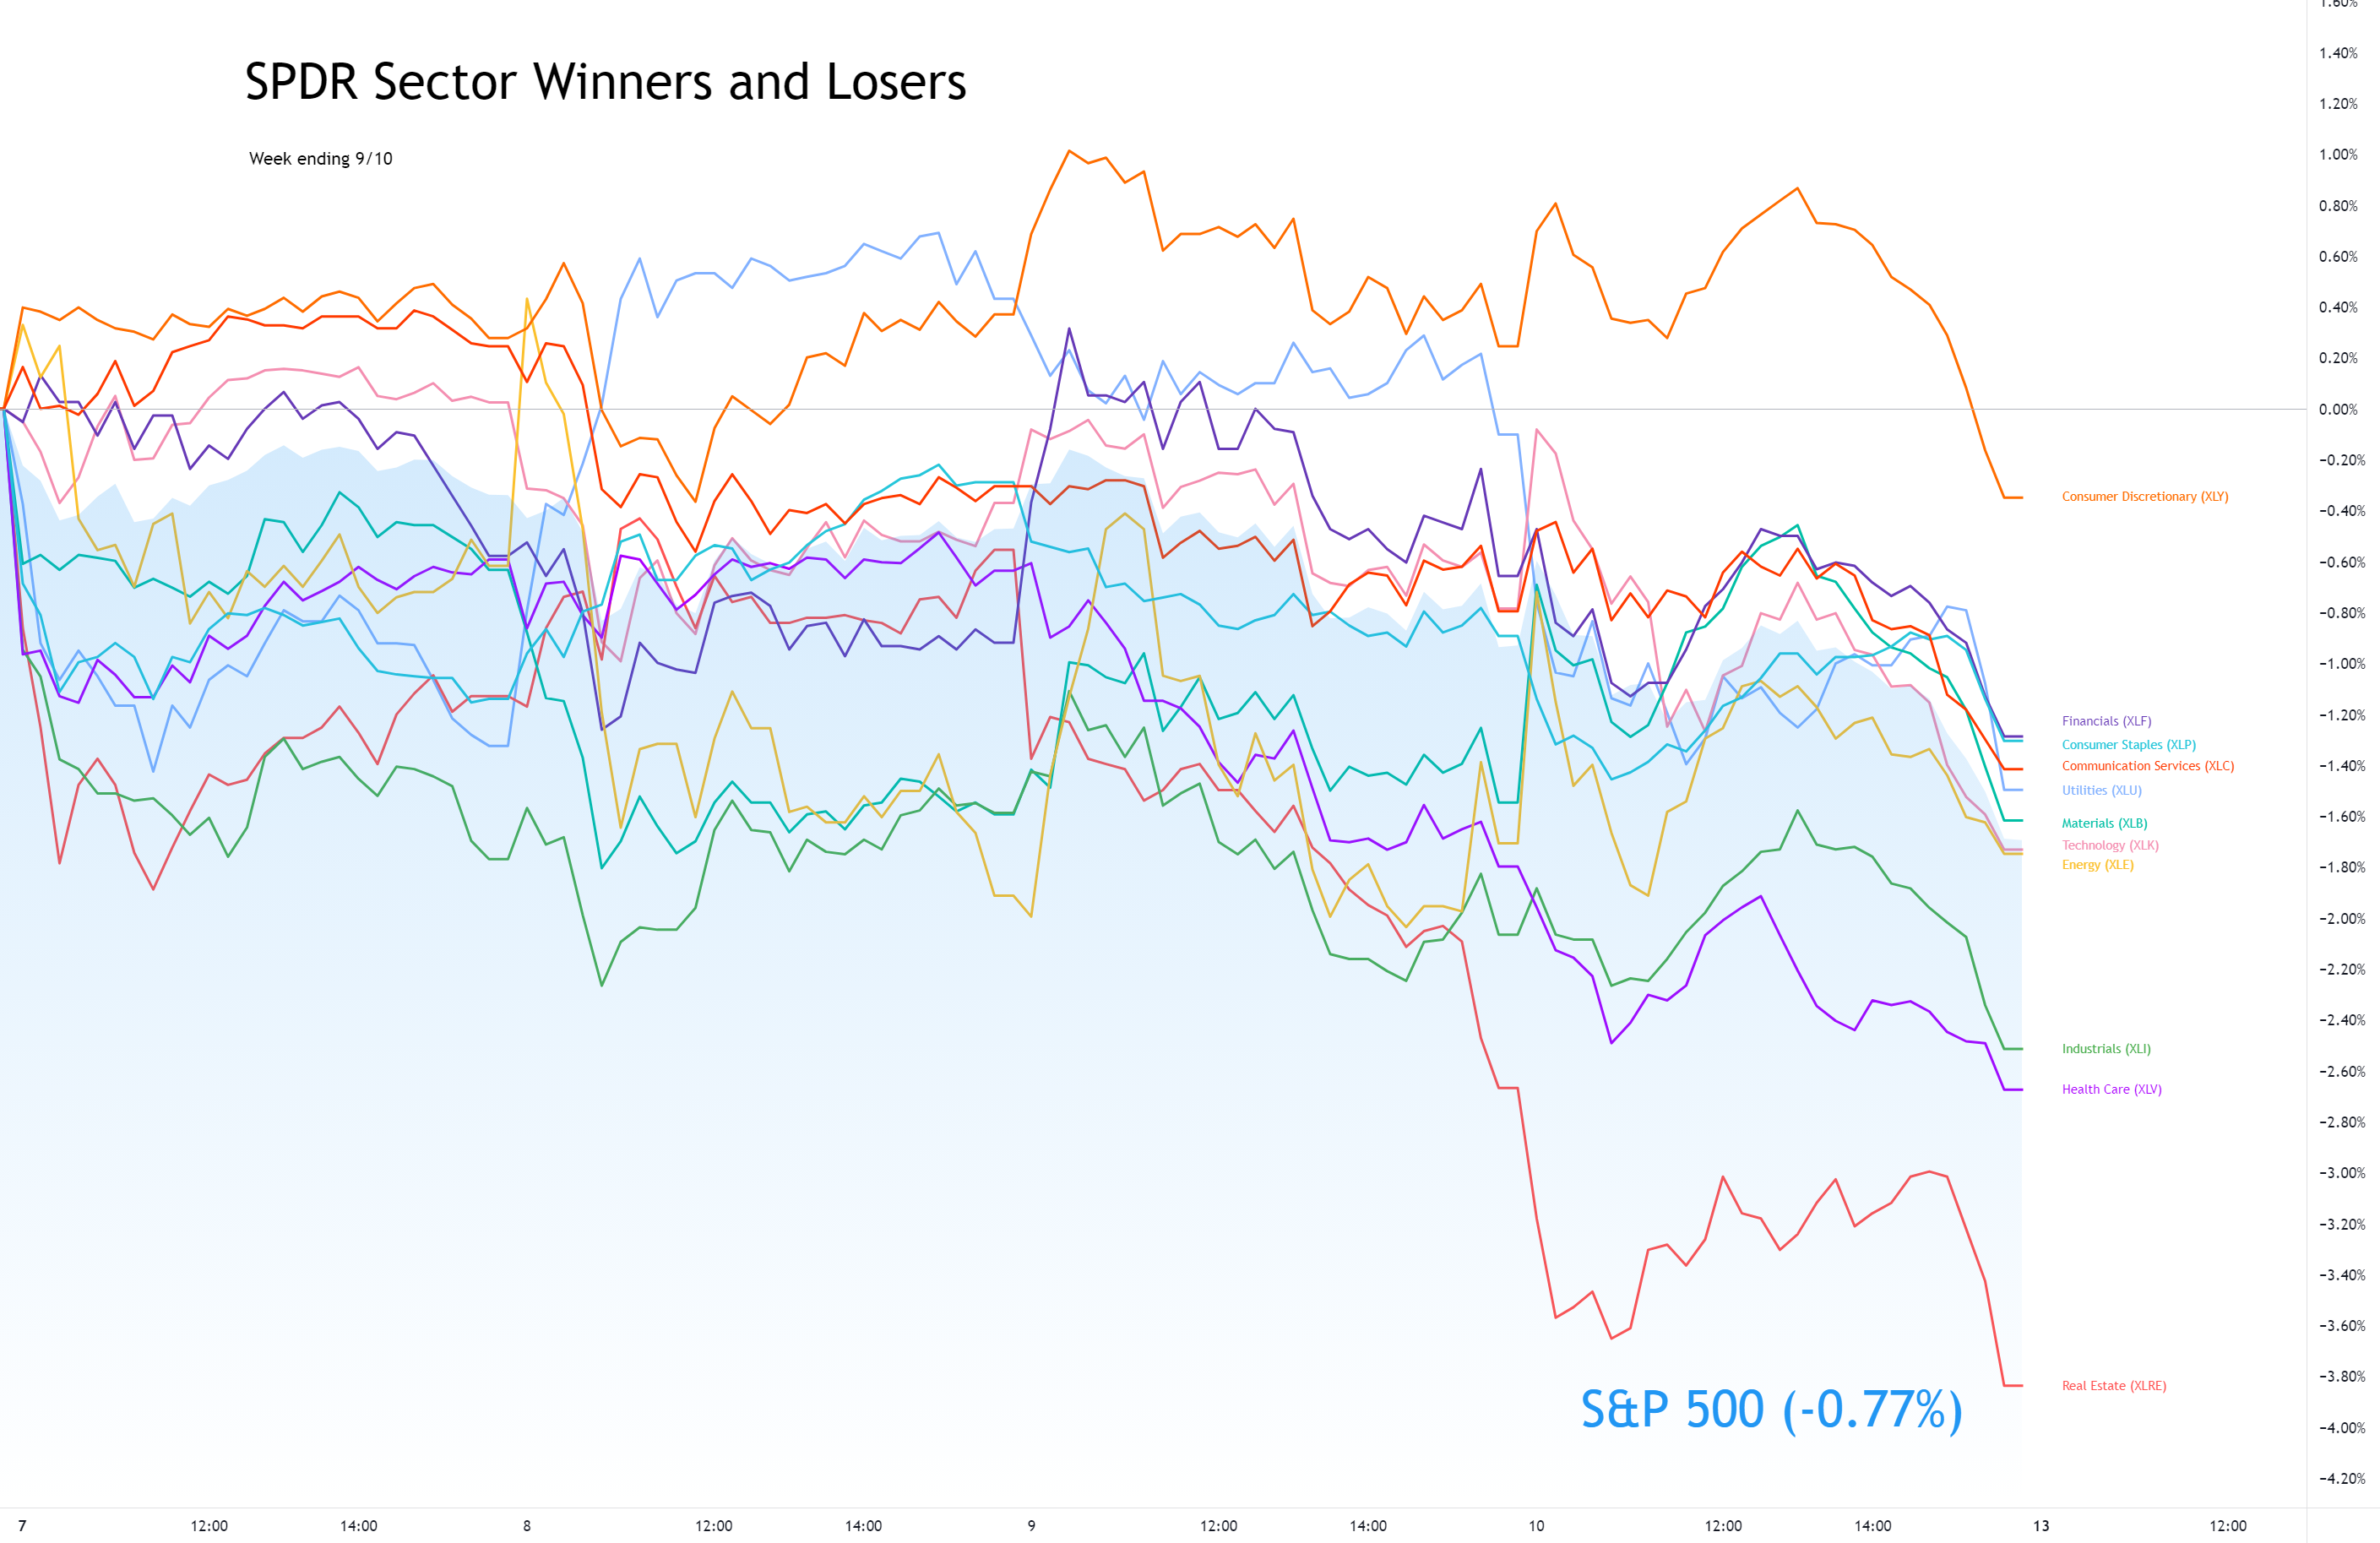
All sectors declined this week as the S&P 500 pulled back from all-time highs. Consumer Discretionary ( XLY ) was poised to end the week with gains before losing those gains in Friday afternoon selling.
Real Estate ( XLRE ) was the worst-performing sector of the week after outperforming the market in the previous week. The sector erased all of last week's 4% gain as investors reversed the trade that is supposed to protect against inflation and benefit from low interest rates.
Utilities ( XLU ) took the top position on Wednesday but gave the lead back to Consumer Discretionary on Thursday.
-=x=-=x=-=x=-=x=-=x=-=x=-=x=-
Economic Indicators
The US Dollar (DXY) advanced +0.57% for the week.
US Treasuries 30y yield declined this week after there was high demand in an auction on Thursday. The 10y yield rose for the third week. The 2y yield also rose. The 30/5 spread declined for the week.
High Yield (HYG) Corporate Bond prices declined this week while Investment Grade (LQD) Corporate Bond prices advanced.
Silver and Gold fell for the week. Crude Oil was up but has been sticking within a bound range since the end of August. Timber declined for the week.
The big moves in commodities were Copper and Aluminum futures. Copper was up +3.46% for the week. Aluminum soared +7.05% prices and has risen 15% over the past three weeks among reported supply issues.
-=x=-=x=-=x=-=x=-=x=-=x=-=x=-
Investor Sentiment
The put/call ratio (PCCE) ended the week at 0.728. The level is not overly bearish but is much higher than a week ago when it was near 0.5.
The CNN Fear & Greed Index moved back to Fear and is approaching Extreme Fear.
The NAAIM money manager exposure index fell to 84.68 from 93.95 the previous week.
-=x=-=x=-=x=-=x=-=x=-=x=-=x=-
Stocks of the Week
This week, Apple (AAPL) led the declines for the four largest mega-caps with a -3.45% loss. The sell-off on Friday came after a judge ruled Apple must loosen the strict rules for sellers in its app store. Microsoft (MSFT) and Alphabet (GOOGL) also ended the week with losses. The three stocks moved below their 21d exponential moving average on the daily chart but remained above the 10w moving average on the weekly chart. Amazon (AMZN) also declined but is trading above these moving averages for now.
Lululemon (LULU) climbed 14% intraday on Thursday before ending the week with a 10% gain. The company smashed earnings expectations and improved its outlook for the remainder of the year.
UP Fintech (TIGR) missed earnings expectations in their report this week but continues to impress investors with strong growth and potential for growth in the future. The stock was up 18% intraday on Friday before closing, with an 8.59% gain for the day.
Peloton (PTON) gained 16% for the week after announcing its private-label apparel brand. The news came on Wednesday, sending the stock 9% and 6% the following two days.
SUMO Digital dropped -14.91% this week despite beating revenue and earnings expectations this week. Analysts downgraded the stock because growth projections were primarily focused on one large customer. The stock is down 60% from its all-time high set in January of this year.
DraftKings (DKNG) and Penn National Gaming (PENN) continue to climb as the college and professional football seasons get underway, with many stadiums allowing near full capacity and bringing some added excitement back to the games and sports betting.
-=x=-=x=-=x=-=x=-=x=-=x=-=x=-
Cryptocurrency
Bitcoin (BTCUSD) and Ethereum (ETHUSD) dropped sharply this week, declining -11.13% and -13.88% after the rollout of digital currency in El Salvador hit snags among glitches in major trading platforms such as Coinbase (COIN). Coinbase was also down nearly 11% for the week.
Litecoin (LTCUSD) got a boost, advancing +33.14% on the excitement of non-fungible tokens launching on the platform.
-=x=-=x=-=x=-=x=-=x=-=x=-=x=-
The Week Ahead
Monday
OPEC's Monthly report is due on Monday morning. The Federal Budget Balance comes in the afternoon.
Oracle (ORCL) and H&R Block (HRB) report earnings on Monday.
Tuesday
Inflation data will have everyone's attention on Tuesday with the release of August's consumer price index data.
There are no relevant earnings reports for Tuesday.
Wednesday
Export and Import Price Index data and the NY Empire State Manufacturing Index will be available on Wednesday. Crude Oil Inventories will be available after the market opens.
There are no relevant earnings reports for Wednesday.
Thursday
On Thursday, we will get Retail Sales data for August. Initial Jobless Claims will also be available in the morning.
There are no relevant earnings reports for Thursday.
Friday
Initial Consumer Sentiment data for September, released on Friday, will hopefully improve over the previous month.
There are no relevant earnings reports for Friday.
-=x=-=x=-=x=-=x=-=x=-=x=-=x=-
The Bullish Side
Investors have been dealing with worries over bond tapering for months. Good and bad economic news has had opposite impacts on markets as investors consider that the Fed might slow bond purchases quicker than previously expected. Each time that has caused a dip in the major indexes that recovers in the following week. While sentiment indicators show fear in the market, the market continues to climb higher on those fears.
Economic growth is being held back not by a lack of demand but a lack of supply across many parts of the economy. The labor market, raw materials, and transportation are all holding back the market from meeting demands. The only place not seeing a high demand now are pandemic-vulnerable segments in the service industry. The market will figure out how to meet demand, and the economy will move forward.
-=x=-=x=-=x=-=x=-=x=-=x=-=x=-
The Bearish Side
The pending Fed bond purchase taper could be another painful lesson in how bond volatility impacts equity markets. Treasury yields will rise through the end of the year and potentially have an impact similar to when they rose in the first quarter. Expect a series of rotations as investors rebalance portfolios in anticipation of the changing dynamic.
-=x=-=x=-=x=-=x=-=x=-=x=-=x=-
Key Nasdaq Levels to Watch
This week, the Nasdaq set another all-time high but closed the week lower, resting just above the 21d exponential moving average.
On the positive side, the levels are:
On the downside, there are a few key levels:
-=x=-=x=-=x=-=x=-=x=-=x=-=x=-
Wrap-up
September looks like it will live up to its reputation as the most bearish month of the year. The 2020 September correction took the Nasdaq to a 12% decline. It looks like this month will be a more typical 5-6% dip taking us back to the 14,500 area before getting support. Of course, some economic news could turn that around.
I don't think we are going to see a more severe correction at this point. Even when the Fed starts tapering, they will not be shutting off purchases all at once. It's a taper, not a termination. Interest rate hikes are still far in the future. Using lower borrowing rates on top of high cash accounts, Corporations will spend to meet high demands in the economy. Eventually, supply chain issues will diminish, and companies will show improving P/E ratios, allowing investors to be less concerned about an extended stock market.
Good luck, stay healthy, and trade safe!
Notes
- The Market Week in Review is my weekend homework where I look over what happened in the previous week and what might come in the next week.
- I occasionally have some errors or typos and will correct them in my blog or the comments on TradingView. I do not have an editor and do this in my free time.
- If you find this helpful, please let me know in the comments. I am also more than happy to add new perspectives and data points if you have ideas.
The structure is the following:
- A recap of the daily updates that I do here on TradingView.
- View on the past week
- What's coming in the next week
- The Bullish View, The Bearish View
- Key index levels to watch out for
- Wrap-up
If you have been following my daily updates, you can skip down to "View on the Week." If not, then this first part is a great play-by-play recap for the week. Click the daily charts for more detail on sectors, indexes, and market leaders each day.
-=x=-=x=-=x=-=x=-=x=-=x=-=x=-
Tuesday, September 07, 2021
Facts: +0.07%, Volume lower, Closing Range: 52%, Body: 3% Red
Good: Higher high, higher low on increased volume
Bad: Low A/D ratio, thin red body in middle of candle signals indecision
Highs/Lows: Higher high, Higher low
Candle: Indecisive doji style candle shows buyers and sellers in market
Advance/Decline: 0.45, two declining stocks for every advancing stock
Indexes: SPX (-0.34%), DJI (-0.76%), RUT (-0.72%), VIX (+10.54%)
Sector List: Consumer Discretionary (XLY +0.29%) and Communications (XLC +0.23%) at the top. Utilities (XLU -1.32%) and Industrials (XLI -1.73%) at the bottom.
Expectation: Sideways or Lower
Markets closed the day with mixed results as investors worried about a slowing economy and uncertainty around when the Fed would start bond tapering. Big Tech were viewed as safe bets, helping keep the growth sectors and the Nasdaq in the positive for the day.
The Nasdaq ended the day with a +0.07% gain, setting a new all-time and another record close. The 3% red body rests in the middle of the candle, representing the indecision for buyers and sellers during the day. The closing range of 52% is ok. The fight between bulls and bears created a higher volume day than the previous day. There were over two declining stocks for every advancing stock.
-=x=-=x=-=x=-=x=-=x=-=x=-=x=-
Wednesday, September 08, 2021
Facts: -0.57%, Volume higher, Closing Range: 52%, Body: 48% Red
Good: Climb back to 52% closing range after morning selling
Bad: Red body, lower high and close on higher volume
Highs/Lows: Lower high, Lower low
Candle: No upper wick, half red body and half lower wick
Advance/Decline: 0.31, more than three declining
Indexes: SPX (-0.13%), DJI (-0.20%), RUT (-1.14%), VIX (-0.99%)
Sector List: Utilities (XLU +1.79%) and Consumer Staples (XLP +0.86%) at the top. Materials (XLB -0.96%) and Energy (XLE -1.28%) at the bottom.
Expectation: Sideways or Lower
Investors were cautious on Wednesday, sending indexes lower over fears of a slowing economy. Defensive sectors led the day.
The Nasdaq closed with a -0.57% loss for the day. Volume was higher than the previous day. The closing range of 52% comes below a 48% red body that occupies the upper half of the candle. There is a long lower wick and no upper wick. More than three stocks declined for every advancing stock.
-=x=-=x=-=x=-=x=-=x=-=x=-=x=-
Thursday, September 09, 2021
Facts: -0.25%, Volume lower, Closing Range: 3%, Body: 45% Red
Good: Closed above yesterday's low
Bad: Long upper wick formed after a failed morning rally
Highs/Lows: Lower high, Higher low
Candle: Inside day, long upper wick with very low closing range
Advance/Decline: 0.83, more declining stocks than advancing stocks
Indexes: SPX (-0.46%), DJI (-0.43%), RUT (-0.03%), VIX (+4.68%)
Sector List: Financials (XLF +0.29%) and Energy (XLE +0.21%) at the top. Health (XLV -1.15%) and Real Estate (XLRE -2.12%) at the bottom.
Expectation: Lower
Indexes declined today after a volatile day for bonds. Yields were rising in the early morning before a robust 30y Bond auction sent yields lower. Jobless claims data released in the morning hit another pandemic low, boosting the economic outlook but raising expectations for the Fed to start tapering bond repurchasing.
The Nasdaq closed with a -0.25% gain for the day. The index could not hold onto a morning rally that formed a long upper wick. The index faded after the rally to end the day with a 3% closing range and 45% red body. Volume was lower than the previous day, and the trading range was within the high and low of Wednesday. There were more declining stocks than advancing stocks.
-=x=-=x=-=x=-=x=-=x=-=x=-=x=-
Friday, September 10, 2021
Facts: -0.87%, Volume higher, Closing Range: 2%, Body: 91% Red
Good: Stayed above 21d EMA, but maybe just because the market closed
Bad: Failed support at 15,200, all red body candle
Highs/Lows: Lower high, Lower low
Candle: Tiny upper wick and no lower wick, all red body
Advance/Decline: 0.36, three declining stocks for every advancing stock
Indexes: SPX (-0.77%), DJI (-0.78%), RUT (-0.96%), VIX (+11.44%)
Sector List: Materials (XLB -0.02%) and Energy (XLE -0.04%) at the top. Real Estate (XLRE -1.26%) and Utilities (XLU -1.40%) at the bottom.
Expectation: Lower
Markets reacted on fears of a slowing economy while demand remains higher than supply in several parts of the economy, and indicators show continued inflation for producers. The day marks the fourth straight session of declines for equities.
The Nasdaq lost -0.87% for the day on a higher volume than average. The candle is 91% red body with a tiny upper wick and barely visible lower wick. The closing range was 2%. There were three declining stocks for every advancing stock.
-=x=-=x=-=x=-=x=-=x=-=x=-=x=-
View on the Week
This week investors wrestled with worries over a slowing economic recovery and the timing of the Fed's bond tapering this fall. The short week opened with the Nasdaq reaching a new all-time high, but prices faded from that point through the end of the week. Glitches in cryptocurrency platforms sent Bitcoin and Ethereum lower, while NFTs sent Litecoin higher.
The previous Friday's employment data provided a sour outlook for investors looking for more robust economic growth. That disappointing news came amidst continued concerns over the spread of the Delta variant of COVID, causing more headwinds for the service industry. The result was investors buying up big tech at the beginning of the week. Big tech has shown resilience to the impacts of the pandemic.
The economic data brings up another concern for investors. When will the Fed start to taper bond purchases? At first glance, one could imagine that the slowing growth in payrolls would push tapering out further.
On the contrary, statements from the Fed this week indicated that the economy had recovered enough that bond tapering could still proceed in the short term.
The result was quite a bit of volatility in Treasury bonds. Volatility in the bond market is going to lead to volatility in equities. Both increase risk for large institutional investors who are inevitably going to reduce or hedge positions. So we have a week of distribution days across all the major indexes, with the huge drops coming in mid-day reactions.
The sell-off on Friday afternoon capped the bearish week and was likely investors positioning against further volatility over the weekend.
The Nasdaq declined -1.62% for the week. Volume was higher than the previous week. The closing range is 2%, reflecting the selling on Friday afternoon that continued into the market close.
The Dow Jones Industrial Average (DJI) fell -2.15% for the week. The S&P 500 (SPX) declined -1.69%. The Russell 2000 (RUT) lost -2.81% this week.
The VIX volatility index ended the week up +27.68% over the previous week.
-=x=-=x=-=x=-=x=-=x=-=x=-=x=-
Sectors
All sectors declined this week as the S&P 500 pulled back from all-time highs. Consumer Discretionary ( XLY ) was poised to end the week with gains before losing those gains in Friday afternoon selling.
Real Estate ( XLRE ) was the worst-performing sector of the week after outperforming the market in the previous week. The sector erased all of last week's 4% gain as investors reversed the trade that is supposed to protect against inflation and benefit from low interest rates.
Utilities ( XLU ) took the top position on Wednesday but gave the lead back to Consumer Discretionary on Thursday.
-=x=-=x=-=x=-=x=-=x=-=x=-=x=-
Economic Indicators
The US Dollar (DXY) advanced +0.57% for the week.
US Treasuries 30y yield declined this week after there was high demand in an auction on Thursday. The 10y yield rose for the third week. The 2y yield also rose. The 30/5 spread declined for the week.
High Yield (HYG) Corporate Bond prices declined this week while Investment Grade (LQD) Corporate Bond prices advanced.
Silver and Gold fell for the week. Crude Oil was up but has been sticking within a bound range since the end of August. Timber declined for the week.
The big moves in commodities were Copper and Aluminum futures. Copper was up +3.46% for the week. Aluminum soared +7.05% prices and has risen 15% over the past three weeks among reported supply issues.
-=x=-=x=-=x=-=x=-=x=-=x=-=x=-
Investor Sentiment
The put/call ratio (PCCE) ended the week at 0.728. The level is not overly bearish but is much higher than a week ago when it was near 0.5.
The CNN Fear & Greed Index moved back to Fear and is approaching Extreme Fear.
The NAAIM money manager exposure index fell to 84.68 from 93.95 the previous week.
-=x=-=x=-=x=-=x=-=x=-=x=-=x=-
Stocks of the Week
This week, Apple (AAPL) led the declines for the four largest mega-caps with a -3.45% loss. The sell-off on Friday came after a judge ruled Apple must loosen the strict rules for sellers in its app store. Microsoft (MSFT) and Alphabet (GOOGL) also ended the week with losses. The three stocks moved below their 21d exponential moving average on the daily chart but remained above the 10w moving average on the weekly chart. Amazon (AMZN) also declined but is trading above these moving averages for now.
Lululemon (LULU) climbed 14% intraday on Thursday before ending the week with a 10% gain. The company smashed earnings expectations and improved its outlook for the remainder of the year.
UP Fintech (TIGR) missed earnings expectations in their report this week but continues to impress investors with strong growth and potential for growth in the future. The stock was up 18% intraday on Friday before closing, with an 8.59% gain for the day.
Peloton (PTON) gained 16% for the week after announcing its private-label apparel brand. The news came on Wednesday, sending the stock 9% and 6% the following two days.
SUMO Digital dropped -14.91% this week despite beating revenue and earnings expectations this week. Analysts downgraded the stock because growth projections were primarily focused on one large customer. The stock is down 60% from its all-time high set in January of this year.
DraftKings (DKNG) and Penn National Gaming (PENN) continue to climb as the college and professional football seasons get underway, with many stadiums allowing near full capacity and bringing some added excitement back to the games and sports betting.
-=x=-=x=-=x=-=x=-=x=-=x=-=x=-
Cryptocurrency
Bitcoin (BTCUSD) and Ethereum (ETHUSD) dropped sharply this week, declining -11.13% and -13.88% after the rollout of digital currency in El Salvador hit snags among glitches in major trading platforms such as Coinbase (COIN). Coinbase was also down nearly 11% for the week.
Litecoin (LTCUSD) got a boost, advancing +33.14% on the excitement of non-fungible tokens launching on the platform.
-=x=-=x=-=x=-=x=-=x=-=x=-=x=-
The Week Ahead
Monday
OPEC's Monthly report is due on Monday morning. The Federal Budget Balance comes in the afternoon.
Oracle (ORCL) and H&R Block (HRB) report earnings on Monday.
Tuesday
Inflation data will have everyone's attention on Tuesday with the release of August's consumer price index data.
There are no relevant earnings reports for Tuesday.
Wednesday
Export and Import Price Index data and the NY Empire State Manufacturing Index will be available on Wednesday. Crude Oil Inventories will be available after the market opens.
There are no relevant earnings reports for Wednesday.
Thursday
On Thursday, we will get Retail Sales data for August. Initial Jobless Claims will also be available in the morning.
There are no relevant earnings reports for Thursday.
Friday
Initial Consumer Sentiment data for September, released on Friday, will hopefully improve over the previous month.
There are no relevant earnings reports for Friday.
-=x=-=x=-=x=-=x=-=x=-=x=-=x=-
The Bullish Side
Investors have been dealing with worries over bond tapering for months. Good and bad economic news has had opposite impacts on markets as investors consider that the Fed might slow bond purchases quicker than previously expected. Each time that has caused a dip in the major indexes that recovers in the following week. While sentiment indicators show fear in the market, the market continues to climb higher on those fears.
Economic growth is being held back not by a lack of demand but a lack of supply across many parts of the economy. The labor market, raw materials, and transportation are all holding back the market from meeting demands. The only place not seeing a high demand now are pandemic-vulnerable segments in the service industry. The market will figure out how to meet demand, and the economy will move forward.
-=x=-=x=-=x=-=x=-=x=-=x=-=x=-
The Bearish Side
The pending Fed bond purchase taper could be another painful lesson in how bond volatility impacts equity markets. Treasury yields will rise through the end of the year and potentially have an impact similar to when they rose in the first quarter. Expect a series of rotations as investors rebalance portfolios in anticipation of the changing dynamic.
-=x=-=x=-=x=-=x=-=x=-=x=-=x=-
Key Nasdaq Levels to Watch
This week, the Nasdaq set another all-time high but closed the week lower, resting just above the 21d exponential moving average.
On the positive side, the levels are:
- The 10d moving average is at 15,268.34.
- A new all-time high was set on Monday at 15,403.44.
- The index met several days of resistance around 15,400.
- 15,500 may be the next area of resistance.
On the downside, there are a few key levels:
- The low of the week is 15,111.31, just below Friday's close.
- The 21d EMA is at 15,081.46.
- 15,000 is an area of support.
- The 50d MA is at 14,825.85.
- 14,423.16 is the low of the most recent pullback.
- 14,200 remains a critical level if the index moves downward.
- 14,000 has been an area of support/resistance.
- There is a pivot at 13,903.73.
- A further pullback would likely hit the 200d moving average at 13,771.69. The index hasn't approached this line since rising above it in April 2020.
-=x=-=x=-=x=-=x=-=x=-=x=-=x=-
Wrap-up
September looks like it will live up to its reputation as the most bearish month of the year. The 2020 September correction took the Nasdaq to a 12% decline. It looks like this month will be a more typical 5-6% dip taking us back to the 14,500 area before getting support. Of course, some economic news could turn that around.
I don't think we are going to see a more severe correction at this point. Even when the Fed starts tapering, they will not be shutting off purchases all at once. It's a taper, not a termination. Interest rate hikes are still far in the future. Using lower borrowing rates on top of high cash accounts, Corporations will spend to meet high demands in the economy. Eventually, supply chain issues will diminish, and companies will show improving P/E ratios, allowing investors to be less concerned about an extended stock market.
Good luck, stay healthy, and trade safe!