Summary: Positive economic news couldn't break through the September blues, making for a choppy week in the markets. Investors are balancing good economic data with the possibility that Fed may start bond tapering soon.
Notes
The structure is the following:
If you have been following my daily updates, you can skip down to "View on the Week." If not, then this first part is a great play-by-play recap for the week. Click the daily charts for more detail on sectors, indexes, and market leaders each day.
-=x=-=x=-=x=-=x=-=x=-=x=-=x=-
Monday, September 13, 2021

Facts: -0.07%, Volume higher, Closing Range: 40%, Body: 57% Red
Good: Closed above the 21d EMA
Bad: Two dips below 21d EMA, couldn't hold intraday high at open
Highs/Lows: Lower high, Lower low
Candle: Red body in upper half of candle with a long lower wick
Advance/Decline: 0.73, more declining than advancing
Indexes: SPX (+0.23%), DJI (+0.76%), RUT (+0.59%), VIX (-7.54%)
Sector List: Energy (XLE +2.87%) and Financials (XLF +1.14%) at the top. Utilities (XLU -0.18%) and Health (XLV -0.62%) at the bottom.
Expectation: Sideways or Lower
The OPEC Monthly Report provided a positive outlook for the economy, stating that oil demand would exceed pre-pandemic levels next year. That sent oil futures and the Energy sector higher and turned investors more optimistic on value stocks and the re-opening trade.
The Nasdaq closed the day with a -0.07% decline. Volume was higher than the previous day. The index started with a gain but quickly sold as investors rotated out of growth stocks and back into value stocks. The Nasdaq dipped below its 21d exponential moving average twice but was able to close above the line. The closing range of 40% is under a red body that covers more than half of the candle. There is a long lower wick with a tiny upper wick. More stocks declined than advanced on the Nasdaq. Notably, there were two advancing stocks for every declining stock on the New York Stock Exchange.
-=x=-=x=-=x=-=x=-=x=-=x=-=x=-
Tuesday, September 14, 2021
Facts: -0.45%, Volume lower, Closing Range: 17%, Body: 76% Red
Good: Support above 15,000
Bad: Mostly red body, lower high, lower low. a/d ratio
Highs/Lows: Lower high, Lower low
Candle: Mostly red body with small upper and lower wicks
Advance/Decline: 0.28, more than three declining stocks for every advancing stock
Indexes: SPX (-0.57%), DJI (-0.84%), RUT (-1.37%), VIX (+0.46%)
Sector List: Health (XLV -0.02%) and Technology (XLK -0.13%) at the top. Financials (XLF -1.34%) and Energy (XLE -1.44%) at the bottom.
Expectation: Lower
US Treasury Yields slid after the morning's consumer price index data added more confusion to the economic picture. Is lower than expected inflation a good thing or a bad thing? What does it mean for Fed monetary policy? The unanswered questions equate to risk for investors, sending them to safer bets.
The Nasdaq closed with a -0.45% decline. Volume was lower than the previous day. The 76% red body represents a bearish day ending with the closing range of 17%. There were more than three declining stocks for every advancing stock.
-=x=-=x=-=x=-=x=-=x=-=x=-=x=-
Wednesday, September 15, 2021
Facts: +0.82%, Volume lower, Closing Range: 93%, Body: 48% Green
Good: Support at 15,000 sent started a rally into afternoon
Bad: Could not break above yesterday's high
Highs/Lows: Lower high, Lower low
Candle: Long lower wick formed from morning sell, green upper body
Advance/Decline: 1.31, more advancing than declining stocks
Indexes: SPX (+0.85%), DJI (+0.68%), RUT (+1.11%), VIX (-6.58%)
Sector List: Energy (XLE +3.74%) and Industrials (XLI +1.10%) at the top. Consumer Staples (XLP +0.36%) and Utilities (XLU -0.13%) at the bottom.
Expectation: Sideways or Higher
Stocks rose on Wednesday after Crude Oil supplies signaled much higher demand than expected. That boosted the Energy sector by more than 3.5%, and the improved optimism drove broad gains across the market.
The Nasdaq gained +0.82% for the day after getting support at 15,000 in the morning. The 48% green body led to a 93% closing range. Volume was lower than the previous day, and there were more advancing stocks than declining stocks. The index could not break yesterday's high, so it is still in a downtrend, but the long lower wick formed from the bounce off 15,000 led to a rally in that afternoon that has potential.
-=x=-=x=-=x=-=x=-=x=-=x=-=x=-
Thursday, September 16, 2021
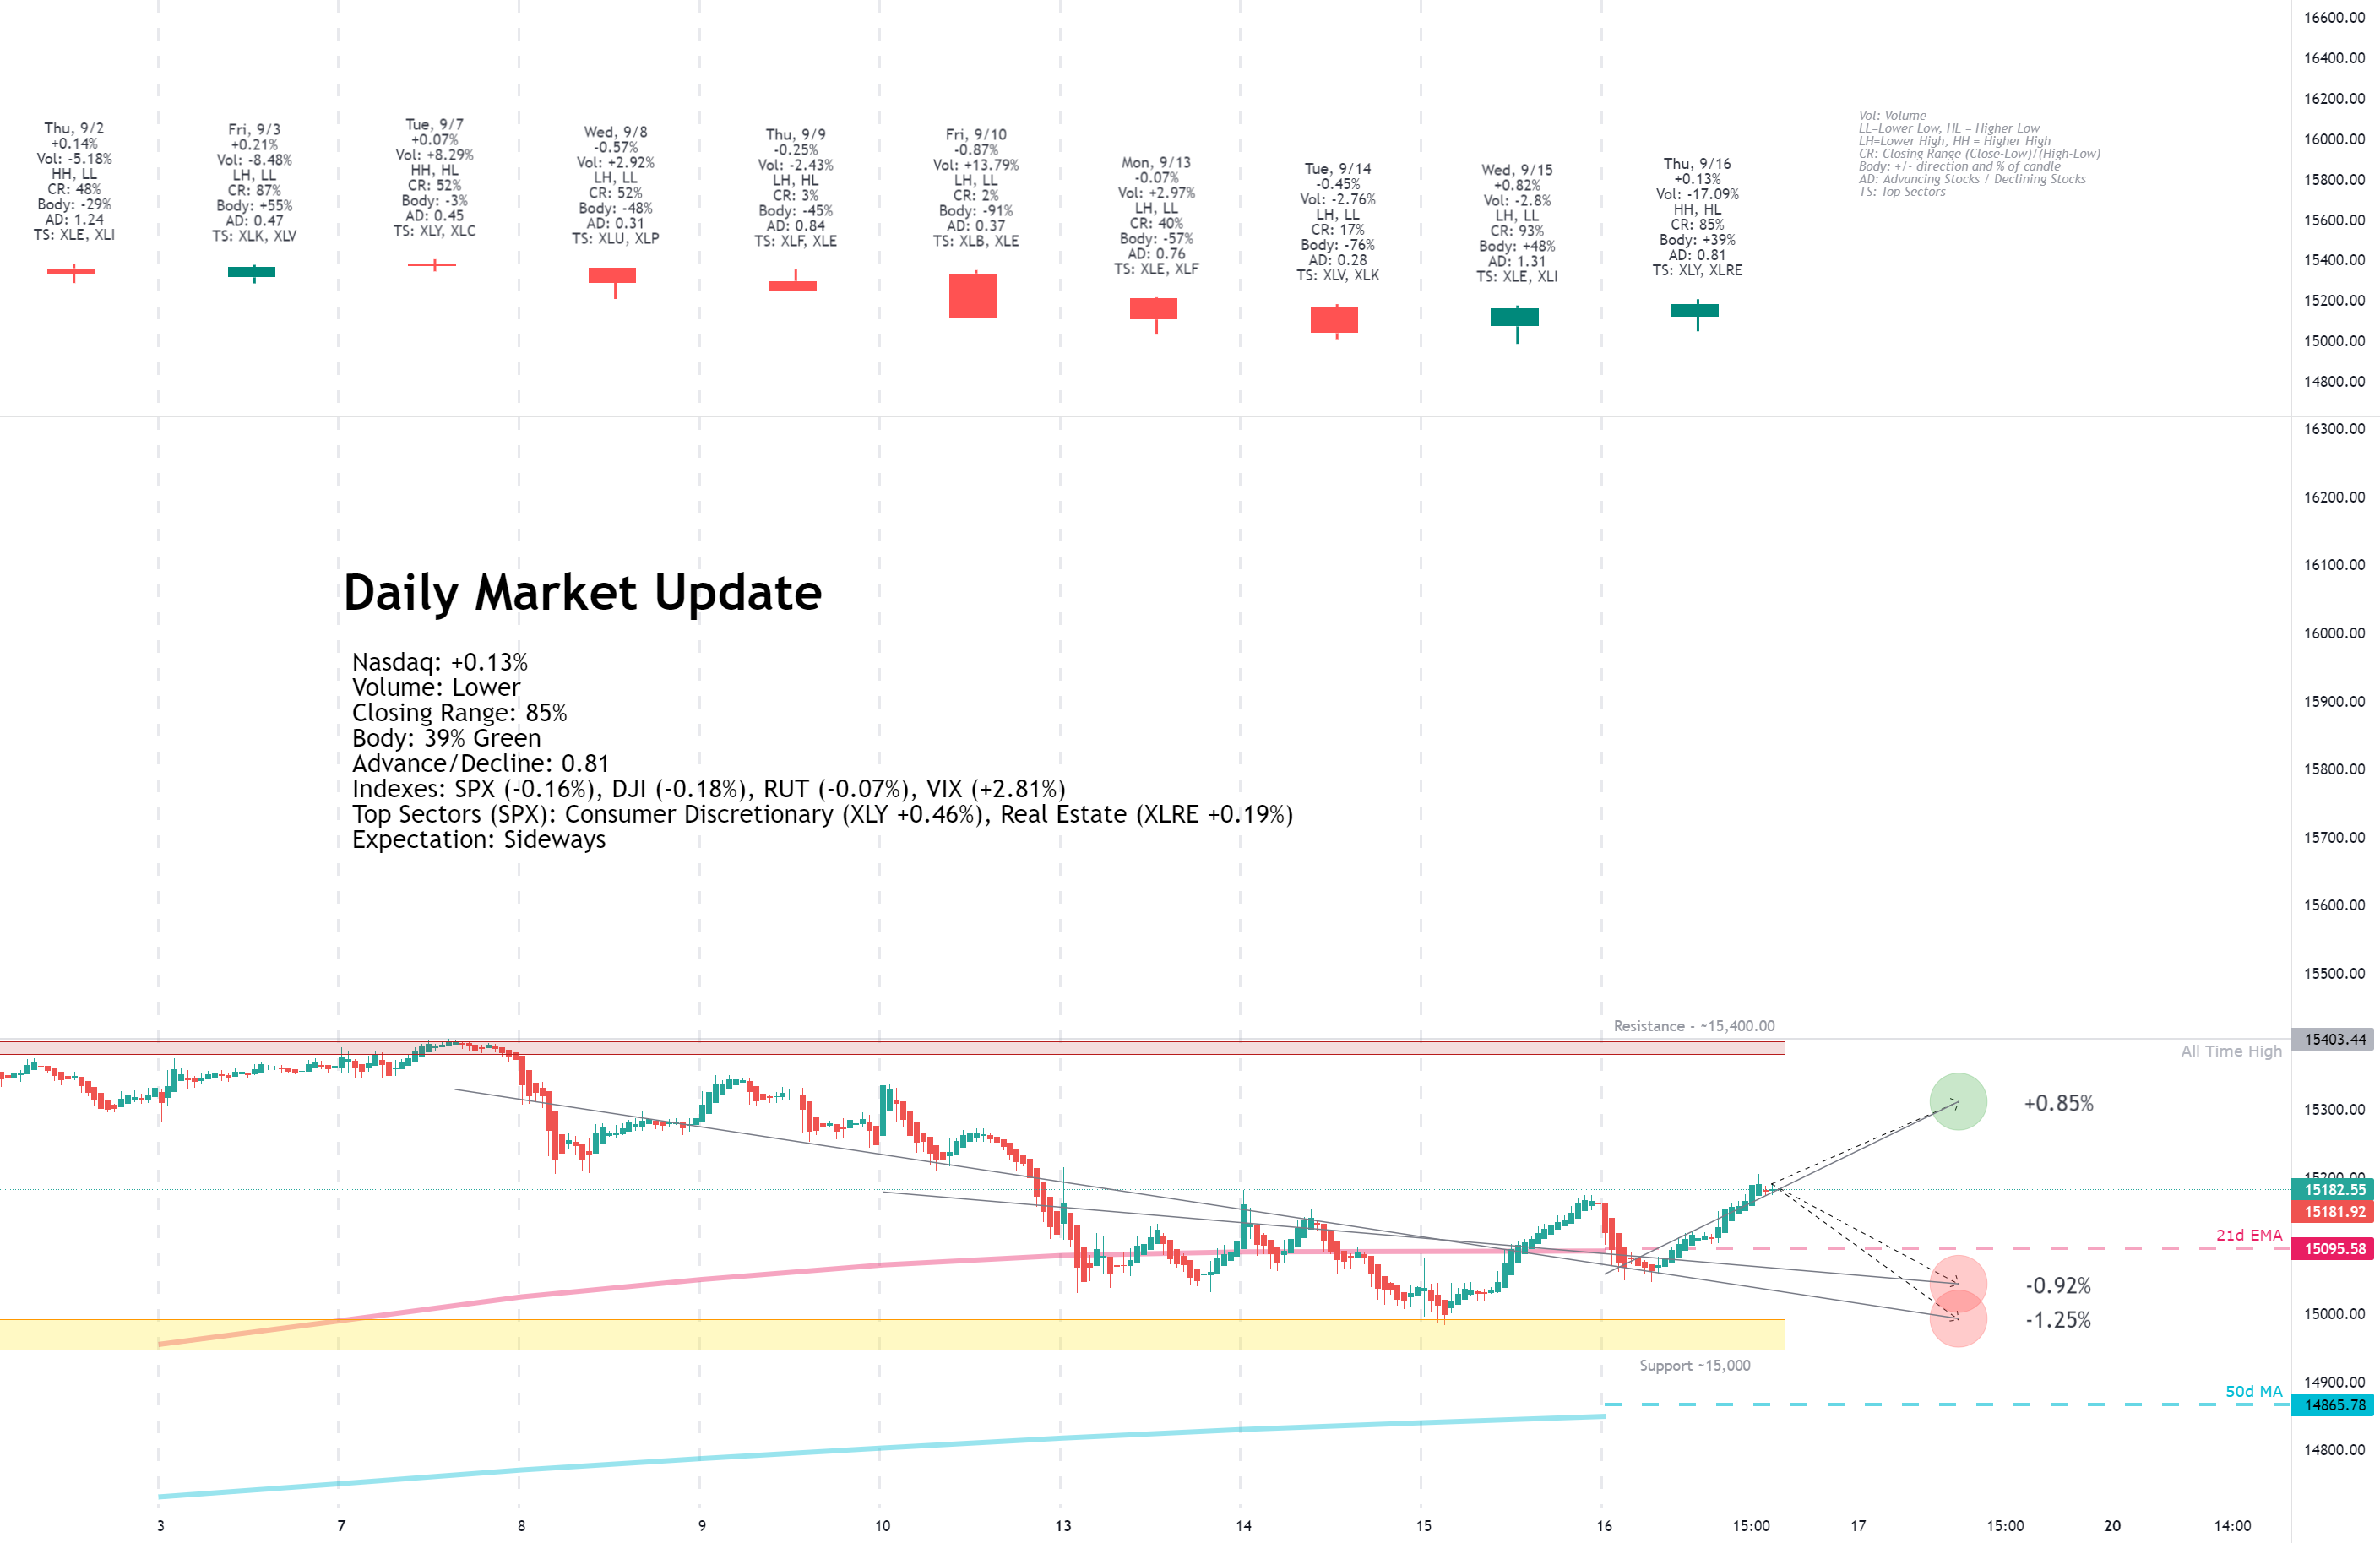
Facts: +0.13%, Volume lower, Closing Range: 85%, Body: 39% Green
Good: Higher high, good closing range
Bad: Dip below 21d EMA, low A/D ratio
Highs/Lows: Higher high, Higher low
Candle: Short body in upper half of candle, long lower wick
Advance/Decline: 0.81, more declining than advancing stocks
Indexes: SPX (-0.16%), DJI (-0.18%), RUT (-0.07%), VIX (+2.81%)
Sector List: Consumer Discretionary (XLY +0.46%) and Real Estate (XLRE +0.19%) at the top. Materials (XLB -1.08%) and Energy (XLE -1.13%) at the bottom.
Expectation: Sideways
Better than expected Retail Sales data help the Consumer Discretionary sector advance to the top of the sector list. However, rising Treasury Yields subdued other sectors and sent three of the four major indexes to losses for the day.
The Nasdaq closed the day with a +0.13% gain after dipping in the morning. The 39% green body is in the upper half of the candle, with a long lower wick representing the morning decline. After hitting the intraday low, the index rose through the afternoon to end with an 85% closing range. Volume was lower than the previous day, and there were more declining stocks than advancing stocks.
-=x=-=x=-=x=-=x=-=x=-=x=-=x=-
Friday, September 17, 2021
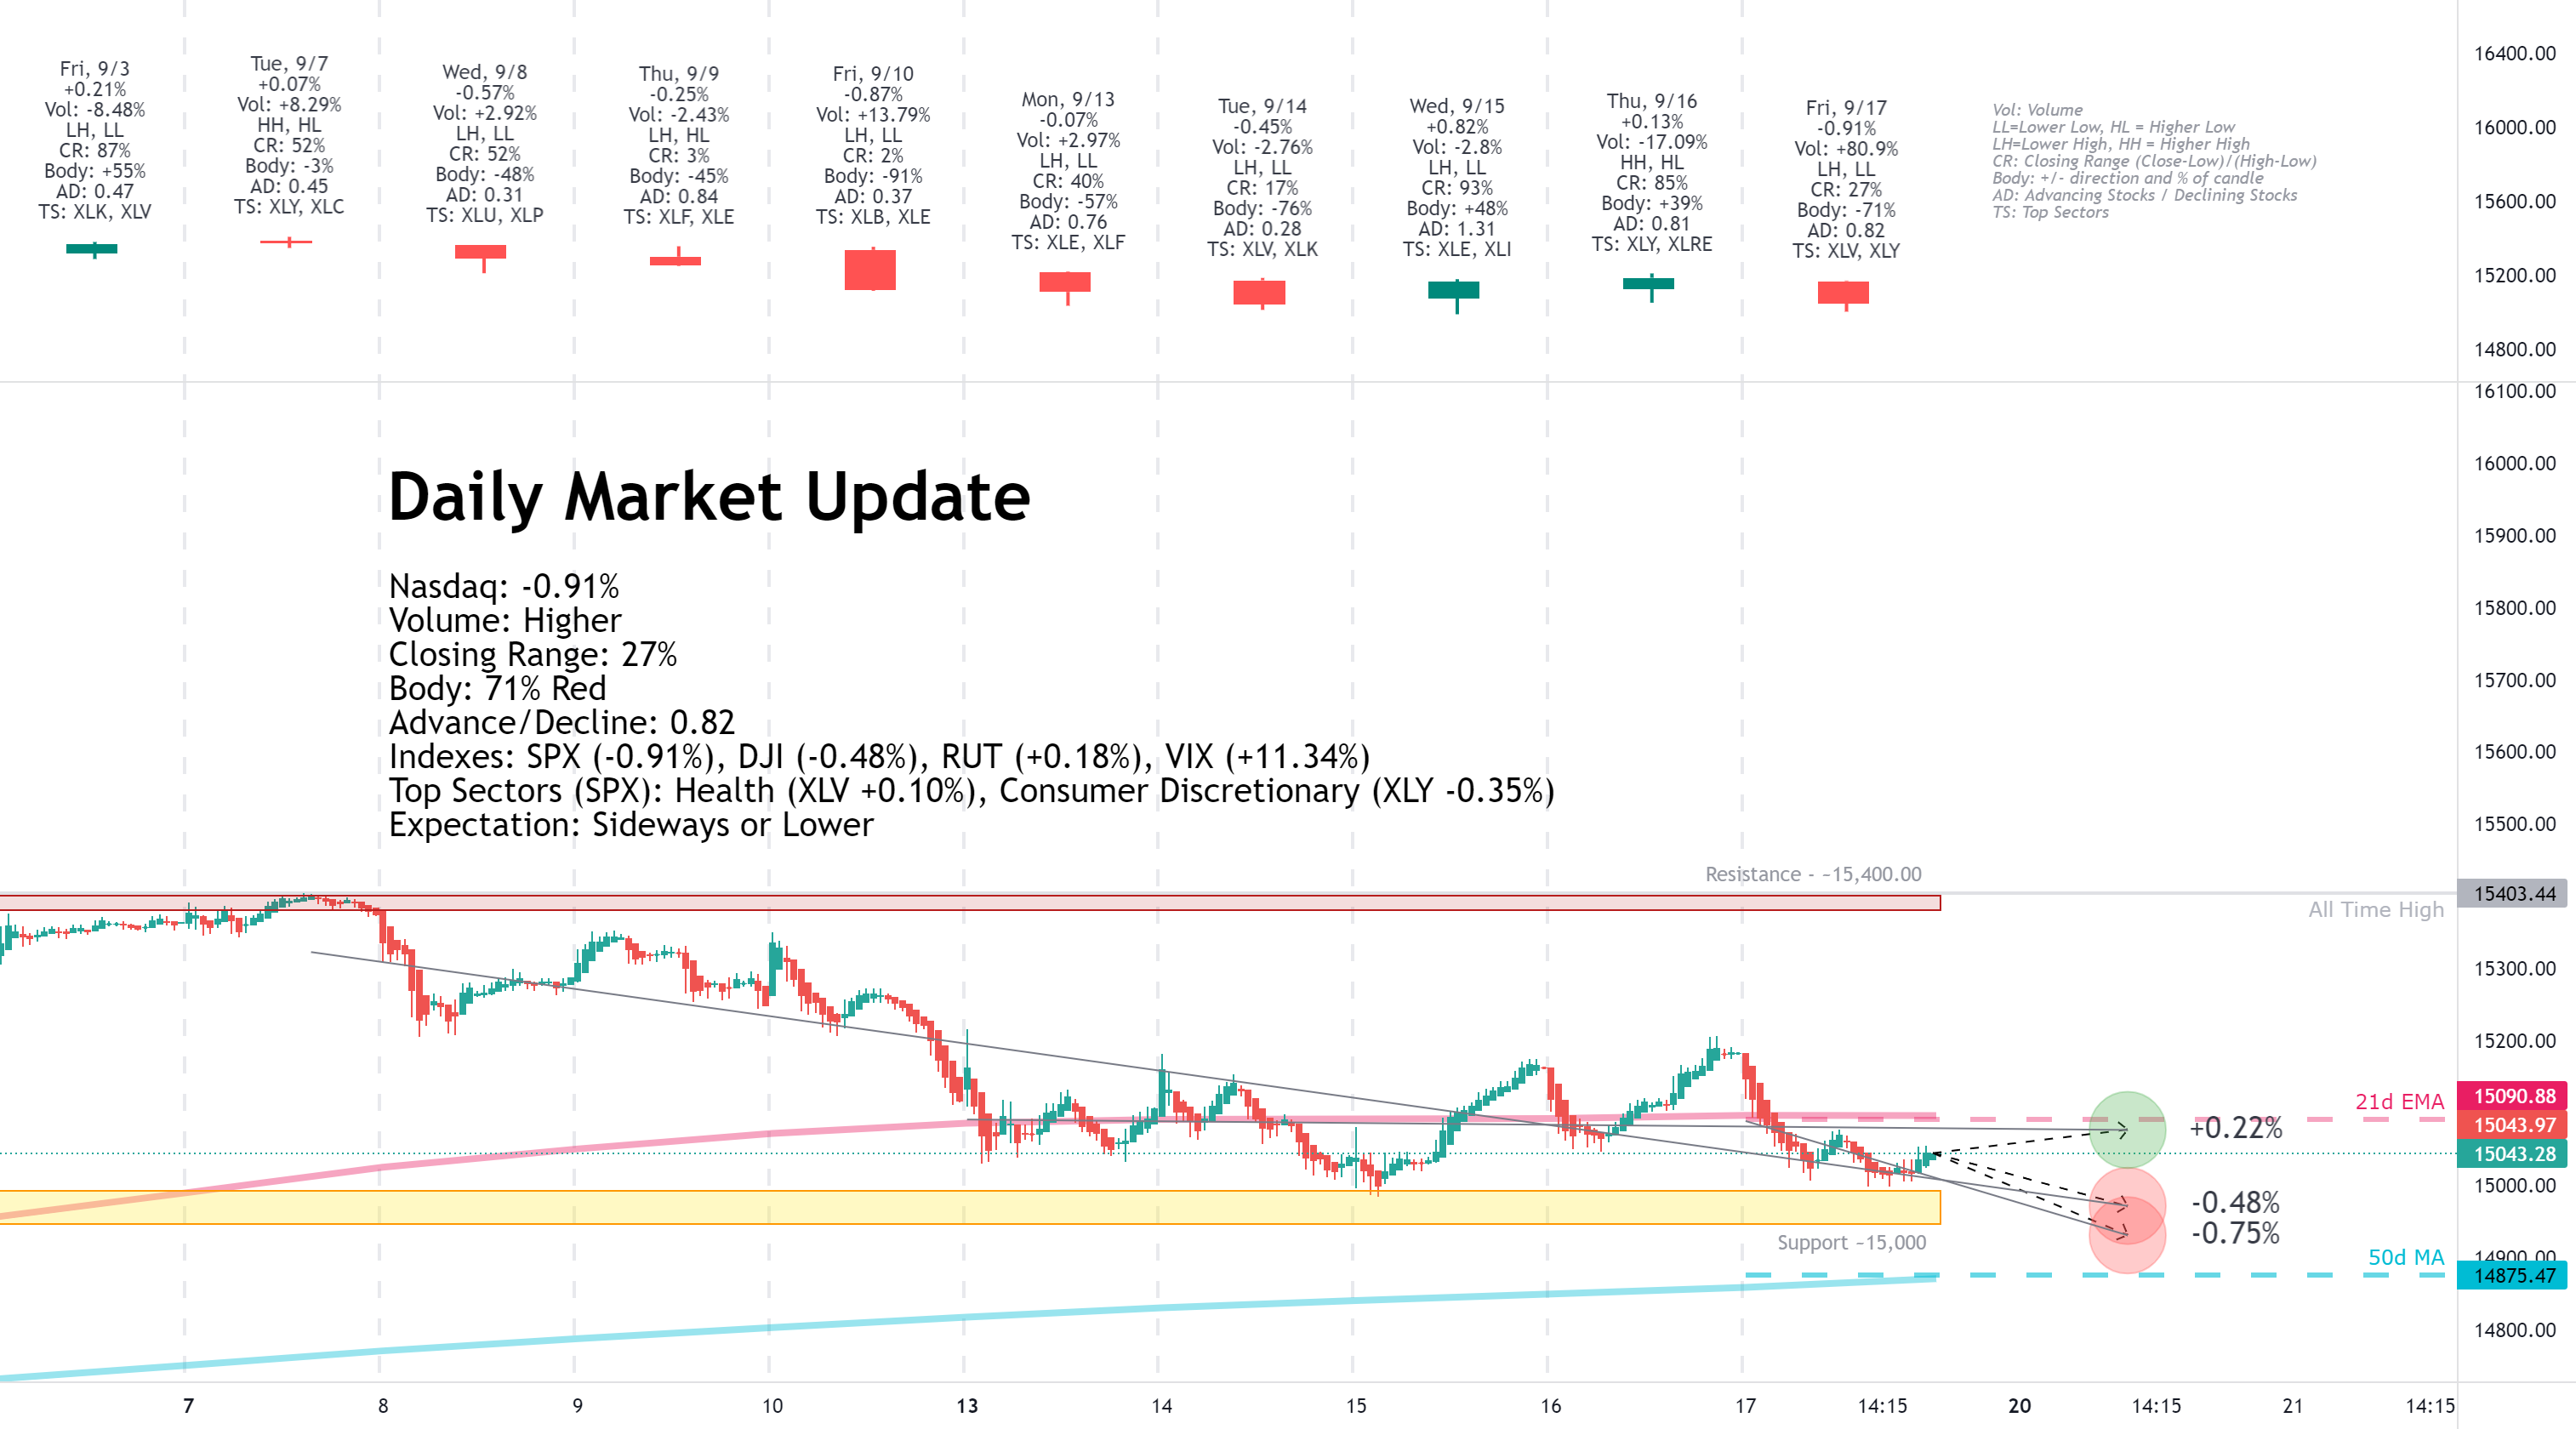
Facts: -0.91%, Volume higher, Closing Range: 27%, Body: 71% Red
Good: Support at 15,000
Bad: Close below 21d EMA, lower high
Highs/Lows: Lower high, Lower low
Candle: Mostly red body with a small lower wick
Advance/Decline: 0.82, more declining stocks than advancing stocks
Indexes: SPX (-0.91%), DJI (-0.48%), RUT (+0.18%), VIX (+11.34%)
Sector List: Health (XLV +0.10%) and Consumer Discretionary (XLY -0.35%) at the top. Technology (XLK -1.56%) and Materials (XLB -2.06%) at the bottom.
Expectation: Sideways or Lower
Indexes closed lower while volume soared on quadruple-witching Friday. Only the Russell 2000 was able to end the day with gains.
The Nasdaq moved back below its 21d EMA with a -0.91% decline today. Volume was more than 50% over average daily volume due to index and stock options expiration. The candle is primarily red body with a small lower wick. The closing range of 27% came after a rally before close. There were more declining stocks than advancing stocks.
-=x=-=x=-=x=-=x=-=x=-=x=-=x=-
View on the Week
Positive economic news couldn't break through the September blues, making for a choppy week in the markets. Investors are balancing good economic data with the possibility that Fed may start bond tapering soon.
The week opened with the OPEC monthly report stating that oil demand will meet or exceed pre-pandemic levels by next year. That was a more robust outlook for oil and translates to a better global economic outlook. The new optimism focused investors on value and reopening stocks.
As the week progressed, however, the better economic data for the US raised expectations that the Fed would begin tapering bond purchasing soon. While inflation data on Tuesday was slightly below forecasts, it was still high. Retail sales data on Wednesday was better than forecast and Crude Oil inventories on Thursday showed higher demand than expected.
After Treasury Yields dipped on Monday and Tuesday, they turned sharply higher through the rest of the week. The US Dollar also strengthened significantly on Thursday and Friday, with the DXY dollar index climbing +0.84% over the two days. The next Fed meeting comes next week and investors are positioning for the news on bond tapering.
Equities continue to slump as investors focus on specific safe bets and value stocks. The Advance/Decline ratio for the Nasdaq has only been above 1.0 once in the past ten trading days. However, there has not been a rotation into defensive sectors. Utilities declined 3% this week. The past two weeks looks more like a typical September slump than the start of a correction.
The Nasdaq declined -0.47% for the week. Volume was higher than the previous week because of a spike in volume on quadruple-witching Friday. The closing range is 26%, the second week in a row of low closing range.
Small-caps in the Russell 2000 (RUT) outperformed this week, advancing +0.42% and ending the week with a 74% closing range. The Dow Jones Industrial Average (DJI) lost only -0.07% for the week. The S&P 500 (SPX) declined -0.57%.
The VIX volatility index declined -0.67%.
-=x=-=x=-=x=-=x=-=x=-=x=-=x=-
Sectors
Energy ( XLE ) topped the sector list this week after the OPEC Monthly Report on Monday projected that demand for oil would exceed pre-pandemic levels by next year. The sector also got a boost from Crude Oil Inventories data released on Wednesday that showed much higher demand than expected.
Consumer Discretionary ( XLY ) moved into second place after great Retail Sales data on Thursday.
Utilities ( XLU ) and Materials ( XLB ) were the bottom two sectors for the week. Although markets were lower this week, investors did not flee to defensive sectors.
-=x=-=x=-=x=-=x=-=x=-=x=-=x=-
Economic Indicators
The US Dollar (DXY) advanced +0.65% for the week.
US Treasuries 30y yield declined for the week. The 10y and 2y yield both rose. The 2y yield also rose. The 30/5 spread declined for a second week.
High Yield (HYG) and Investment Grade (LQD) Corporate Bond prices advanced for the week.
Silver and Gold fell for another week. Crude Oil rose for the week on a improved outlook from OPEC and better than expected demand in Crude Oil inventories deata.
Timber declined for the week. Copper and Aluminum futures declined this week after big moves last week. Aluminum is still near record highs.
-=x=-=x=-=x=-=x=-=x=-=x=-=x=-
Investor Sentiment
The put/call ratio (PCCE) bounced up and down this week, ending the week at 0.747.
The CNN Fear & Greed Index moved back to Fear and is approaching Extreme Fear.
The NAAIM money manager exposure index rose to 87.02 from 84.68 the previous week.
-=x=-=x=-=x=-=x=-=x=-=x=-=x=-
Big Four
Microsoft (MSFT) had an all-time record close on Thursday before selling off on Friday. The stock is up +1.41% for the week and trading above key moving average lines. Amazon (AMZN) and Alphabet (GOOGL) declined this week but remain above their 10w and 40w moving average lines. Apple (AAPL) moved below its 10w moving average line with a -1.95% decline this week.
-=x=-=x=-=x=-=x=-=x=-=x=-=x=-
Cryptocurrency
Bitcoin (BTCUSD) was the only of the four cryptocurrency to gain for the week, advancing +2.68%. Litecoin (LTCUSD) soared on fake news that Walmart would establish a relationship with the digital currency. The gains were quickly given back after Walmart acknowledges the news was false. The currency ended the week with a -3.94% decline.
-=x=-=x=-=x=-=x=-=x=-=x=-=x=-
The Week Ahead
Monday
There is not much economic news scheduled for Monday. Watch for news on the $3.5 trillion budget that will include a corporate tax hike.
There are no relevant earnings reports for Monday.
Tuesday
Building Permits and Housing Starts data will be available on Tuesday.
Adobe (ADBE), FedEx (FDX) and AutoZone (AZO) are earnings reports to watch out for on Tuesday.
Wednesday
US Existing Home Sales data and Crude Oil Inventories updates come in the morning. The Bank of Japan will make a Monetary Policy Statement overnight.
Nothing is more important this week than the Fed meeting and the statements to be made at 2p on economic projects and interest rate decisions. Investors are looking for statements on when bond tapering will begin.
General Mills will release earnings on Wednesday.
Thursday
Initial Jobless Claims data will be available on Thursday. Manufacturing and Services PMI will give an indication on economic activity.
Nike (NKE), Accenture (CAN), and Costco (COST) will release earnings on Thursday.
Friday
New Home Sales data becomes available after the market opens on Friday morning.
The Fed's Jerome Powell is scheduled to speak at 10a on Friday morning.
Friday's earning reports include Carnival Corp (CCL).
-=x=-=x=-=x=-=x=-=x=-=x=-=x=-
The Bullish Side
Economic data this past week shows that despite a soaring number of COVID cases in the US, the economy continued to march forward. Retail sales data in August was higher than expected, showing positive signs of growth for the US. And the forecast from OPEC is a continuing rise in demand for oil, providing an optimistic outlook for the global economy.
-=x=-=x=-=x=-=x=-=x=-=x=-=x=-
The Bearish Side
Although the data is a positive sign for the economy, the equities markets may react in a very different way. Bond tapering signals and end to easy money policy and the path toward higher interest rates. In addition, investors are bracing for the $3.5 trillion budget passing with an increase in corporate taxes. Despite the potential for growth in the economy, high valuations in the S&P 500 and Nasdaq will need to correct for all these headwinds.
-=x=-=x=-=x=-=x=-=x=-=x=-=x=-
Key Nasdaq Levels to Watch
The Nasdaq closed below its 21d EMA, but found support at 15,000 during several dips. If support at 15,000 is broke, there is another 1% to 2.5% drop before an additional support area created by trading in July and August. It's easier to see on the QQQ chart, with a volume profile.
On the positive side, the levels are:
On the downside, there are a few key levels:
-=x=-=x=-=x=-=x=-=x=-=x=-=x=-
Wrap-up
The September slump continues, but so far the markets are holding up well. The momentum will almost certainly move in one direction or the other after the Wednesday afternoon Fed comments on the economy and interest rate hikes. More important in the immediate future is any decisions they make on bond purchase tapering.
Good luck, stay healthy, and trade safe!
Notes
- The Market Week in Review is my weekend homework where I look over what happened in the previous week and what might come in the next week.
- I occasionally have some errors or typos and will correct them in my blog or the comments on TradingView. I do not have an editor and do this in my free time.
- If you find this helpful, please let me know in the comments. I am also more than happy to add new perspectives and data points if you have ideas.
The structure is the following:
- A recap of the daily updates that I do here on TradingView.
- View on the past week
- What's coming in the next week
- The Bullish View, The Bearish View
- Key index levels to watch out for
- Wrap-up
If you have been following my daily updates, you can skip down to "View on the Week." If not, then this first part is a great play-by-play recap for the week. Click the daily charts for more detail on sectors, indexes, and market leaders each day.
-=x=-=x=-=x=-=x=-=x=-=x=-=x=-
Monday, September 13, 2021

Facts: -0.07%, Volume higher, Closing Range: 40%, Body: 57% Red
Good: Closed above the 21d EMA
Bad: Two dips below 21d EMA, couldn't hold intraday high at open
Highs/Lows: Lower high, Lower low
Candle: Red body in upper half of candle with a long lower wick
Advance/Decline: 0.73, more declining than advancing
Indexes: SPX (+0.23%), DJI (+0.76%), RUT (+0.59%), VIX (-7.54%)
Sector List: Energy (XLE +2.87%) and Financials (XLF +1.14%) at the top. Utilities (XLU -0.18%) and Health (XLV -0.62%) at the bottom.
Expectation: Sideways or Lower
The OPEC Monthly Report provided a positive outlook for the economy, stating that oil demand would exceed pre-pandemic levels next year. That sent oil futures and the Energy sector higher and turned investors more optimistic on value stocks and the re-opening trade.
The Nasdaq closed the day with a -0.07% decline. Volume was higher than the previous day. The index started with a gain but quickly sold as investors rotated out of growth stocks and back into value stocks. The Nasdaq dipped below its 21d exponential moving average twice but was able to close above the line. The closing range of 40% is under a red body that covers more than half of the candle. There is a long lower wick with a tiny upper wick. More stocks declined than advanced on the Nasdaq. Notably, there were two advancing stocks for every declining stock on the New York Stock Exchange.
-=x=-=x=-=x=-=x=-=x=-=x=-=x=-
Tuesday, September 14, 2021

Facts: -0.45%, Volume lower, Closing Range: 17%, Body: 76% Red
Good: Support above 15,000
Bad: Mostly red body, lower high, lower low. a/d ratio
Highs/Lows: Lower high, Lower low
Candle: Mostly red body with small upper and lower wicks
Advance/Decline: 0.28, more than three declining stocks for every advancing stock
Indexes: SPX (-0.57%), DJI (-0.84%), RUT (-1.37%), VIX (+0.46%)
Sector List: Health (XLV -0.02%) and Technology (XLK -0.13%) at the top. Financials (XLF -1.34%) and Energy (XLE -1.44%) at the bottom.
Expectation: Lower
US Treasury Yields slid after the morning's consumer price index data added more confusion to the economic picture. Is lower than expected inflation a good thing or a bad thing? What does it mean for Fed monetary policy? The unanswered questions equate to risk for investors, sending them to safer bets.
The Nasdaq closed with a -0.45% decline. Volume was lower than the previous day. The 76% red body represents a bearish day ending with the closing range of 17%. There were more than three declining stocks for every advancing stock.
-=x=-=x=-=x=-=x=-=x=-=x=-=x=-
Wednesday, September 15, 2021

Facts: +0.82%, Volume lower, Closing Range: 93%, Body: 48% Green
Good: Support at 15,000 sent started a rally into afternoon
Bad: Could not break above yesterday's high
Highs/Lows: Lower high, Lower low
Candle: Long lower wick formed from morning sell, green upper body
Advance/Decline: 1.31, more advancing than declining stocks
Indexes: SPX (+0.85%), DJI (+0.68%), RUT (+1.11%), VIX (-6.58%)
Sector List: Energy (XLE +3.74%) and Industrials (XLI +1.10%) at the top. Consumer Staples (XLP +0.36%) and Utilities (XLU -0.13%) at the bottom.
Expectation: Sideways or Higher
Stocks rose on Wednesday after Crude Oil supplies signaled much higher demand than expected. That boosted the Energy sector by more than 3.5%, and the improved optimism drove broad gains across the market.
The Nasdaq gained +0.82% for the day after getting support at 15,000 in the morning. The 48% green body led to a 93% closing range. Volume was lower than the previous day, and there were more advancing stocks than declining stocks. The index could not break yesterday's high, so it is still in a downtrend, but the long lower wick formed from the bounce off 15,000 led to a rally in that afternoon that has potential.
-=x=-=x=-=x=-=x=-=x=-=x=-=x=-
Thursday, September 16, 2021
Facts: +0.13%, Volume lower, Closing Range: 85%, Body: 39% Green
Good: Higher high, good closing range
Bad: Dip below 21d EMA, low A/D ratio
Highs/Lows: Higher high, Higher low
Candle: Short body in upper half of candle, long lower wick
Advance/Decline: 0.81, more declining than advancing stocks
Indexes: SPX (-0.16%), DJI (-0.18%), RUT (-0.07%), VIX (+2.81%)
Sector List: Consumer Discretionary (XLY +0.46%) and Real Estate (XLRE +0.19%) at the top. Materials (XLB -1.08%) and Energy (XLE -1.13%) at the bottom.
Expectation: Sideways
Better than expected Retail Sales data help the Consumer Discretionary sector advance to the top of the sector list. However, rising Treasury Yields subdued other sectors and sent three of the four major indexes to losses for the day.
The Nasdaq closed the day with a +0.13% gain after dipping in the morning. The 39% green body is in the upper half of the candle, with a long lower wick representing the morning decline. After hitting the intraday low, the index rose through the afternoon to end with an 85% closing range. Volume was lower than the previous day, and there were more declining stocks than advancing stocks.
-=x=-=x=-=x=-=x=-=x=-=x=-=x=-
Friday, September 17, 2021
Facts: -0.91%, Volume higher, Closing Range: 27%, Body: 71% Red
Good: Support at 15,000
Bad: Close below 21d EMA, lower high
Highs/Lows: Lower high, Lower low
Candle: Mostly red body with a small lower wick
Advance/Decline: 0.82, more declining stocks than advancing stocks
Indexes: SPX (-0.91%), DJI (-0.48%), RUT (+0.18%), VIX (+11.34%)
Sector List: Health (XLV +0.10%) and Consumer Discretionary (XLY -0.35%) at the top. Technology (XLK -1.56%) and Materials (XLB -2.06%) at the bottom.
Expectation: Sideways or Lower
Indexes closed lower while volume soared on quadruple-witching Friday. Only the Russell 2000 was able to end the day with gains.
The Nasdaq moved back below its 21d EMA with a -0.91% decline today. Volume was more than 50% over average daily volume due to index and stock options expiration. The candle is primarily red body with a small lower wick. The closing range of 27% came after a rally before close. There were more declining stocks than advancing stocks.
-=x=-=x=-=x=-=x=-=x=-=x=-=x=-
View on the Week
Positive economic news couldn't break through the September blues, making for a choppy week in the markets. Investors are balancing good economic data with the possibility that Fed may start bond tapering soon.
The week opened with the OPEC monthly report stating that oil demand will meet or exceed pre-pandemic levels by next year. That was a more robust outlook for oil and translates to a better global economic outlook. The new optimism focused investors on value and reopening stocks.
As the week progressed, however, the better economic data for the US raised expectations that the Fed would begin tapering bond purchasing soon. While inflation data on Tuesday was slightly below forecasts, it was still high. Retail sales data on Wednesday was better than forecast and Crude Oil inventories on Thursday showed higher demand than expected.
After Treasury Yields dipped on Monday and Tuesday, they turned sharply higher through the rest of the week. The US Dollar also strengthened significantly on Thursday and Friday, with the DXY dollar index climbing +0.84% over the two days. The next Fed meeting comes next week and investors are positioning for the news on bond tapering.
Equities continue to slump as investors focus on specific safe bets and value stocks. The Advance/Decline ratio for the Nasdaq has only been above 1.0 once in the past ten trading days. However, there has not been a rotation into defensive sectors. Utilities declined 3% this week. The past two weeks looks more like a typical September slump than the start of a correction.
The Nasdaq declined -0.47% for the week. Volume was higher than the previous week because of a spike in volume on quadruple-witching Friday. The closing range is 26%, the second week in a row of low closing range.
Small-caps in the Russell 2000 (RUT) outperformed this week, advancing +0.42% and ending the week with a 74% closing range. The Dow Jones Industrial Average (DJI) lost only -0.07% for the week. The S&P 500 (SPX) declined -0.57%.
The VIX volatility index declined -0.67%.
-=x=-=x=-=x=-=x=-=x=-=x=-=x=-
Sectors

Energy ( XLE ) topped the sector list this week after the OPEC Monthly Report on Monday projected that demand for oil would exceed pre-pandemic levels by next year. The sector also got a boost from Crude Oil Inventories data released on Wednesday that showed much higher demand than expected.
Consumer Discretionary ( XLY ) moved into second place after great Retail Sales data on Thursday.
Utilities ( XLU ) and Materials ( XLB ) were the bottom two sectors for the week. Although markets were lower this week, investors did not flee to defensive sectors.
-=x=-=x=-=x=-=x=-=x=-=x=-=x=-
Economic Indicators
The US Dollar (DXY) advanced +0.65% for the week.
US Treasuries 30y yield declined for the week. The 10y and 2y yield both rose. The 2y yield also rose. The 30/5 spread declined for a second week.
High Yield (HYG) and Investment Grade (LQD) Corporate Bond prices advanced for the week.
Silver and Gold fell for another week. Crude Oil rose for the week on a improved outlook from OPEC and better than expected demand in Crude Oil inventories deata.
Timber declined for the week. Copper and Aluminum futures declined this week after big moves last week. Aluminum is still near record highs.
-=x=-=x=-=x=-=x=-=x=-=x=-=x=-
Investor Sentiment
The put/call ratio (PCCE) bounced up and down this week, ending the week at 0.747.
The CNN Fear & Greed Index moved back to Fear and is approaching Extreme Fear.
The NAAIM money manager exposure index rose to 87.02 from 84.68 the previous week.
-=x=-=x=-=x=-=x=-=x=-=x=-=x=-
Big Four
Microsoft (MSFT) had an all-time record close on Thursday before selling off on Friday. The stock is up +1.41% for the week and trading above key moving average lines. Amazon (AMZN) and Alphabet (GOOGL) declined this week but remain above their 10w and 40w moving average lines. Apple (AAPL) moved below its 10w moving average line with a -1.95% decline this week.
-=x=-=x=-=x=-=x=-=x=-=x=-=x=-
Cryptocurrency
Bitcoin (BTCUSD) was the only of the four cryptocurrency to gain for the week, advancing +2.68%. Litecoin (LTCUSD) soared on fake news that Walmart would establish a relationship with the digital currency. The gains were quickly given back after Walmart acknowledges the news was false. The currency ended the week with a -3.94% decline.
-=x=-=x=-=x=-=x=-=x=-=x=-=x=-
The Week Ahead
Monday
There is not much economic news scheduled for Monday. Watch for news on the $3.5 trillion budget that will include a corporate tax hike.
There are no relevant earnings reports for Monday.
Tuesday
Building Permits and Housing Starts data will be available on Tuesday.
Adobe (ADBE), FedEx (FDX) and AutoZone (AZO) are earnings reports to watch out for on Tuesday.
Wednesday
US Existing Home Sales data and Crude Oil Inventories updates come in the morning. The Bank of Japan will make a Monetary Policy Statement overnight.
Nothing is more important this week than the Fed meeting and the statements to be made at 2p on economic projects and interest rate decisions. Investors are looking for statements on when bond tapering will begin.
General Mills will release earnings on Wednesday.
Thursday
Initial Jobless Claims data will be available on Thursday. Manufacturing and Services PMI will give an indication on economic activity.
Nike (NKE), Accenture (CAN), and Costco (COST) will release earnings on Thursday.
Friday
New Home Sales data becomes available after the market opens on Friday morning.
The Fed's Jerome Powell is scheduled to speak at 10a on Friday morning.
Friday's earning reports include Carnival Corp (CCL).
-=x=-=x=-=x=-=x=-=x=-=x=-=x=-
The Bullish Side
Economic data this past week shows that despite a soaring number of COVID cases in the US, the economy continued to march forward. Retail sales data in August was higher than expected, showing positive signs of growth for the US. And the forecast from OPEC is a continuing rise in demand for oil, providing an optimistic outlook for the global economy.
-=x=-=x=-=x=-=x=-=x=-=x=-=x=-
The Bearish Side
Although the data is a positive sign for the economy, the equities markets may react in a very different way. Bond tapering signals and end to easy money policy and the path toward higher interest rates. In addition, investors are bracing for the $3.5 trillion budget passing with an increase in corporate taxes. Despite the potential for growth in the economy, high valuations in the S&P 500 and Nasdaq will need to correct for all these headwinds.
-=x=-=x=-=x=-=x=-=x=-=x=-=x=-
Key Nasdaq Levels to Watch
The Nasdaq closed below its 21d EMA, but found support at 15,000 during several dips. If support at 15,000 is broke, there is another 1% to 2.5% drop before an additional support area created by trading in July and August. It's easier to see on the QQQ chart, with a volume profile.
On the positive side, the levels are:
- The 10d moving average is at 15,191.90.
- This week's high is at 15,215.44.
- The all-time high is at 15,403.44.
- The index met several days of resistance around 15,400.
- 15,500 may be the next area of resistance.
On the downside, there are a few key levels:
- The 21d EMA is at 15,090.88.
- 15,000 is an area of support, tested several times this week.
- The low of the week is 14,984.68, just below Friday's close.
- The 50d MA is at 14,875.47.
- 14,423.16 is the low of the most recent pullback.
- 14,200 remains a critical level if the index moves downward.
- 14,000 has been an area of support/resistance.
- There is a pivot at 13,903.73.
- A further pullback would likely hit the 200d moving average at 13,844.89. The index hasn't approached this line since rising above it in April 2020.
-=x=-=x=-=x=-=x=-=x=-=x=-=x=-
Wrap-up
The September slump continues, but so far the markets are holding up well. The momentum will almost certainly move in one direction or the other after the Wednesday afternoon Fed comments on the economy and interest rate hikes. More important in the immediate future is any decisions they make on bond purchase tapering.
Good luck, stay healthy, and trade safe!