Summary: This week ended much better than it began. All indications at the market open on Monday were that we were going to have a bearish week. The CNN Fear & Greed indicator was in the Extreme Fear range, and the put/call ratio was nearing 0.9. Worries about the new delta strain putting new pressures on the economic recovery sent investors into defensive sectors.
Notes
The structure is the following:
If you have been following my daily updates, you can skip down to "View on the Week." If not, then this first part is a great play-by-play recap for the week. Click the daily charts for more detail on sectors, indexes, and market leaders each day.
-=x=-=x=-=x=-=x=-=x=-=x=-=x=-
Monday, July 19, 2021

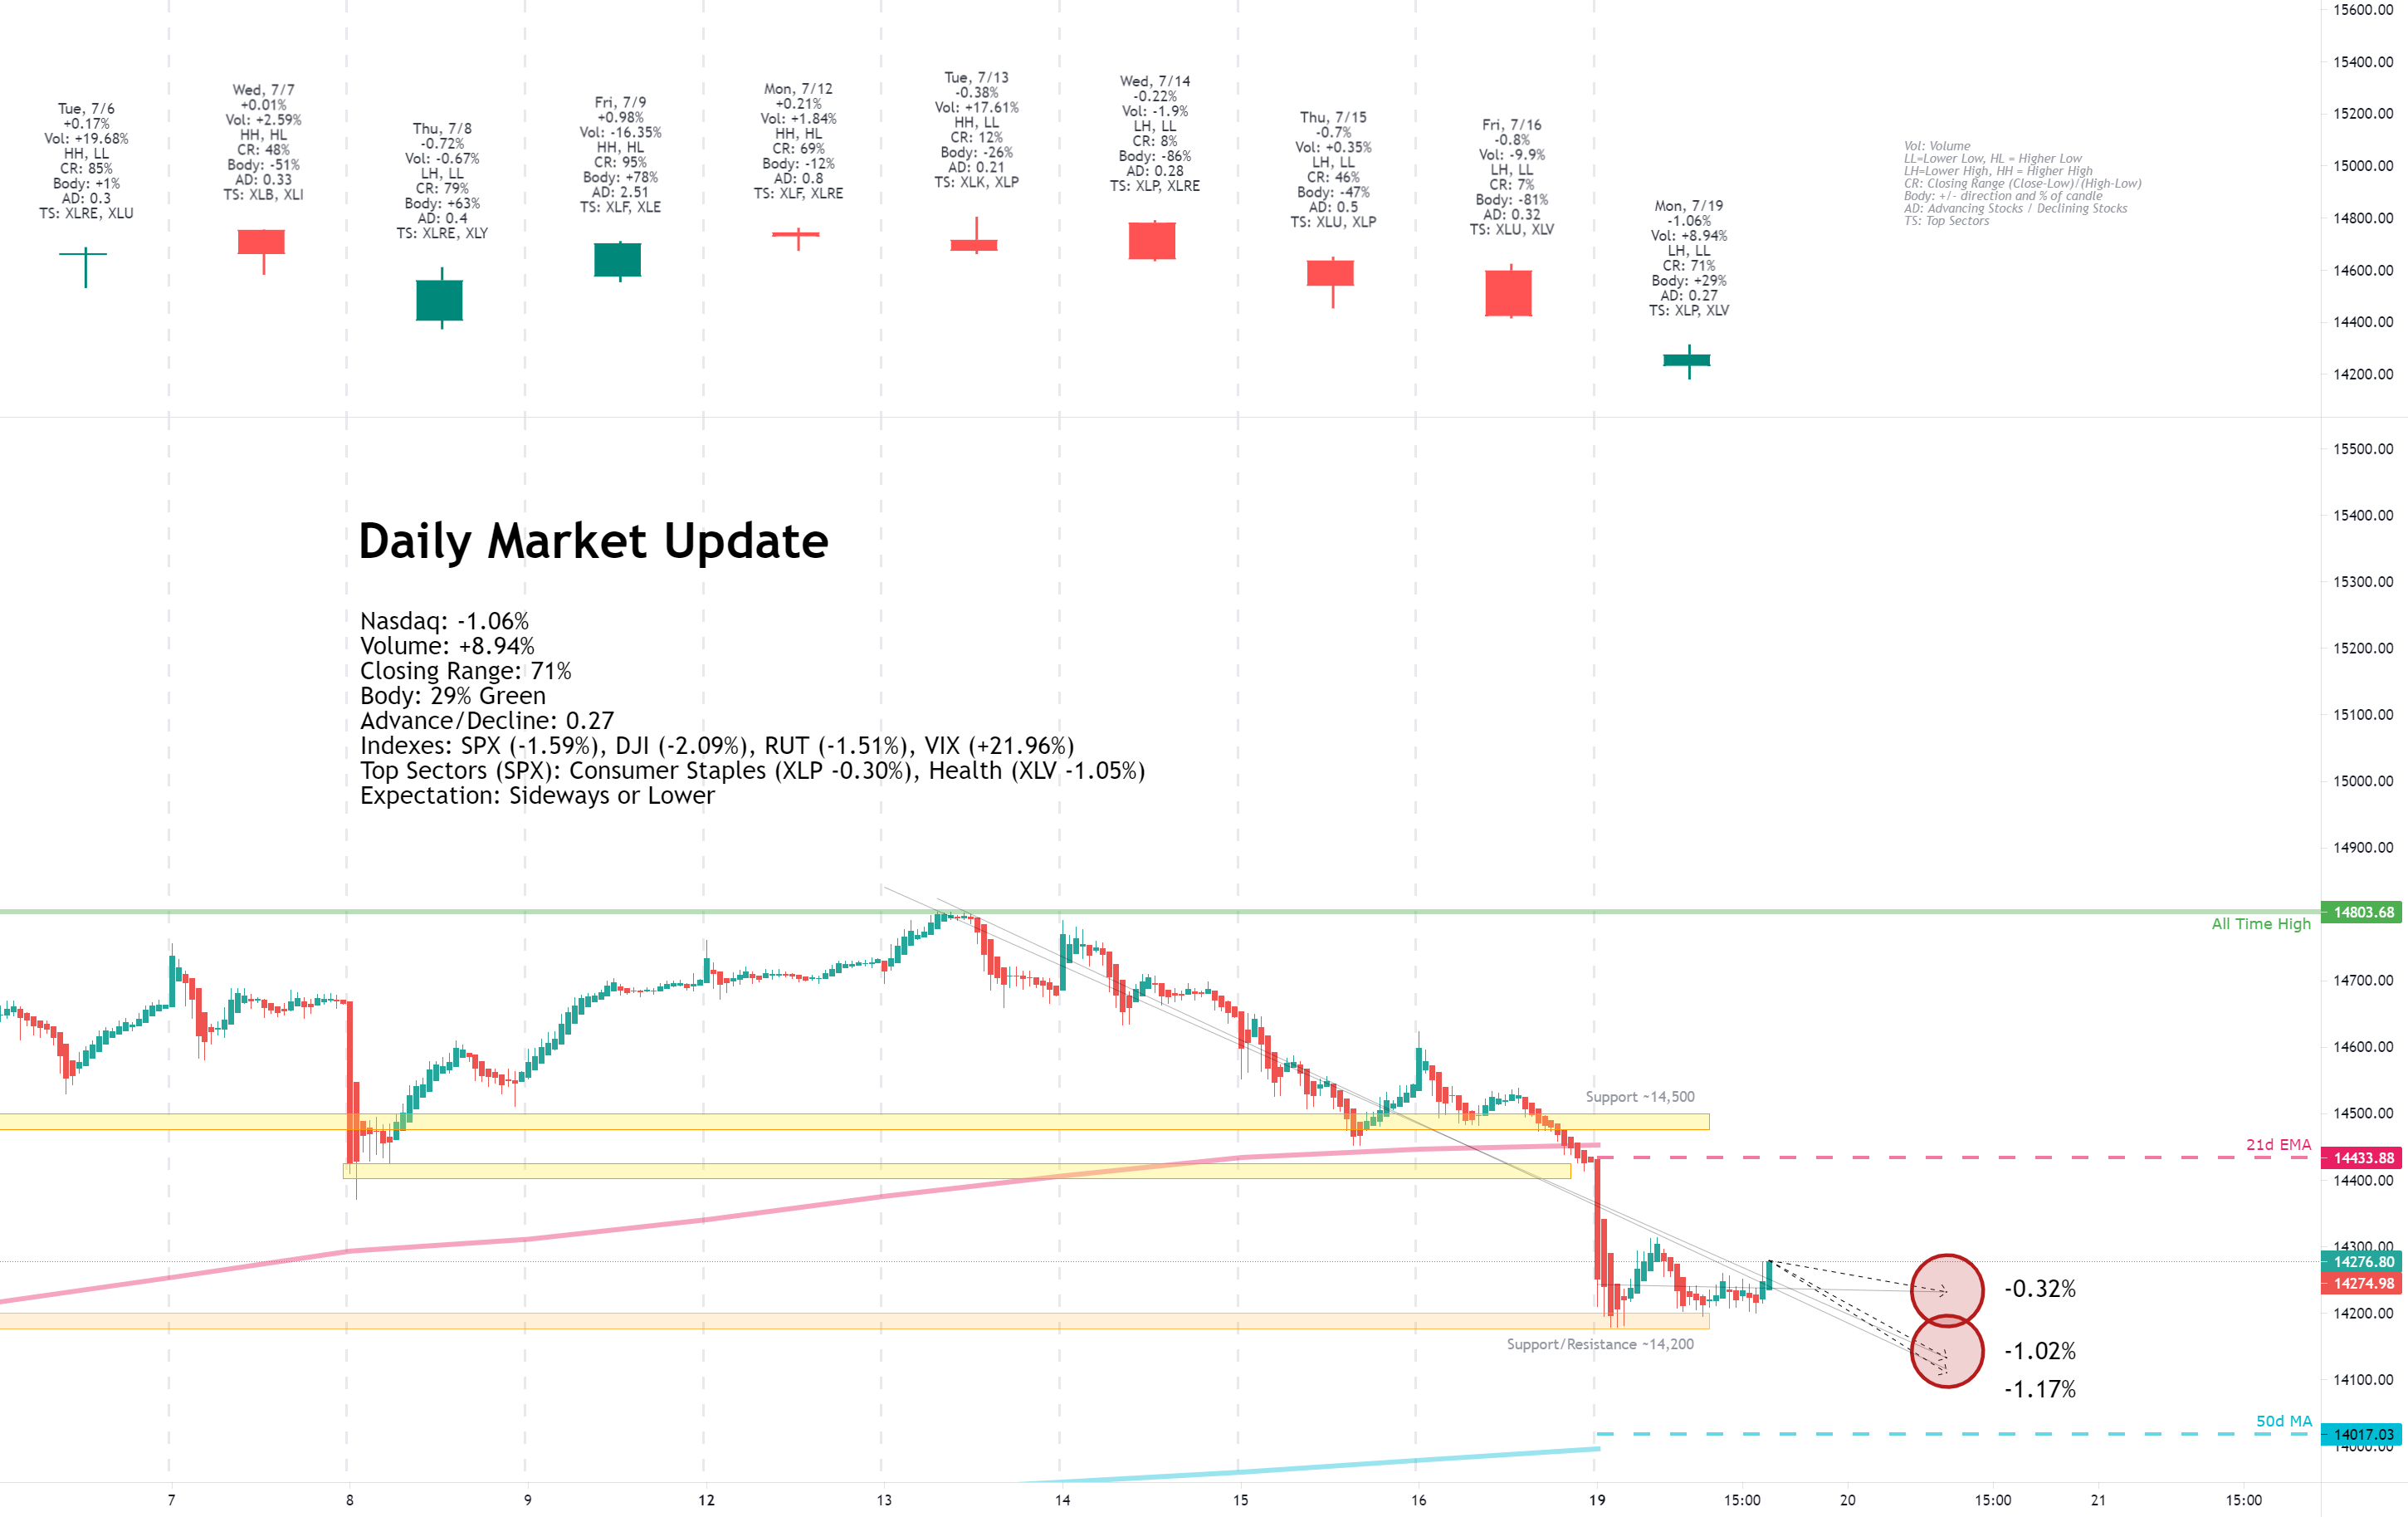
Facts: -1.06%, Volume higher, Closing range: 71%, Body: 29%
Good: Support around 14,200, good closing range
Bad: Lower on higher volume, lower high, lower low
Highs/Lows: Lower high, lower low
Candle: Green body in center of candle, even upper and lower wicks
Advanced/Decline: 0.27, more than three declining stocks for every advancing stock
Indexes: SPX (-1.59%), DJI (-2.09%), RUT (-1.51%), VIX (+21.96%)
Sectors: Consumer Staples (XLP -0.30%) and Health (XLV -1.05%) at the top. Financials (XLF -2.80%) and Energy (XLE -3.53%) were bottom.
Expectation: Sideways or Lower
The new Delta variant of the Coronavirus was top of mind for investors as the trading week began. Share prices of COVID vaccine-related companies soared today as it appeared governments would need to double down on vaccination efforts.
The Nasdaq finished with a -1.06% loss for the day on higher volume. The index found support at the 14,200 level, closing with a 71% closing range above a 29% body that is right in the middle of the candle. The lower high and lower low continues a downtrend as more than three stocks declined for every stock that advanced today.
-=x=-=x=-=x=-=x=-=x=-=x=-=x=-
Tuesday, July 20, 2021
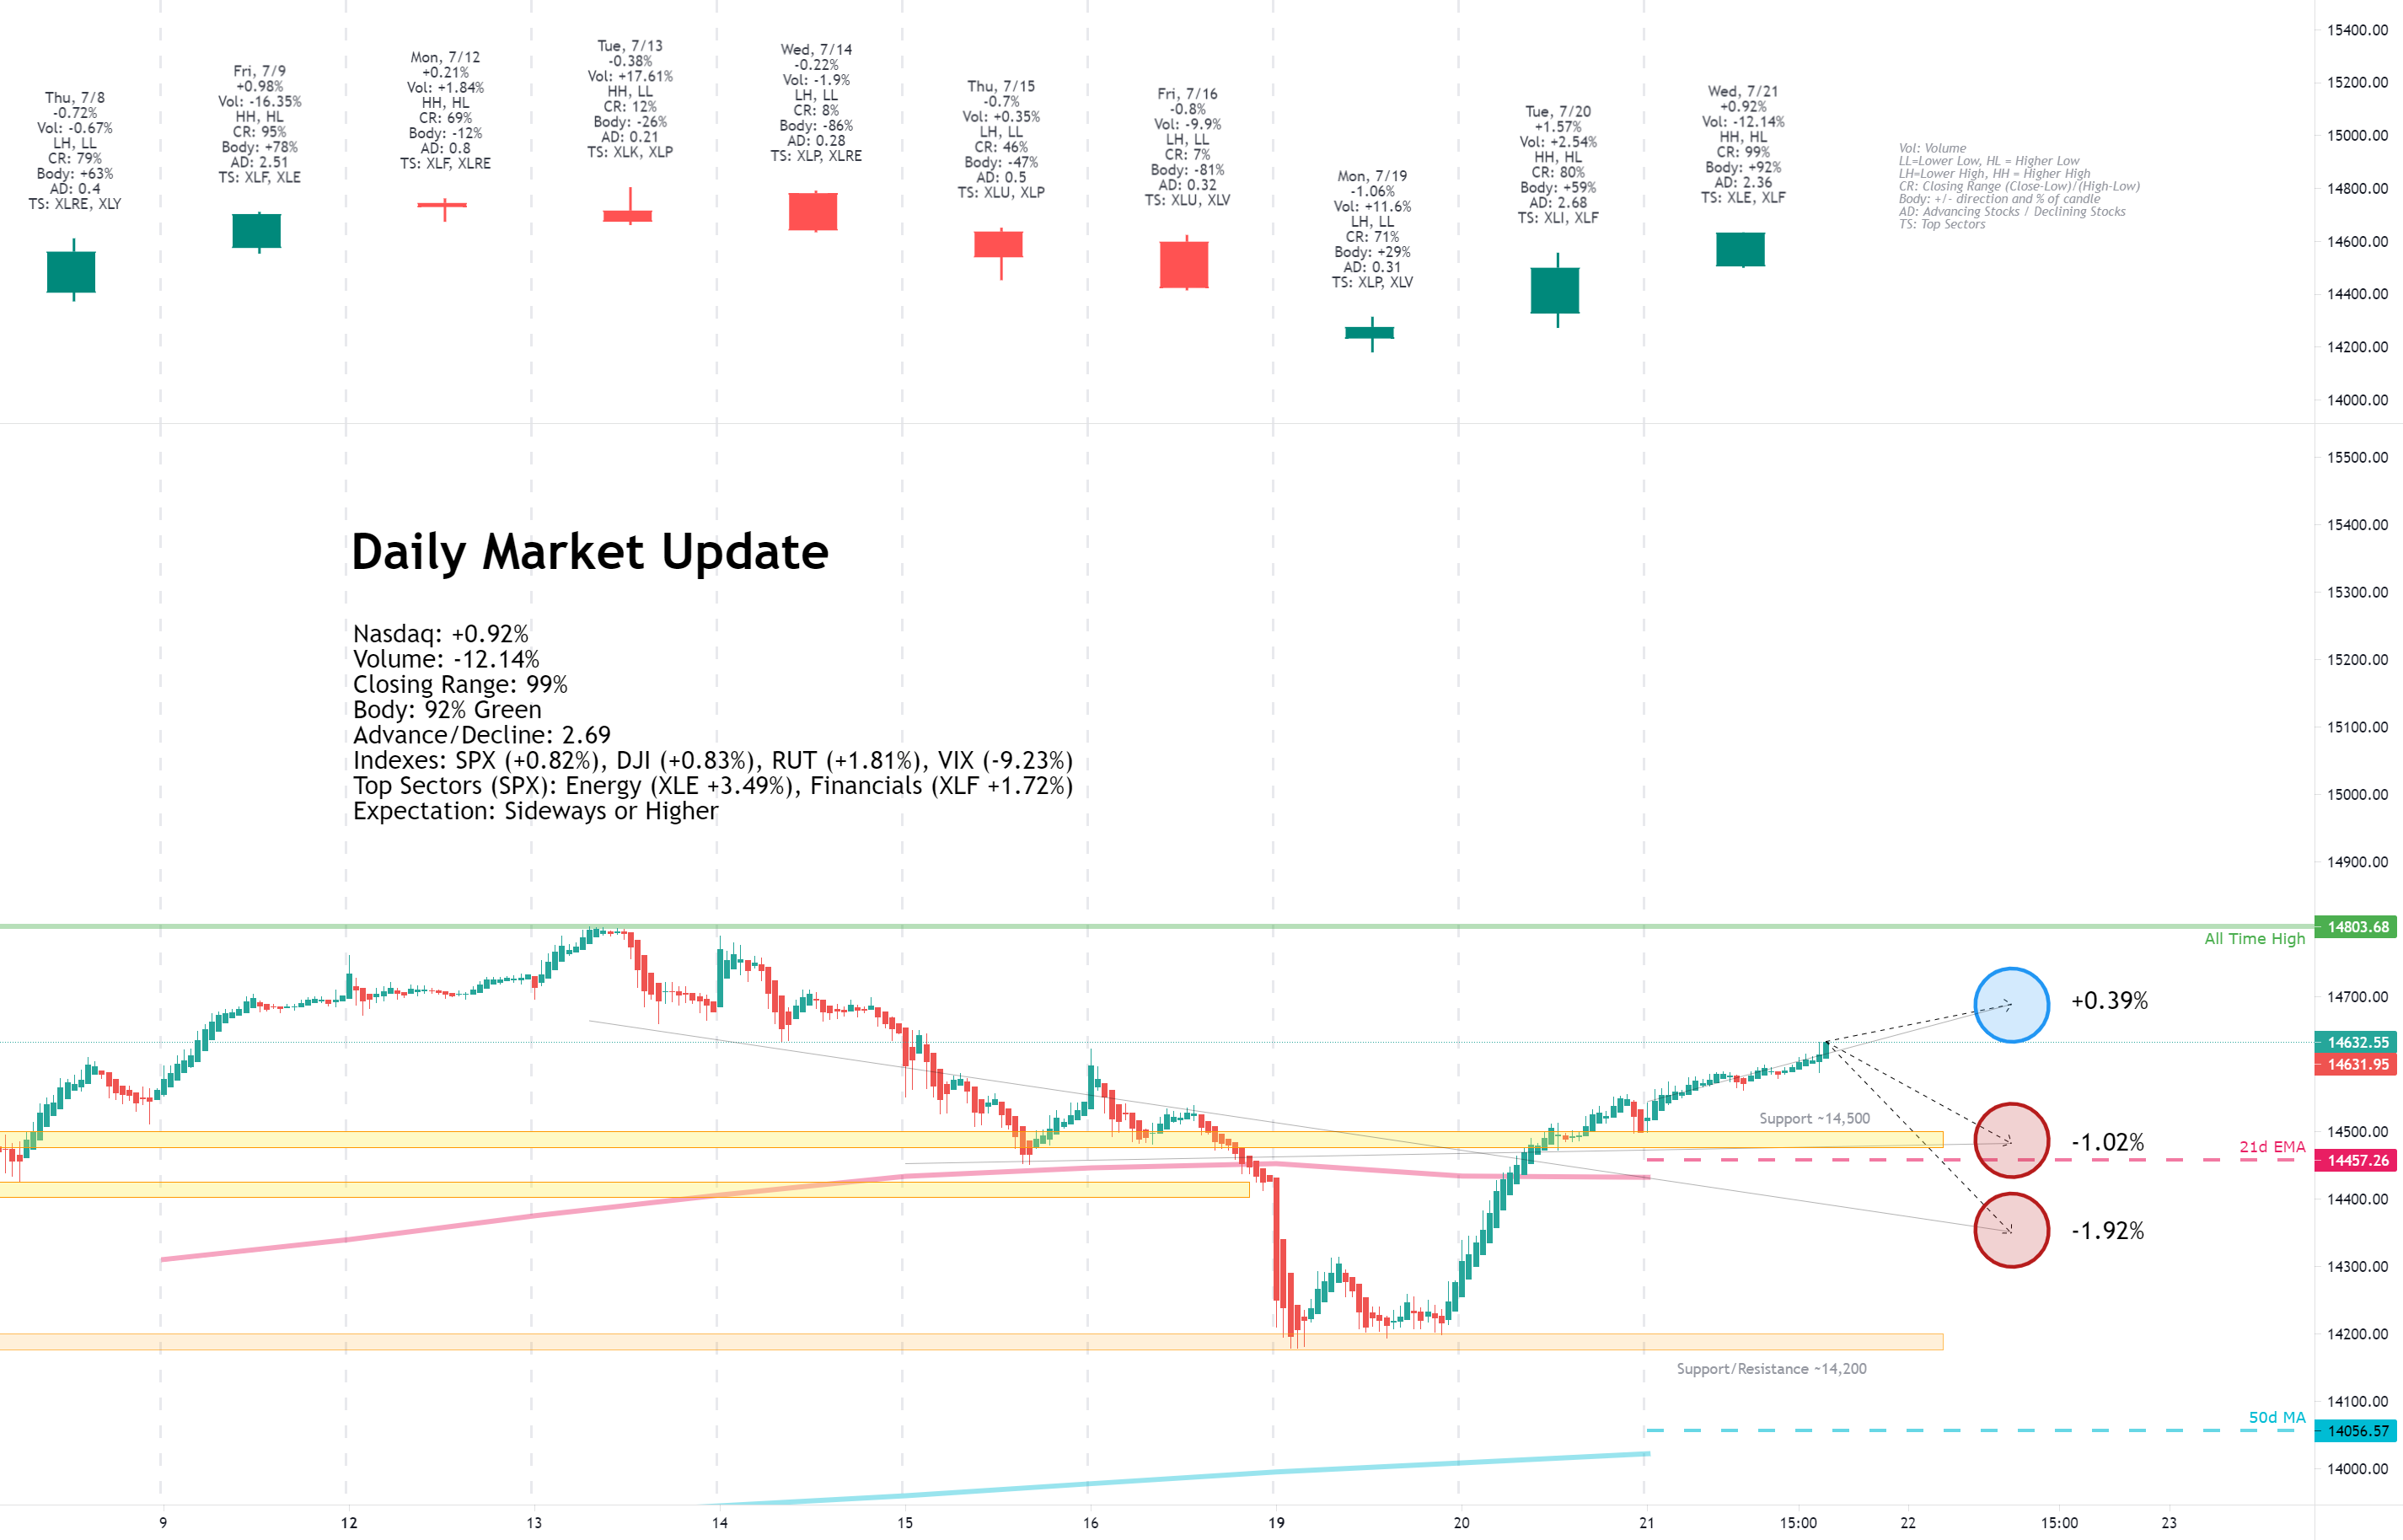
Facts: +1.57%, Volume higher, Closing range: 80%, Body: 59%
Good: Broad gains on higher volume to move back above 21d EMA
Bad: Nothing
Highs/Lows: Higher high, higher low
Candle: Bullish green body with higher low and higher high, medium size upper and lower wicks
Advanced/Decline: 2.69, more than five advancing stocks for every two declining stocks
Indexes: SPX (+1.52%), DJI (+1.62%), RUT (+2.99%), VIX (-12.32%)
Sectors: Industrials (XLI +2.80%) and Financials (XLF +2.48%) at the top. Utilities (XLU +0.43%) and Consumer Staples (XLP +0.03%) were bottom.
Expectation: Sideways or Higher
Small caps ended several days of losing to lead stocks higher today as investors snapped out of the pandemic fears that caused Monday's selling. Investors are warming back up to small caps as the US Dollar strengthens and yields in bonds are beginning to stabilize.
The Nasdaq finished with a +1.57% gain on higher volume than the previous day. The 59% green body and 80% closing range represent a day of constant buying that ended with some profit-taking in the last few minutes before the market close. The index closed yesterday's gap down and regained the 21d exponential moving average, closing at the 14,500 support area. There were more than five advancing stocks for every declining stock.
-=x=-=x=-=x=-=x=-=x=-=x=-=x=-
Wednesday, July 21, 2021
Facts: +0.92%, Volume lower, Closing range: 99%, Body: 92%
Good: Close at high of day, bullish green body, A/D ratio
Bad: Nothing
Highs/Lows: Higher high, higher low
Candle: No upper wick, very tiny lower wick, mostly green body
Advanced/Decline: 2.36, almost five advancing stocks for every two declining stocks
Indexes: SPX (+0.82%), DJI (+0.83%), RUT (+1.81%), VIX (-9.23%)
Sectors: Energy (XLE +3.49%) and Financials (XLF +1.72%) at the top. Real Estate (XLRE -0.30%) and Utilities (XLU -1.10%). were bottom.
Expectation: Sideways or Higher
Stocks continued to rebound from last week's dip, with small caps leading the march upward, keeping the advance/decline ratio above 2.0 for a second day. Investors are looking more optimistic about the economic recovery among solid earnings reports from market leaders.
The Nasdaq closed the day a +0.92%. Volume was lower, but buyers dominated the entire, with almost five advancing stocks for every declining stock. The candle has no upper wick because of the 99% closing range, and the green body covers 92% of the candle.
-=x=-=x=-=x=-=x=-=x=-=x=-=x=-
Thursday, July 22, 2021
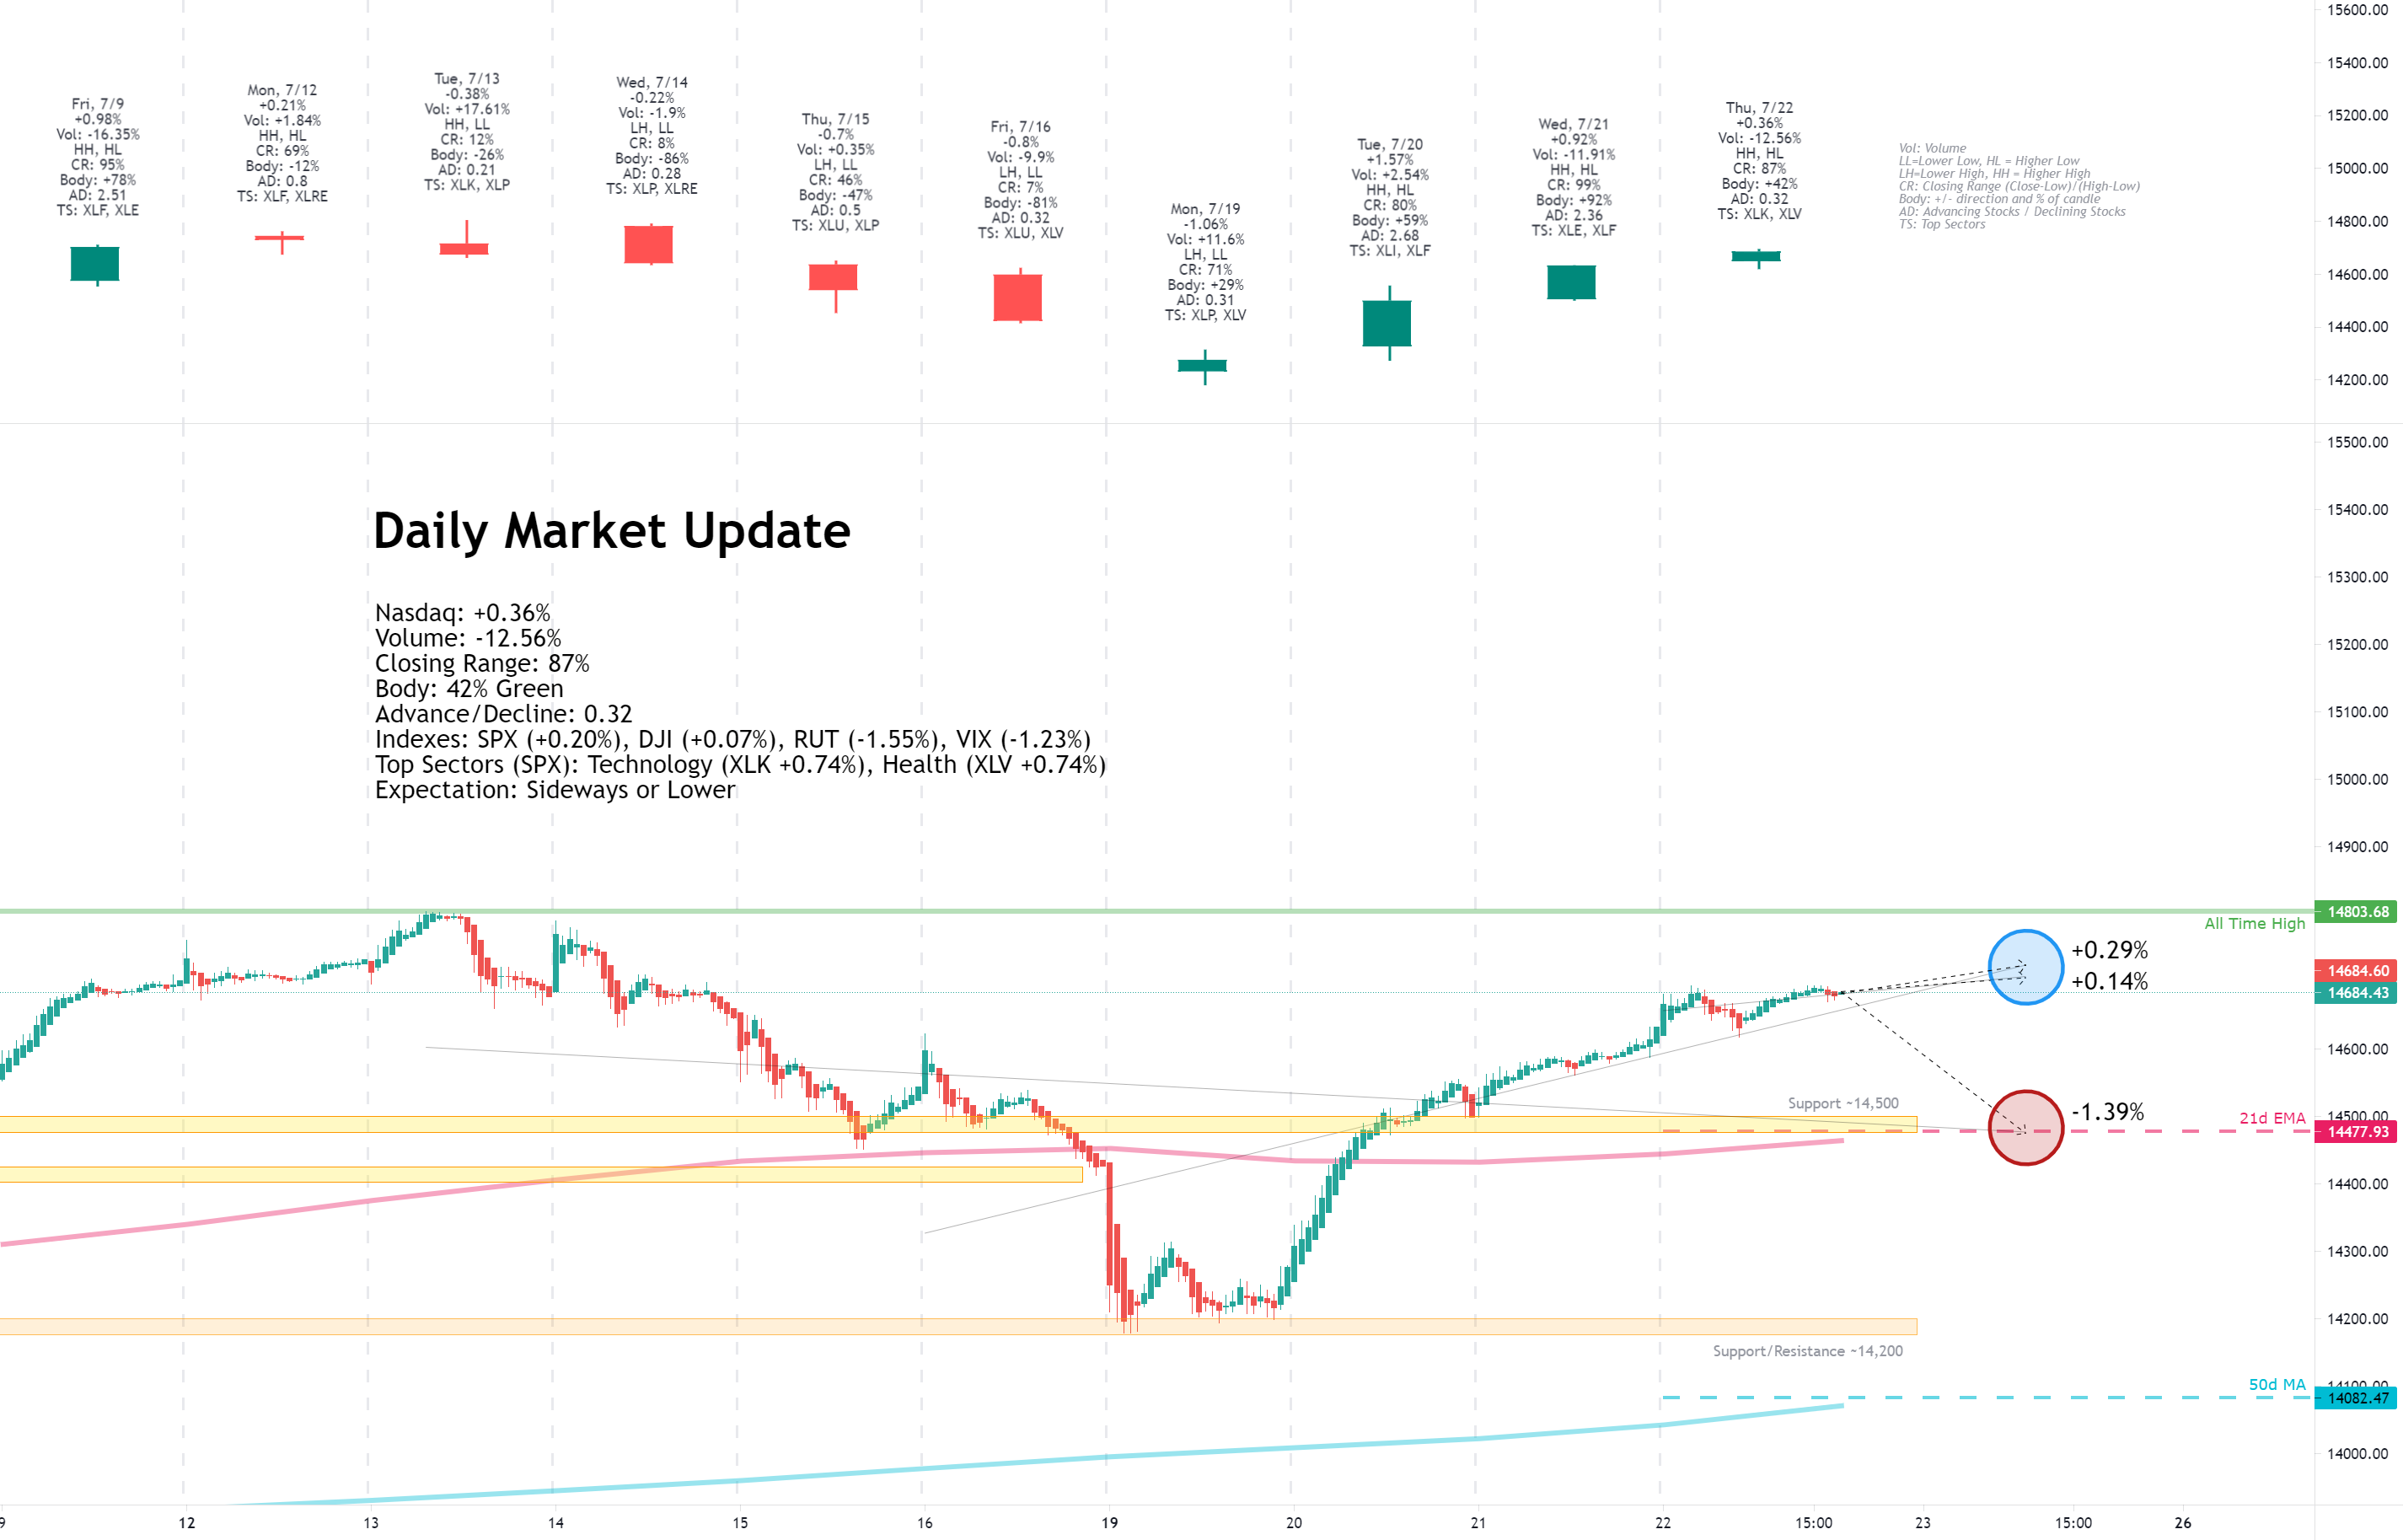
Facts: +0.36%, Volume lower, Closing range: 87%, Body: 42%
Good: High closing range with higher high and higher low
Bad: Low volume, low A/D ratio
Highs/Lows: Higher high, higher low
Candle: Longer lower wick, a medium size green body in upper half
Advanced/Decline: 0.32, three declining stocks for every advancing stock
Indexes: SPX (+0.20%), DJI (+0.07%), RUT (-1.55%), VIX (-1.23%)
Sectors: Technology (XLK +0.74%) and Health (XLV +0.74%) at the top. Financials (XLF -1.09%) and Energy (XLE -1.12%) were bottom.
Expectation: Sideways or Lower
Rising jobless claims surprised the market this morning, sending cyclical sectors lower and causing a reversal in small caps after several days of gains. Investors rotated back into growth stocks and big tech, which are more resilient to the swings in the economy.
The Nasdaq finished the day with a +0.36% on lower volume than the previous day. The day ended with an 87% closing range for the index. A 45% body sits in the upper half of the candle, above a long lower wick formed in the morning as investors absorbed the economic news.
-=x=-=x=-=x=-=x=-=x=-=x=-=x=-
Friday, July 23, 2021
Facts: +1.04%, Volume higher, Closing range: 94%, Body: 57%
Good: High closing range on higher volume
Bad: A/D still below 1.0
Highs/Lows: Higher high, higher low
Candle: Gap up at open after several green days, mostly green body in upper half of candle
Advanced/Decline: 0.69, About three declining stocks for every two advancing
Indexes: SPX (+1.01%), DJI (+0.68%), RUT (+0.46%), VIX (-2.77%)
Sectors: Communications (XLC +2.48%) and Utilities (XLU +1.28%) at the top. Financials (XLF +0.17%) and Energy (XLE -0.37%) were bottom.
Expectation: Sideways or Higher
A rally in Social media stocks helped send the major indexes to new all-time highs. The optimism spread to other big tech stocks, giving the Nasdaq a high volume advance but leaving the advance/decline ratio below 1.0.
The Nasdaq finished with a +1.04% gain on higher volume to reach a new record close. The green candle caps a week of all green candles compared to the previous week's all red candles. Today's candle had a 57% green body in the upper half of the candle. The 94% closing range represents a day of bullish buying after a quick dip in the morning created the lower wick. There were almost three declining stocks for every two advancing stocks.
-=x=-=x=-=x=-=x=-=x=-=x=-=x=-
View on the Week
This week ended much better than it began. All indications at the market open on Monday were that we were going to have a bearish week. The CNN Fear & Greed indicator was in the Extreme Fear range, and the put/call ratio was nearing 0.9. Worries about the new delta strain putting new pressures on the economic recovery sent investors into defensive sectors.
The Nasdaq gapped down at open on Monday and continued to drop until it reached the 14,200 level. The index found support at that level and reversed. The upside reversal didn't end until a new all-time high was reached on Friday.
The 14,200 support area formed from the February and April highs. It became resistance in June before the index moved higher. On Monday, the index tested the level several times, and the support was held. This will be a critical area to watch if another pullback occurs in the coming weeks.
After the index found support, it just took a few pieces of good news to get the rally back on track. That news came in a few forms.
First, earnings reports were largely positive this week. IBM, Johnson & Johnson, Coca-Cola, and Intel all had great earnings reports. But the biggest surprise of the week was SNAP, which beat estimates and doubled revenue from a year earlier on robust advertising income. That was enough to send the entire Communications sector higher.
Another boost to big tech came in analyst upgrades for Nvidia and Microsoft. Analysts improved their price targets for the two companies ahead of earnings.
Finally, OPEC helped a bit by deciding to increase production to meet a forecast of higher demand. That's a great indicator of confidence in the continuing economic recovery. The news sent the Energy sector higher on Wednesday.
Small caps in the Russell 2000 outperformed on Tuesday and Wednesday. The segment sold off the last three weeks, causing valuations to be lower than the larger cap segments. With the low valuations combined with a strengthening USD and continuing low Treasury yields, it was a perfect context for small caps to get an influx of investment.
Chinese stocks such as Alibaba, JD.com, UP Fintech, and FUTU Holdings were beaten down this week on fears that the Chinese government will crack down on companies listed in foreign exchanges.
The Nasdaq advanced +2.84% for the week, recovering all of the previous week's loss and closing at an all-time high. Volume was lower than the previous week. The lower low and higher high for the week create an outside bullish candle with a 99% closing range.
Along with the Nasdaq, the S&P 500 (SPX) and Dow Jones Industrial Average (DJI) closed the week at all-time highs, advancing +1.96% and +1.08%. The Russell 2000 (RUT) had its first weekly gain in four weeks, rising +2.15%.
The VIX volatility declined -6.78% for the week.
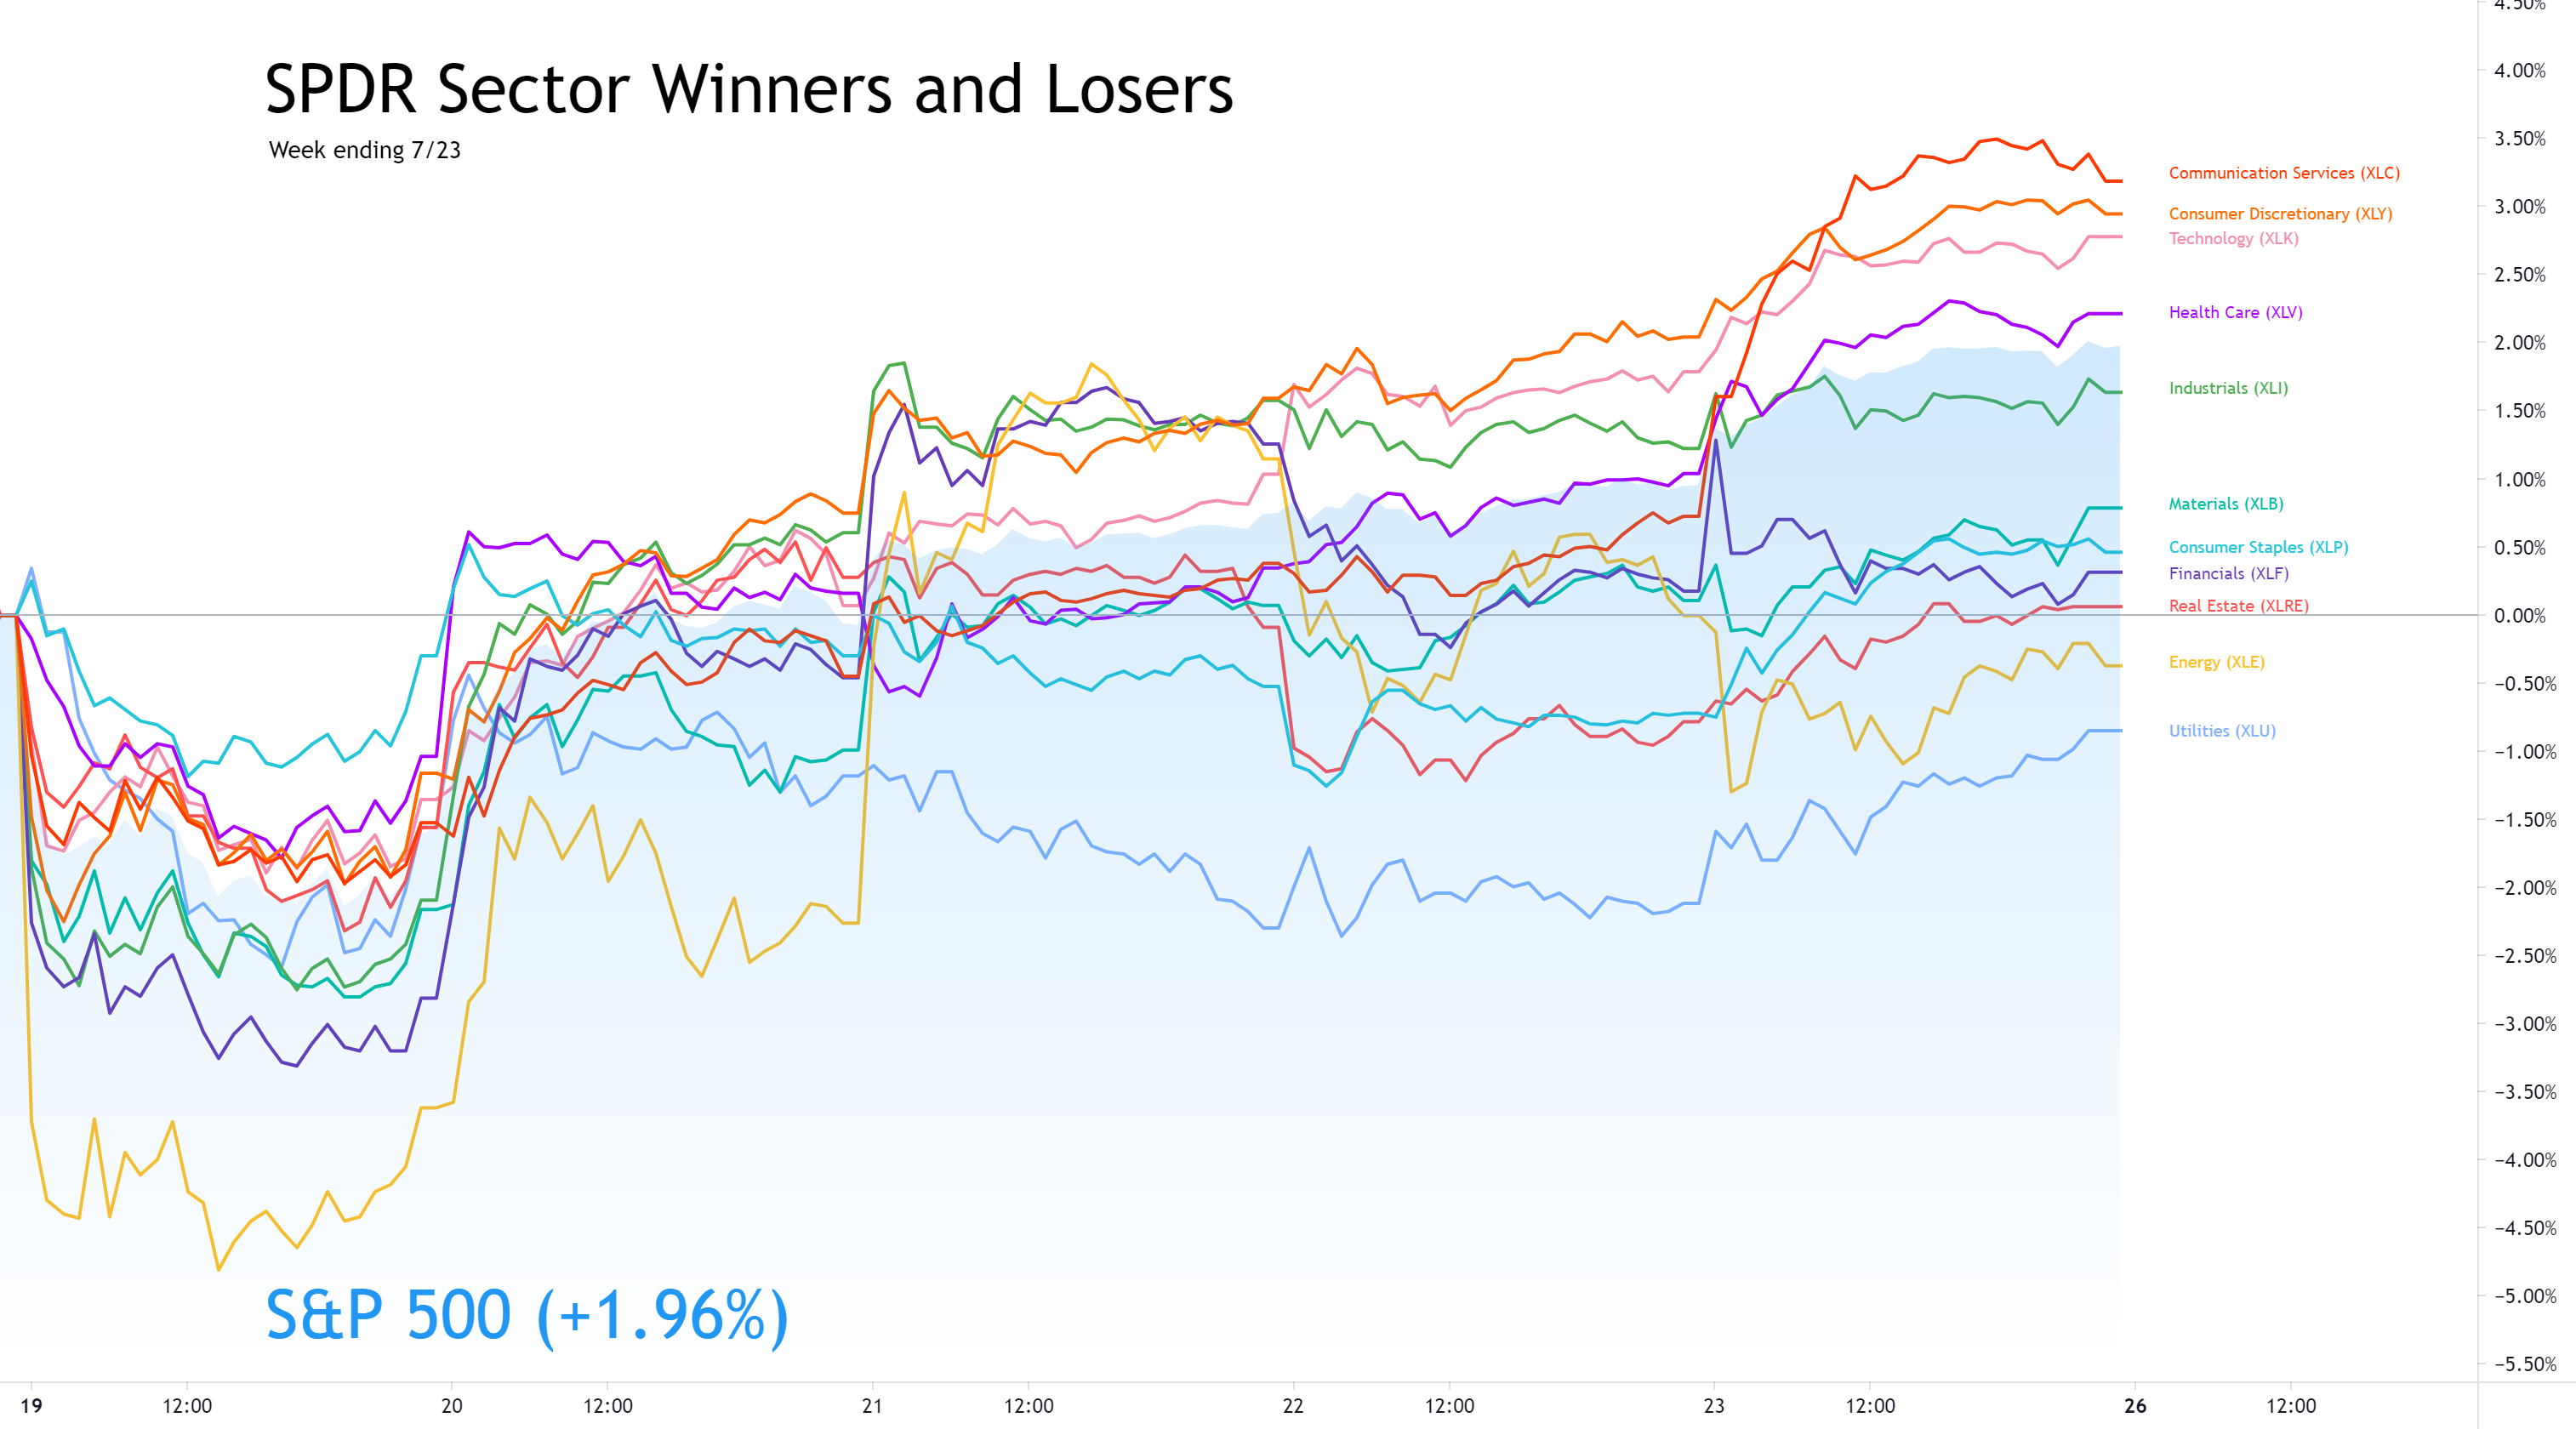
Utilities ( XLU ) dropped to the bottom of the sector list after leading in the previous week. It was all about Growth stocks this week as investors put off fears of the economy and looked forward to record earnings reports from big tech.
Communication Services ( XLC ) led the week thanks to huge earnings beat by SNAP and Twitter. Consumer Discretionary ( XLY ) and Technology ( XLK ) were second and third.
Energy ( XLE ) briefly moved into the top spot on Wednesday afternoon before falling back and ending the week in second-to-last place. Only Utilities and Energy declined for the week.
Yields for the US 30y, 10y, and 2y Treasuries all dropped for the week. The yields continue to slide, and the gap between long-term and short-term yields is tightening.
Both High Yield Corporate Bond (HYG) and Investment Grade Bond (LQD) prices advanced.
The US Dollar (DXY) advanced +0.21% for the week.
Silver (SILVER) declined -1.93%, and Gold (GOLD) declined -0.52%.
Crude Oil (CRUDEOIL1!) declined -0.13%.
Timber (WOOD) advanced +1.89%.
Copper (COPPER1!) advanced +4.07%.
Aluminum (ALI1!) advanced +1.00%.
-=x=-=x=-=x=-=x=-=x=-=x=-=x=-
Big Four Mega-caps
The four largest mega-caps had strong performances this week. Alphabet (GOOGL) gained +4.76% after the SNAP earnings call boosted the entire communications sector. Microsoft (MSFT) gained +3.18% thanks to a price target upgrade. Amazon (AMZN) advanced +2.32%. Apple (AAPL) gained +1.48%. All four are trading above their 10w and 40w moving average lines.
-=x=-=x=-=x=-=x=-=x=-=x=-=x=-
The Four Recovery Stocks
I picked four recovery stocks to track against the indexes and other indicators in this weekly report. All four have green candles this week, although Exxon Mobil (XOM) could not hold onto intra-week highs, ending the week with a -0.49% loss. Carnival Cruise Lines (CCL) climbed by +4.97%. Marriott (MAR) gained +3.06%. Delta Airlines (DAL) advanced +0.87%. Delta and Carnival are trading below both the 10w and 40w moving average lines. Exxon and Marriott are trading above the 40w line but remain below the 10w line.
-=x=-=x=-=x=-=x=-=x=-=x=-=x=-
Cryptocurrency
I started tracking four major cryptocurrencies on the week in review. The four are Bitcoin, Ethereum, Litecoin, and Bitcoin Cash. The latter two are not the largest by market cap but seem to be well-known and are part of the CIX capital.com index, tracking five cryptocurrencies, including these four (Ripple is the fifth).
The cryptocurrencies got a boost this week with another mention from Elon Musk. Ethereum (ETHUSD) had the biggest gain, advancing +14.17%. Bitcoin (BTCUSD) rose +7.24%. Litecoin (LTCUSD) gained +4.94%. Bitcoin Cash (BCHUSD) gained +3.06%.
-=x=-=x=-=x=-=x=-=x=-=x=-=x=-
Investor Sentiment
The put/call ratio (PCCE) rose above 0.9 on Monday but then recovered, ending the week at 0.702.
The CNN Fear & Greed Index moved into the Extreme Fear level late last week. It moved back toward neutral but remained on the Fear side.
The NAAIM Money Manager exposure index declined to 71.04 this week.
-=x=-=x=-=x=-=x=-=x=-=x=-=x=-
The Week Ahead
Big tech will dominate the earnings calendar this week. The earnings reports will be as important as the economic news calendar.
There are a lot of earnings reports, and I won't try to list them all here. Check your portfolio for earnings events to prevent surprises.
Monday
New Home Sales data will be available on Monday morning after the market opens.
Tesla (TSLA) on Monday will kick off a full week of big tech earnings.
Tuesday
Durable Goods Orders data made available before the market opens on Tuesday indicates the level of economic activity. Analysts expect June to be higher than May after the May number came in lower than expected.
CB Consumer Confidence for July will also be available in the morning after the market opens. An update to API Weekly Crude Oil Stock arrives after the market closes.
Three of the largest companies in the world report earnings on Tuesday. Apple (AAPL), Microsoft (MSFT), and Alphabet (GOOGL) are all expected to report strong year-over-year growth, but investors will be looking to guidance for future quarters. Visa (V), United Parcel Service (UPS), Starbucks (SBUX), Raytheon (RTX), 3m (MMM), AMD (AMD), General Electric (GE), Southern Copper (SCCO), Enphase (ENPH), Teladoc (TDOC), and Logitech (LOGI) are some of the other interesting companies also reporting on Tuesday.
Wednesday
Goods Trade Balance data, Retail Inventories, and Crude Oil Inventories will be available on Wednesday. The Fed will make a statement in the afternoon and announce any Interest Rate change (expected to be none). The tone of the message and press conference will have an impact on investor sentiment.
Earnings reports on Wednesday include Facebook (FB), PayPal (PYPL), Pfizer (PFE), Thermo Fisher Scientific (TMO), Shopify (SHOP), McDonald's (MCD), Qualcomm (QCOM), Boeing (BA), ADP (ADP), Ford (F), Spotify (SPOT), and ServiceNow (NOW).
Thursday
GDP data for Q2 will publish on Thursday. Initial Jobless Claims and Pending Home Sales will also get an update.
Amazon.com (AMZN), Mastercard (MA), AstraZeneca (AZN), Twilio (TWLO), Baidu (BIDU), Pinterest (PINS), Fortinet (FTNT), DexCom (DXCM), Yum! Brands (YUM), and Expedia (EXPE) are a few earnings reports that stand out among another huge list.
Friday
New inflation data becomes available on Friday with the updated PCE Price index data for June. Additional Employment Data and Consumer Sentiment data becomes available as well.
Berkshire Hathaway (BRKa), Procter & Gamble (PG), Exxon Mobil (XOM), AbbVie (ABBV), Chevron (CVX),
-=x=-=x=-=x=-=x=-=x=-=x=-=x=-
The Bullish Side
Earnings season is in full swing. Every earnings season is a bit different. Many of the first reports beat expectations, and investors reacted positively to the news. This week brings the big tech earnings reports, which should also be very positive. The reaction will provide a lift to the big tech stocks and the overall market.
Treasury Yields stabilized this week after several days of volatility. With the US Dollar strengthening and yields remaining low, investors will continue to look at US equities to get returns that beat still high inflation.
The economic recovery may be slowing, but it is still growing at a record pace. Debt is still cheap for companies to fund growth and profit from the global recovery.
-=x=-=x=-=x=-=x=-=x=-=x=-=x=-
The Bearish Side
Supply chain challenges continue to be a top worry as the recovery moves forward. Manufacturing PMI data on Friday shows an increase in activity for the sector, but challenges keep popping up with raw materials and shipping constraints. Extreme weather events in Germany and China made issues worse this week.
As valuations among big tech and growth stocks continue to soar and the indexes are at all-time highs, expectations will also be at all-time highs. Investors will be watching closely to earnings reports, the results, the guidance, and the dialogue on earnings calls. Investors may see great reports this week and decide to take profits "at the top."
-=x=-=x=-=x=-=x=-=x=-=x=-=x=-
Key Nasdaq Levels to Watch
The Nasdaq set another all-time high this week after moving back above the 21d EMA. If the index pulls back, the most critical level is around 14,200. A break below that level would signal a bearish double-top pattern.
On the positive side, the levels are:
On the downside, there are a few key levels:
-=x=-=x=-=x=-=x=-=x=-=x=-=x=-
Wrap-up
Two weeks with opposite characteristics. The previous week gave us give red candles while this week gave us five green candles. The volatility in bonds and equities was enough to raise some fears among investors but not enough to drive a correction.
It looks like we could get some more gains this week with the big tech earnings reports among hundreds of other earnings reports. The reports so far have huge year-over-year comparisons in results, but investors are also getting positive guidance for the year.
If we do not get gains and the index pulls back again, watch for the 14,200 level to hold. If we dip below that level, it would be a bearish signal.
Good luck, stay healthy, and trade safe!
Notes
- The Market Week in Review is my weekend homework where I look over what happened in the previous week and what might come in the next week.
- I occasionally have some errors or typos and will correct them in my blog or the comments on TradingView. I do not have an editor and do this in my free time.
- If you find this helpful, please let me know in the comments. I am also more than happy to add new perspectives and data points if you have ideas.
The structure is the following:
- A recap of the daily updates that I do here on TradingView.
- View on the past week
- What's coming in the next week
- The Bullish View, The Bearish View
- Key index levels to watch out for
- Wrap-up
If you have been following my daily updates, you can skip down to "View on the Week." If not, then this first part is a great play-by-play recap for the week. Click the daily charts for more detail on sectors, indexes, and market leaders each day.
-=x=-=x=-=x=-=x=-=x=-=x=-=x=-
Monday, July 19, 2021
Facts: -1.06%, Volume higher, Closing range: 71%, Body: 29%
Good: Support around 14,200, good closing range
Bad: Lower on higher volume, lower high, lower low
Highs/Lows: Lower high, lower low
Candle: Green body in center of candle, even upper and lower wicks
Advanced/Decline: 0.27, more than three declining stocks for every advancing stock
Indexes: SPX (-1.59%), DJI (-2.09%), RUT (-1.51%), VIX (+21.96%)
Sectors: Consumer Staples (XLP -0.30%) and Health (XLV -1.05%) at the top. Financials (XLF -2.80%) and Energy (XLE -3.53%) were bottom.
Expectation: Sideways or Lower
The new Delta variant of the Coronavirus was top of mind for investors as the trading week began. Share prices of COVID vaccine-related companies soared today as it appeared governments would need to double down on vaccination efforts.
The Nasdaq finished with a -1.06% loss for the day on higher volume. The index found support at the 14,200 level, closing with a 71% closing range above a 29% body that is right in the middle of the candle. The lower high and lower low continues a downtrend as more than three stocks declined for every stock that advanced today.
-=x=-=x=-=x=-=x=-=x=-=x=-=x=-
Tuesday, July 20, 2021

Facts: +1.57%, Volume higher, Closing range: 80%, Body: 59%
Good: Broad gains on higher volume to move back above 21d EMA
Bad: Nothing
Highs/Lows: Higher high, higher low
Candle: Bullish green body with higher low and higher high, medium size upper and lower wicks
Advanced/Decline: 2.69, more than five advancing stocks for every two declining stocks
Indexes: SPX (+1.52%), DJI (+1.62%), RUT (+2.99%), VIX (-12.32%)
Sectors: Industrials (XLI +2.80%) and Financials (XLF +2.48%) at the top. Utilities (XLU +0.43%) and Consumer Staples (XLP +0.03%) were bottom.
Expectation: Sideways or Higher
Small caps ended several days of losing to lead stocks higher today as investors snapped out of the pandemic fears that caused Monday's selling. Investors are warming back up to small caps as the US Dollar strengthens and yields in bonds are beginning to stabilize.
The Nasdaq finished with a +1.57% gain on higher volume than the previous day. The 59% green body and 80% closing range represent a day of constant buying that ended with some profit-taking in the last few minutes before the market close. The index closed yesterday's gap down and regained the 21d exponential moving average, closing at the 14,500 support area. There were more than five advancing stocks for every declining stock.
-=x=-=x=-=x=-=x=-=x=-=x=-=x=-
Wednesday, July 21, 2021
Facts: +0.92%, Volume lower, Closing range: 99%, Body: 92%
Good: Close at high of day, bullish green body, A/D ratio
Bad: Nothing
Highs/Lows: Higher high, higher low
Candle: No upper wick, very tiny lower wick, mostly green body
Advanced/Decline: 2.36, almost five advancing stocks for every two declining stocks
Indexes: SPX (+0.82%), DJI (+0.83%), RUT (+1.81%), VIX (-9.23%)
Sectors: Energy (XLE +3.49%) and Financials (XLF +1.72%) at the top. Real Estate (XLRE -0.30%) and Utilities (XLU -1.10%). were bottom.
Expectation: Sideways or Higher
Stocks continued to rebound from last week's dip, with small caps leading the march upward, keeping the advance/decline ratio above 2.0 for a second day. Investors are looking more optimistic about the economic recovery among solid earnings reports from market leaders.
The Nasdaq closed the day a +0.92%. Volume was lower, but buyers dominated the entire, with almost five advancing stocks for every declining stock. The candle has no upper wick because of the 99% closing range, and the green body covers 92% of the candle.
-=x=-=x=-=x=-=x=-=x=-=x=-=x=-
Thursday, July 22, 2021
Facts: +0.36%, Volume lower, Closing range: 87%, Body: 42%
Good: High closing range with higher high and higher low
Bad: Low volume, low A/D ratio
Highs/Lows: Higher high, higher low
Candle: Longer lower wick, a medium size green body in upper half
Advanced/Decline: 0.32, three declining stocks for every advancing stock
Indexes: SPX (+0.20%), DJI (+0.07%), RUT (-1.55%), VIX (-1.23%)
Sectors: Technology (XLK +0.74%) and Health (XLV +0.74%) at the top. Financials (XLF -1.09%) and Energy (XLE -1.12%) were bottom.
Expectation: Sideways or Lower
Rising jobless claims surprised the market this morning, sending cyclical sectors lower and causing a reversal in small caps after several days of gains. Investors rotated back into growth stocks and big tech, which are more resilient to the swings in the economy.
The Nasdaq finished the day with a +0.36% on lower volume than the previous day. The day ended with an 87% closing range for the index. A 45% body sits in the upper half of the candle, above a long lower wick formed in the morning as investors absorbed the economic news.
-=x=-=x=-=x=-=x=-=x=-=x=-=x=-
Friday, July 23, 2021

Facts: +1.04%, Volume higher, Closing range: 94%, Body: 57%
Good: High closing range on higher volume
Bad: A/D still below 1.0
Highs/Lows: Higher high, higher low
Candle: Gap up at open after several green days, mostly green body in upper half of candle
Advanced/Decline: 0.69, About three declining stocks for every two advancing
Indexes: SPX (+1.01%), DJI (+0.68%), RUT (+0.46%), VIX (-2.77%)
Sectors: Communications (XLC +2.48%) and Utilities (XLU +1.28%) at the top. Financials (XLF +0.17%) and Energy (XLE -0.37%) were bottom.
Expectation: Sideways or Higher
A rally in Social media stocks helped send the major indexes to new all-time highs. The optimism spread to other big tech stocks, giving the Nasdaq a high volume advance but leaving the advance/decline ratio below 1.0.
The Nasdaq finished with a +1.04% gain on higher volume to reach a new record close. The green candle caps a week of all green candles compared to the previous week's all red candles. Today's candle had a 57% green body in the upper half of the candle. The 94% closing range represents a day of bullish buying after a quick dip in the morning created the lower wick. There were almost three declining stocks for every two advancing stocks.
-=x=-=x=-=x=-=x=-=x=-=x=-=x=-
View on the Week
This week ended much better than it began. All indications at the market open on Monday were that we were going to have a bearish week. The CNN Fear & Greed indicator was in the Extreme Fear range, and the put/call ratio was nearing 0.9. Worries about the new delta strain putting new pressures on the economic recovery sent investors into defensive sectors.
The Nasdaq gapped down at open on Monday and continued to drop until it reached the 14,200 level. The index found support at that level and reversed. The upside reversal didn't end until a new all-time high was reached on Friday.
The 14,200 support area formed from the February and April highs. It became resistance in June before the index moved higher. On Monday, the index tested the level several times, and the support was held. This will be a critical area to watch if another pullback occurs in the coming weeks.
After the index found support, it just took a few pieces of good news to get the rally back on track. That news came in a few forms.
First, earnings reports were largely positive this week. IBM, Johnson & Johnson, Coca-Cola, and Intel all had great earnings reports. But the biggest surprise of the week was SNAP, which beat estimates and doubled revenue from a year earlier on robust advertising income. That was enough to send the entire Communications sector higher.
Another boost to big tech came in analyst upgrades for Nvidia and Microsoft. Analysts improved their price targets for the two companies ahead of earnings.
Finally, OPEC helped a bit by deciding to increase production to meet a forecast of higher demand. That's a great indicator of confidence in the continuing economic recovery. The news sent the Energy sector higher on Wednesday.
Small caps in the Russell 2000 outperformed on Tuesday and Wednesday. The segment sold off the last three weeks, causing valuations to be lower than the larger cap segments. With the low valuations combined with a strengthening USD and continuing low Treasury yields, it was a perfect context for small caps to get an influx of investment.
Chinese stocks such as Alibaba, JD.com, UP Fintech, and FUTU Holdings were beaten down this week on fears that the Chinese government will crack down on companies listed in foreign exchanges.
The Nasdaq advanced +2.84% for the week, recovering all of the previous week's loss and closing at an all-time high. Volume was lower than the previous week. The lower low and higher high for the week create an outside bullish candle with a 99% closing range.
Along with the Nasdaq, the S&P 500 (SPX) and Dow Jones Industrial Average (DJI) closed the week at all-time highs, advancing +1.96% and +1.08%. The Russell 2000 (RUT) had its first weekly gain in four weeks, rising +2.15%.
The VIX volatility declined -6.78% for the week.
Utilities ( XLU ) dropped to the bottom of the sector list after leading in the previous week. It was all about Growth stocks this week as investors put off fears of the economy and looked forward to record earnings reports from big tech.
Communication Services ( XLC ) led the week thanks to huge earnings beat by SNAP and Twitter. Consumer Discretionary ( XLY ) and Technology ( XLK ) were second and third.
Energy ( XLE ) briefly moved into the top spot on Wednesday afternoon before falling back and ending the week in second-to-last place. Only Utilities and Energy declined for the week.
Yields for the US 30y, 10y, and 2y Treasuries all dropped for the week. The yields continue to slide, and the gap between long-term and short-term yields is tightening.
Both High Yield Corporate Bond (HYG) and Investment Grade Bond (LQD) prices advanced.
The US Dollar (DXY) advanced +0.21% for the week.
Silver (SILVER) declined -1.93%, and Gold (GOLD) declined -0.52%.
Crude Oil (CRUDEOIL1!) declined -0.13%.
Timber (WOOD) advanced +1.89%.
Copper (COPPER1!) advanced +4.07%.
Aluminum (ALI1!) advanced +1.00%.
-=x=-=x=-=x=-=x=-=x=-=x=-=x=-
Big Four Mega-caps
The four largest mega-caps had strong performances this week. Alphabet (GOOGL) gained +4.76% after the SNAP earnings call boosted the entire communications sector. Microsoft (MSFT) gained +3.18% thanks to a price target upgrade. Amazon (AMZN) advanced +2.32%. Apple (AAPL) gained +1.48%. All four are trading above their 10w and 40w moving average lines.
-=x=-=x=-=x=-=x=-=x=-=x=-=x=-
The Four Recovery Stocks
I picked four recovery stocks to track against the indexes and other indicators in this weekly report. All four have green candles this week, although Exxon Mobil (XOM) could not hold onto intra-week highs, ending the week with a -0.49% loss. Carnival Cruise Lines (CCL) climbed by +4.97%. Marriott (MAR) gained +3.06%. Delta Airlines (DAL) advanced +0.87%. Delta and Carnival are trading below both the 10w and 40w moving average lines. Exxon and Marriott are trading above the 40w line but remain below the 10w line.
-=x=-=x=-=x=-=x=-=x=-=x=-=x=-
Cryptocurrency
I started tracking four major cryptocurrencies on the week in review. The four are Bitcoin, Ethereum, Litecoin, and Bitcoin Cash. The latter two are not the largest by market cap but seem to be well-known and are part of the CIX capital.com index, tracking five cryptocurrencies, including these four (Ripple is the fifth).
The cryptocurrencies got a boost this week with another mention from Elon Musk. Ethereum (ETHUSD) had the biggest gain, advancing +14.17%. Bitcoin (BTCUSD) rose +7.24%. Litecoin (LTCUSD) gained +4.94%. Bitcoin Cash (BCHUSD) gained +3.06%.
-=x=-=x=-=x=-=x=-=x=-=x=-=x=-
Investor Sentiment
The put/call ratio (PCCE) rose above 0.9 on Monday but then recovered, ending the week at 0.702.
The CNN Fear & Greed Index moved into the Extreme Fear level late last week. It moved back toward neutral but remained on the Fear side.
The NAAIM Money Manager exposure index declined to 71.04 this week.
-=x=-=x=-=x=-=x=-=x=-=x=-=x=-
The Week Ahead
Big tech will dominate the earnings calendar this week. The earnings reports will be as important as the economic news calendar.
There are a lot of earnings reports, and I won't try to list them all here. Check your portfolio for earnings events to prevent surprises.
Monday
New Home Sales data will be available on Monday morning after the market opens.
Tesla (TSLA) on Monday will kick off a full week of big tech earnings.
Tuesday
Durable Goods Orders data made available before the market opens on Tuesday indicates the level of economic activity. Analysts expect June to be higher than May after the May number came in lower than expected.
CB Consumer Confidence for July will also be available in the morning after the market opens. An update to API Weekly Crude Oil Stock arrives after the market closes.
Three of the largest companies in the world report earnings on Tuesday. Apple (AAPL), Microsoft (MSFT), and Alphabet (GOOGL) are all expected to report strong year-over-year growth, but investors will be looking to guidance for future quarters. Visa (V), United Parcel Service (UPS), Starbucks (SBUX), Raytheon (RTX), 3m (MMM), AMD (AMD), General Electric (GE), Southern Copper (SCCO), Enphase (ENPH), Teladoc (TDOC), and Logitech (LOGI) are some of the other interesting companies also reporting on Tuesday.
Wednesday
Goods Trade Balance data, Retail Inventories, and Crude Oil Inventories will be available on Wednesday. The Fed will make a statement in the afternoon and announce any Interest Rate change (expected to be none). The tone of the message and press conference will have an impact on investor sentiment.
Earnings reports on Wednesday include Facebook (FB), PayPal (PYPL), Pfizer (PFE), Thermo Fisher Scientific (TMO), Shopify (SHOP), McDonald's (MCD), Qualcomm (QCOM), Boeing (BA), ADP (ADP), Ford (F), Spotify (SPOT), and ServiceNow (NOW).
Thursday
GDP data for Q2 will publish on Thursday. Initial Jobless Claims and Pending Home Sales will also get an update.
Amazon.com (AMZN), Mastercard (MA), AstraZeneca (AZN), Twilio (TWLO), Baidu (BIDU), Pinterest (PINS), Fortinet (FTNT), DexCom (DXCM), Yum! Brands (YUM), and Expedia (EXPE) are a few earnings reports that stand out among another huge list.
Friday
New inflation data becomes available on Friday with the updated PCE Price index data for June. Additional Employment Data and Consumer Sentiment data becomes available as well.
Berkshire Hathaway (BRKa), Procter & Gamble (PG), Exxon Mobil (XOM), AbbVie (ABBV), Chevron (CVX),
-=x=-=x=-=x=-=x=-=x=-=x=-=x=-
The Bullish Side
Earnings season is in full swing. Every earnings season is a bit different. Many of the first reports beat expectations, and investors reacted positively to the news. This week brings the big tech earnings reports, which should also be very positive. The reaction will provide a lift to the big tech stocks and the overall market.
Treasury Yields stabilized this week after several days of volatility. With the US Dollar strengthening and yields remaining low, investors will continue to look at US equities to get returns that beat still high inflation.
The economic recovery may be slowing, but it is still growing at a record pace. Debt is still cheap for companies to fund growth and profit from the global recovery.
-=x=-=x=-=x=-=x=-=x=-=x=-=x=-
The Bearish Side
Supply chain challenges continue to be a top worry as the recovery moves forward. Manufacturing PMI data on Friday shows an increase in activity for the sector, but challenges keep popping up with raw materials and shipping constraints. Extreme weather events in Germany and China made issues worse this week.
As valuations among big tech and growth stocks continue to soar and the indexes are at all-time highs, expectations will also be at all-time highs. Investors will be watching closely to earnings reports, the results, the guidance, and the dialogue on earnings calls. Investors may see great reports this week and decide to take profits "at the top."
-=x=-=x=-=x=-=x=-=x=-=x=-=x=-
Key Nasdaq Levels to Watch
The Nasdaq set another all-time high this week after moving back above the 21d EMA. If the index pulls back, the most critical level is around 14,200. A break below that level would signal a bearish double-top pattern.
On the positive side, the levels are:
- The high of this past week was a new all-time high at 14,846.06.
- The round number 15,000 is likely to be a new area of resistance.
On the downside, there are a few key levels:
- The 10d MA is at 14,595.36.
- The 21d EMA is at 14,510.57.
- 14,500 has been a support area in the past.
- 14,178.66 is the low of the past week. A break below this level would signal a bearish double top.
- The 50d MA is at 14,118.58.
- 14,000 has been an area of support/resistance.
- There is a pivot at 13,548.93.
-=x=-=x=-=x=-=x=-=x=-=x=-=x=-
Wrap-up
Two weeks with opposite characteristics. The previous week gave us give red candles while this week gave us five green candles. The volatility in bonds and equities was enough to raise some fears among investors but not enough to drive a correction.
It looks like we could get some more gains this week with the big tech earnings reports among hundreds of other earnings reports. The reports so far have huge year-over-year comparisons in results, but investors are also getting positive guidance for the year.
If we do not get gains and the index pulls back again, watch for the 14,200 level to hold. If we dip below that level, it would be a bearish signal.
Good luck, stay healthy, and trade safe!