Summary: This week's story has many parts, including Chinese stocks, Earnings Reports, the Infrastructure Bill, and a two-day Fed meeting which all ended with advances in small-caps and gains in commodity prices. Each made its influence felt across the market as investors shifted to respond to the implications of each.
Notes
The structure is the following:
If you have been following my daily updates, you can skip down to "View on the Week." If not, then this first part is a great play-by-play recap for the week. Click the daily charts for more detail on sectors, indexes, and market leaders each day.
-=x=-=x=-=x=-=x=-=x=-=x=-=x=-
Monday, July 26, 2021

Facts: +0.03%, Volume higher, Closing range: 69%, Body: 27%
Good: Slight gain on higher volume, healthy pause
Bad: A/D low but not surprising with sideways move
Highs/Lows: Higher high, higher low
Candle: Thin green body in the middle of a short candle
Advanced/Decline: 0.57, almost two declining stocks for every advancing stock
Indexes: SPX (+0.24%), DJI (+0.24%), RUT (+0.33%), VIX (+2.33%)
Sectors: Energy (XLE +2.47%) and Materials (XLB +0.84%) at the top. Industrials (XLI -0.05%) and Health (XLV -0.65%) were bottom.
Expectation: Sideways or Higher
Small caps had a volatile start to the week, gaining on Monday morning and losing those gains by mid-day. Still, the gains were enough for all the major indices to advance today as investors look forward to a massive earnings week.
The Nasdaq closed the day with a small +0.03% gain. It traded up and down throughout the day but stayed within a tight range. Volume was higher for the day. A thin green body sits in the middle of the short candle, with equal upper and lower wicks. The closing range was 69%. There were almost two declining stocks for every advancing stock.
-=x=-=x=-=x=-=x=-=x=-=x=-=x=-
Tuesday, July 27, 2021
Facts: -1.21%, Volume lower, Closing range: 51%, Body: 48%
Good: Lower volume on pullback, longer lower wick from bounce at 14,500 support.
Bad: Lower high, lower low, dip below 21d EMA
Highs/Lows: Lower high, lower low
Candle: Half red body above half lower wick, no upper wick
Advanced/Decline: 0.28, more than three declining stocks for every advancing stock
Indexes: SPX (-0.47%), DJI (-0.24%), RUT (-1.13%), VIX (+10.01%)
Sectors: Utilities (XLU +1.72%) and Real Estate (XLRE +0.80%) at the top. Consumer Discretionary (XLY -1.01%) and Communications (-1.19%) were bottom.
Expectation: Sideways or Lower
Earnings reports releasing this week have been very positive, but investors are already looking beyond the reports to expectations for the second half of the year. With mounting fears around the new Delta variant of COVID and potential changes in monetary policy by the Fed, all major indexes retreated today.
The Nasdaq closed with a -1.21% loss in a session that was mostly selling before a bounce at the 14,500 support level. Volume was lower than the previous day. The bounce brought the index back up to the middle of the candle for a 51% closing range. The 48% red body is in the upper half of the candle, over a long lower wick. There were more than three declining stocks for every advancing stock.
-=x=-=x=-=x=-=x=-=x=-=x=-=x=-
Wednesday, July 28, 2021
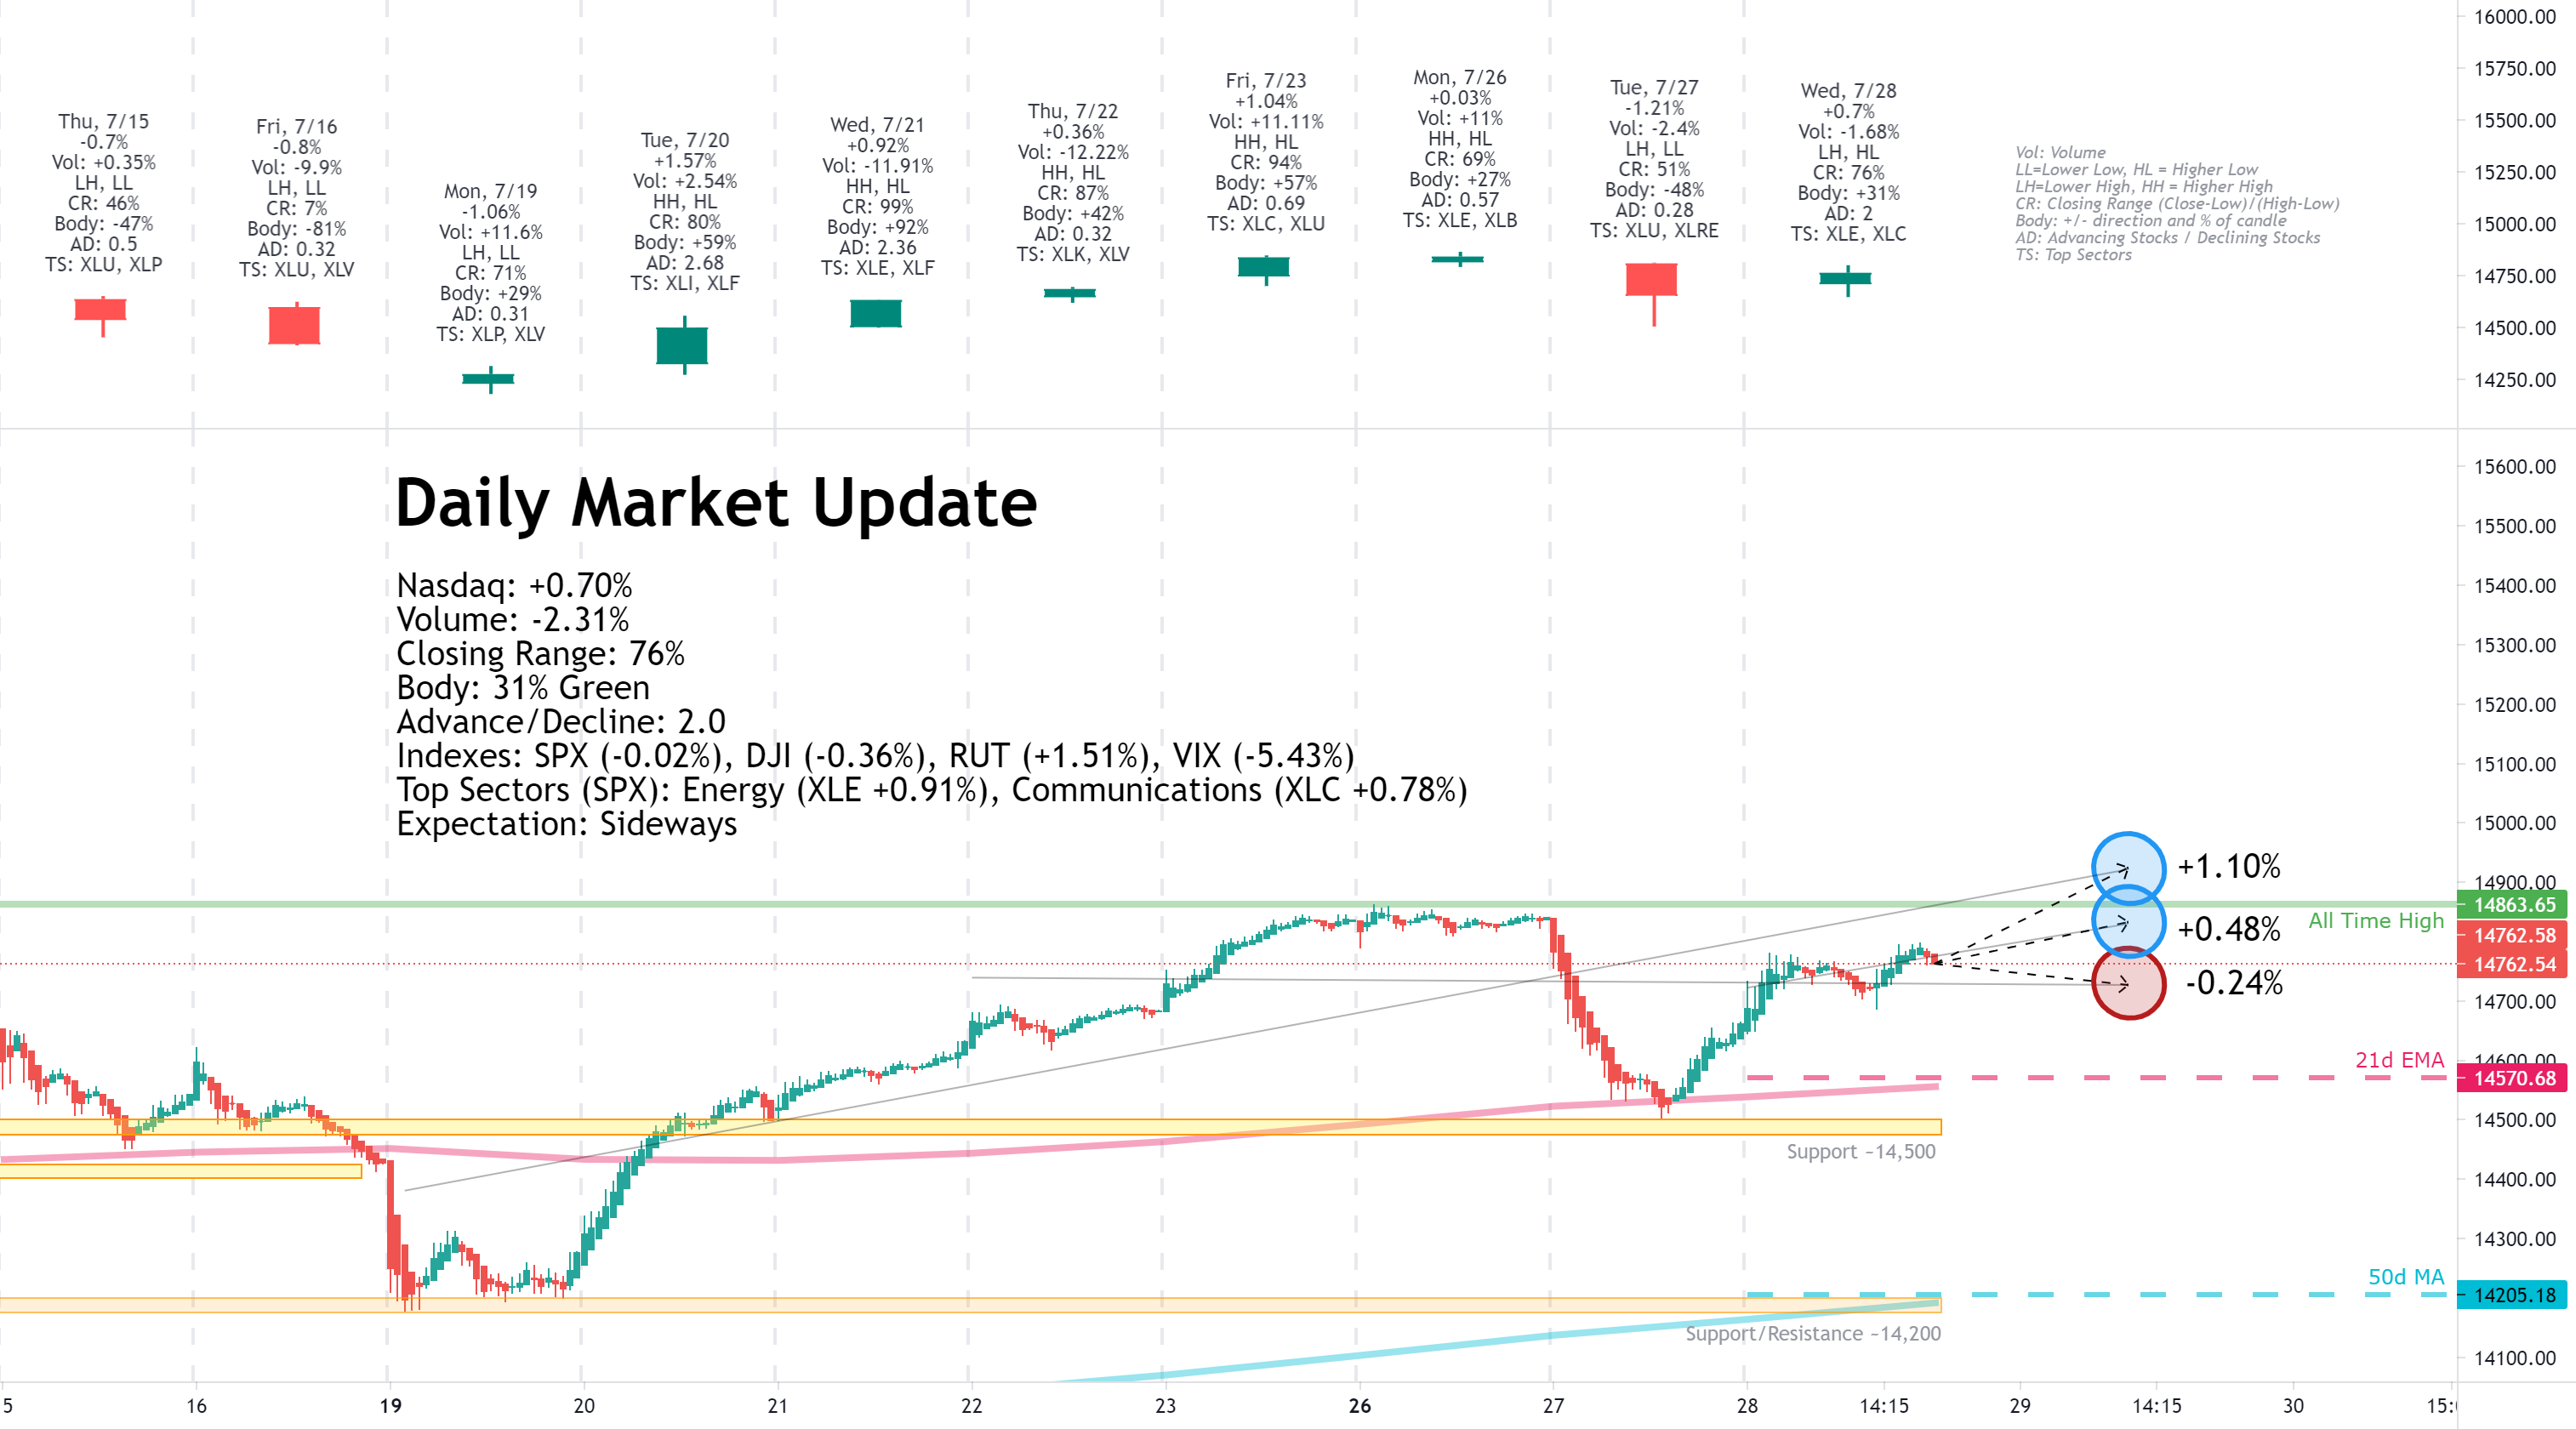
Facts: +0.70%, Volume lower, Closing range: 76%, Body: 31%
Good: Rally in morning and afternoon to close with gain, A/D ratio above 1.0
Bad: Lower high, lower volume, dip at end of day
Highs/Lows: Lower high, higher low
Candle: Inside day, slightly longer lower wick
Advanced/Decline: 2.0, two advancing stocks for every declining stock
Indexes: SPX (-0.02%), DJI (-0.36%), RUT (+1.51%), VIX (-5.43%)
Sectors: Energy (XLE +0.91%) and Communications (XLC +0.78%) at the top. Utilities (XLU -0.76%) and Consumer Staples (XLP -0.88%) at the bottom.
Expectation: Sideways
Investors survived another Fed meeting with stocks gaining after the Fed left monetary policy untouched but confirmed the economy is still on track and inflation appears transitory. Small caps and growth stocks soared while only a few of the SPDR sectors registered gains.
The Nasdaq dipped at open but recovered quickly and ended the day with a +0.70% gain. Volume was lower for the day, but the 76% closing range and 31% green body are positive outcomes on an Inside day (lower high, higher low). The lower wick is slightly longer than the upper wick. There were two advancing stocks for every declining stock.
-=x=-=x=-=x=-=x=-=x=-=x=-=x=-
Thursday, July 29, 2021
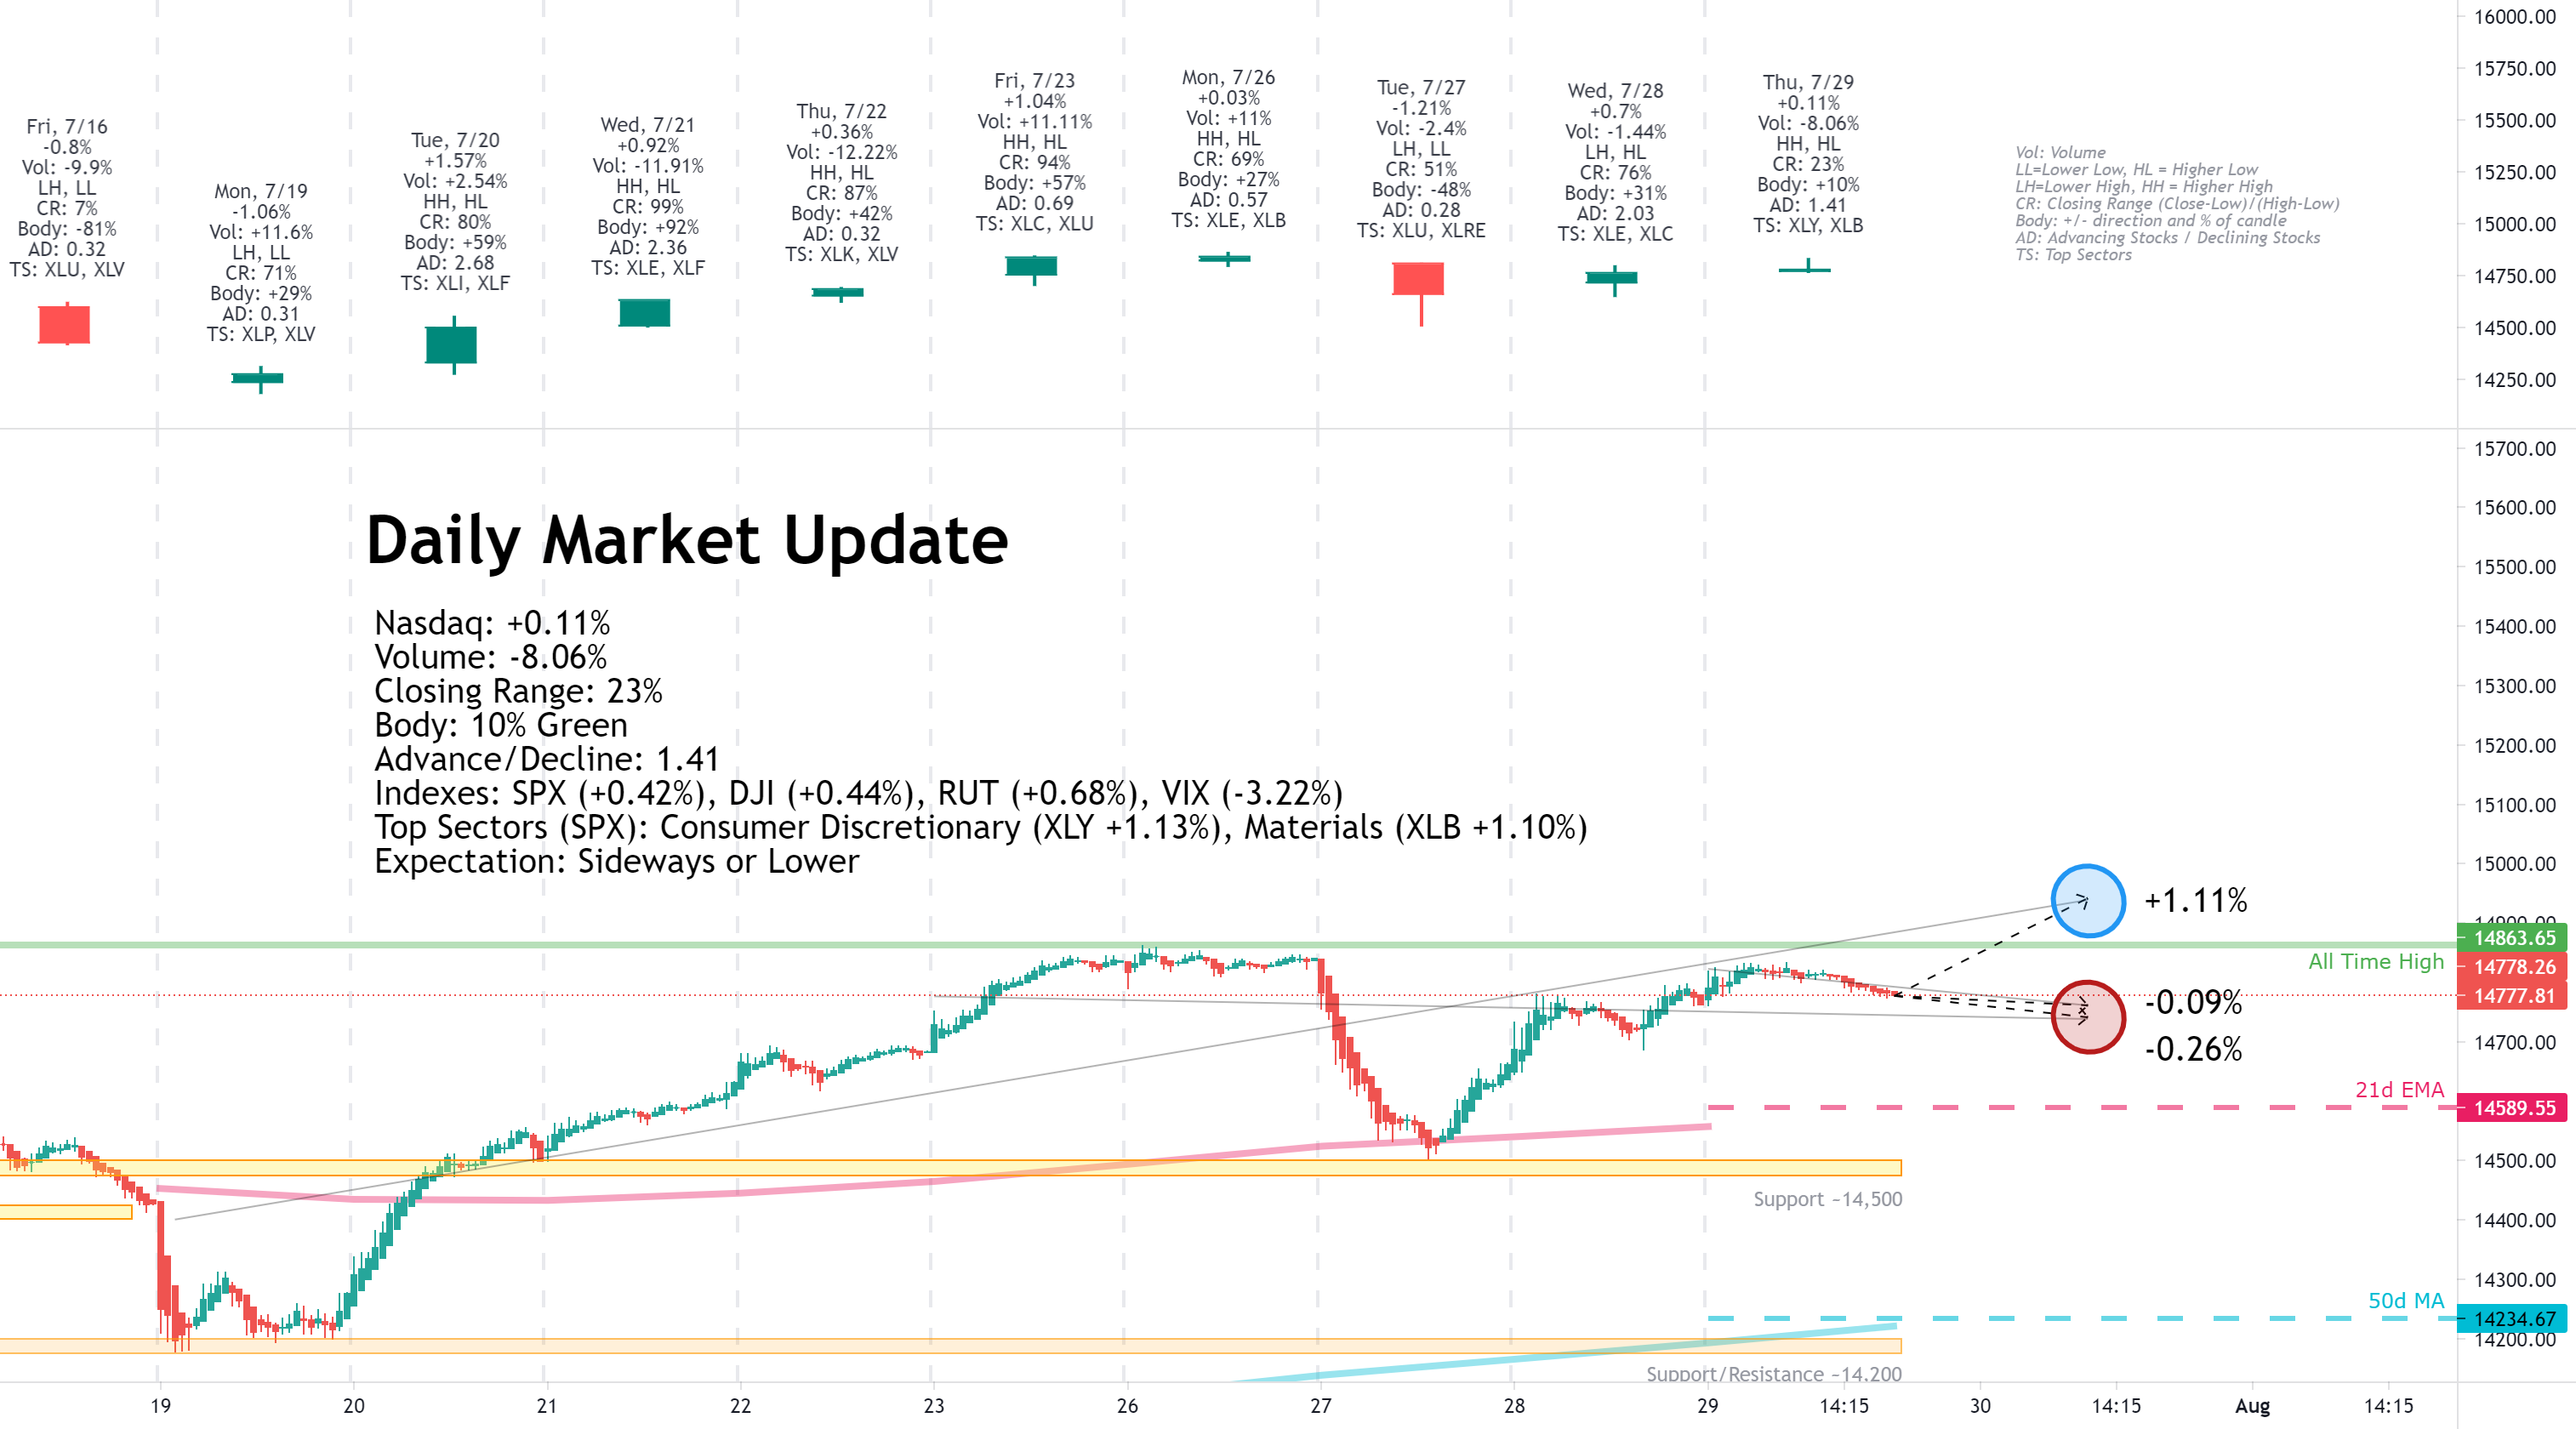
Facts: +0.11%, Volume lower, Closing range: 23%, Body: 10%
Good: Higher high and higher low, A/D ratio
Bad: Long upper wick relative to body as early gains faded
Highs/Lows: Higher high, higher low
Candle: Thin body at the bottom of candle with long upper wick
Advanced/Decline: 1.41, more advancing stocks than declining stocks
Indexes: SPX (+0.42%), DJI (+0.44%), RUT (+0.68%), VIX (-3.22%)
Sectors: Consumer Discretionary (XLY +1.13%) and Materials (XLB +1.10%) at the top. Real Estate (XLRE -0.30%) and Communications (XLC -1.08%) at the bottom.
Expectation: Sideways
GDP growth was less than expected this morning while employment data confirmed the Fed's message that there is still more work to do in the economic recovery. That wasn't necessarily a bad thing for equities, as it means economic support will continue for some time.
The Nasdaq closed the day with a +0.11% but gave back intra-day gains, creating a long upper wick over a thin green body. Volume was lower for the day. The closing range of 23% and 10% green body at the bottom of the candle represents a failed attempt to rally today, but the A/D ratio shows some broader gains under the surface.
-=x=-=x=-=x=-=x=-=x=-=x=-=x=-
Friday, July 30, 2021
Facts: -0.71%, Volume lower, Closing range: 50%, Body: 50%
Good: Bounce off 21d EMA and did not revisit low
Bad: Could not hold intraday high from morning rally
Highs/Lows: Lower high, lower low
Candle: Half green body at the bottom of the candle, no lower wick
Advanced/Decline: 0.45, two declining stocks for every advancing stock
Indexes: SPX (-0.54%), DJI (-0.42%), RUT (-0.62%), VIX (+2.94%)
Sectors: Materials (XLB +0.41%) and Real Estate (XLRE +0.32%) at the top. Energy (XLE -1.59%( and Consumer Discretionary (XLY -2.06%) at the bottom.
Expectation: Sideways
A disappointing earnings report from Amazon weighed down major indexes, but inflation data came in less than expected, helping give the market a boost in the morning.
The Nasdaq closed the day with a -0.71% loss to end the week. Volume was lower and declining every day this week since Monday's all-time high in the index. The 50% green body sits at the bottom of the candle with no lower wick. The upper wick formed in the morning rally, but the index could not hold onto the intraday high. There were two declining stocks for every advancing stock.
-=x=-=x=-=x=-=x=-=x=-=x=-=x=-
View on the Week
This week's story has many parts, including Chinese stocks, Earnings Reports, the Infrastructure Bill, and a two-day Fed meeting which all ended with advances in small-caps and gains in commodity prices. Each made its influence felt across the market as investors shifted to respond to the implications of each.
Chinese stocks were already on a slide downward coming into the week. China started a regulatory crackdown on companies listed in foreign exchanges that started with the IPO of ride-hailing company Didi a few weeks ago. After several days of losses last week, the stocks opened the week again this week. They seemed to hit bottom and bounce mid-week, but the gains were gone by the end of the week.
Earnings reports mainly were spectacular, but the responses by investors were inconsistent. Look to the results of the largest four mega-caps as an example. On Tuesday, Apple, Alphabet, and Microsoft released their earnings reports after the market closed. All three smashed expectations, which were already high given the height of the pandemic was one year previous. Yet, Apple and Microsoft sold off after hours while Google gained 3%. Microsoft recovered most of the loss the following day, but Apple could not.
The reactions represent a still very nervous market. Even as companies turn in great results, the big fears of the year continue to be top of mind. Examples are supply chain pressures for Apple and a potential slow-down in Q3 of demand for Microsoft compared to the previous year. One area that isn't a concern is the advertising business, which is booming and helped send Alphabet yet higher.
Tesla pleased investors with their earnings report on Monday, sending the stock up over 6% for the week. One company that did not please investors was Amazon. Although the company had great results, the outlook for the year did not meet expectations. The mega-cap dropped 7% on Friday and brought the major indexes down with it.
The Fed had a two-day meeting this week and released a statement on Wednesday. The tone struck the right balance for investors. The economic recovery is on track, but there was more work to do, and so they would not change the anticipated timing of tapering. They noted inflation was still a concern but still held firm that the inflationary conditions are transitory. That sent the indexes higher on Wednesday.
The new all-time high on Monday and subsequent pullback still have double-top potential. 14,200 is the critical level to watch for this week if there is a further pullback.
The Nasdaq declined -1.11% for the week after getting a new all-time high on Monday. The result is a higher high and higher low and a not-so-terrible closing range of 47%. Volume was lower than the previous week.
The market was good for small-caps this past week. With investors pulling profits out of the mega-cap stocks and the Fed keeping a supportive but hawkish stance, the Russell 2000 (RUT) ended the week with gains while the other major indexes declined. The RUT gained +0.75% for the week. The S&P 500 (SPX) lost -0.37%, while the Dow Jones Industrial Average (DJI) declined -0.36%.
The VIX volatility advanced +6.05% for the week.
Materials ( XLB ) was the top sector of the week as manufacturing and core durable goods data showed increase demand and was confirmed in consumer spending numbers. At the same time, the Infrastructure bill moved closer to becoming law. The growth in the sector was matched by increased prices in metal commodities required to support economic expansion.
Energy ( XLE ) started the week strong and led several days throughout the week but ended in second place behind Materials at the end of the week.
The three worst sectors were the growth sectors, all losing for the week. Technology ( XLK ), Communication Services ( XLC ), and Consumer Discretionary ( XLY ) were at the bottom of the weekly sector list.
Yields for the US 30y, 10y, and 2y Treasuries all dropped for the week. The yields continue to slide, and the gap between long-term and short-term yields is tightening.
Both High Yield Corporate Bond (HYG) prices declined, and Investment Grade Bond (LQD) prices advanced. Both remain high as demand for higher yield continues to push investors toward riskier corporate bond investments.
The US Dollar (DXY) declined -0.88% for the week. The index fell sharply after the Fed's statements on Wednesday.
Silver (SILVER) advanced +1.16%, and Gold (GOLD) advanced +0.71%, mostly reacting to moves in the USD.
Crude Oil (CRUDEOIL1!) advanced +2.76%.
Timber (WOOD) advanced +0.17%.
Copper (COPPER1!) declined -1.18%.
Aluminum (ALI1!) advanced +3.67%.
-=x=-=x=-=x=-=x=-=x=-=x=-=x=-
Big Four Mega-caps
Only Alphabet (GOOGL) gained among the big four this week, advancing +1.29% on a solid performance in the advertising business, helping the entire communications sector. Apple (AAPL) and Microsoft (MSFT) declined -1.82% and -1.64% but remained above the key weekly moving average lines. Amazon (AMZN) disappointed investors on Thursday, falling -9.00% for the week. The stock closed the week below its 10w moving average line.
-=x=-=x=-=x=-=x=-=x=-=x=-=x=-
The Four Recovery Stocks
I picked four recovery stocks to track against the indexes and other indicators in this weekly report. Marriot (MAR) was the top performer among the four this week, advancing +4.89% and moving back above its 10w moving average line. Exxon Mobil (XOM) gained +0.93% but remained below the 10w line. Carnival Cruise Lines (CCL) and Delta Airlines (DAL) both had losses this week and traded below the 10w moving average and 40w moving average lines.
-=x=-=x=-=x=-=x=-=x=-=x=-=x=-
Cryptocurrency
I started tracking four major cryptocurrencies on the week in review. The four are Bitcoin, Ethereum, Litecoin, and Bitcoin Cash. The latter two are not the largest by market cap but seem to be well-known and are part of the CIX capital.com index, tracking five cryptocurrencies, including these four (Ripple is the fifth).
The cryptocurrencies continued to rebound from lows two weeks ago. Bitcoin (BTCUSD) gained +12.52% this week. Ethereum (ETHUSD) climbed by +16.53%. Litecoin (LTCUSD) advanced +9.81%. Bitcoin Cash (BCHUSD) rose +15.55%. Bitcoin and Ethereum are trading above the key moving averages, with Ethereum showing the best trend as the 10w line is above the 40w line.
-=x=-=x=-=x=-=x=-=x=-=x=-=x=-
Investor Sentiment
The put/call ratio (PCCE) rose above 0.8 on Tuesday but ended the week at 0.668.
The CNN Fear & Greed Index moved back into the Extreme Fear level.
The NAAIM money manager exposure index moved up to 78.39.
-=x=-=x=-=x=-=x=-=x=-=x=-=x=-
The Week Ahead
It will be another big week of earnings reports.
There are a lot of earnings reports, and I won't try to list them all here. Check your portfolio for earnings events to prevent surprises.
Monday
The ISM will release manufacturing purchasing managers index data on Monday.
HSBC (HSBC), Mitsubishi UFJ (MUFG), Heineken (HEINY), and Zoominfo (ZI) are a few of the earnings reports for Monday.
Tuesday
Factory Orders data will be available in the morning, with the API Weekly Crude Oil Stock data coming after the market close.
Alibaba (BABA), Eli Lilly (LLY), Amgen (AMGN), Fidelity (FIS), Marriott (MAR), Match Group (MTCH), Occidental (OXY), Ringcentral (RNG), LYFT (LYFT), Hyatt (H), and Skillz (SKLZ) are some of the many earnings reports for Tuesday.
Wednesday
Several economic indicators will get updates tomorrow. Mortgage data will be available early in the morning. Then Nonfarm Employment Change data will give an update on the labor market. Purchase Manager Index data for Services will show growth for the services sector, while Non-Manufacturing purchasing manager index data will provide a broader look at economic activity. Finally, Crude Oil Inventories get an update later in the morning.
Toyota Motor (TM ), Sony (SONY), CVS (CVS), Booking (BKNG), General Motors (GM), Uber (UBER), Roku (ROKU), Allstate (ALL), Etsy (ETSY), AMC Entertainment (AMC), Fastly (FSLY), Lemonade (LMND), and DermTech (DMTK) are some of the exciting earnings reports for Wednesday.
Thursday
Initial Jobless Claims gets an update on Thursday. We will also get new Exports, Imports, and Trade Balance data.
Novo Nordisk (NVO), Moderna (MRNS), Square (SQ), MercadoLibre (MELI), Cloudflare (NET), DataDog (DDOG), Zillow (Z), Penn National Gaming (PENN), Zynga (ZNGA), Virgin Galactic (SPCE), and Redfin (RDFN) report earnings. Many of these and others not listed had tremendous growth over the past year, and investors will be watching the year-over-year comparisons closely to see if growth continues at the same or similar pace.
Friday
More employment data will be available on Friday morning, including Average Hourly Earnings, Nonfarm Payrolls, and the Unemployment Rate.
Interesting earnings reports for Friday include DraftKings (DKNG) and Riot Blockchain (RIOT).
-=x=-=x=-=x=-=x=-=x=-=x=-=x=-
The Bullish Side
Despite the pullback in the indexes this week, prices remain near all-time highs. The Fed reaffirmed steady progress for the economic recovery while stating that there is still more support needed and they would not change monetary policy in the short term. There is also some indication in pricing data that inflation is slowing down a bit, lending support toward the Fed's statements that it is transitory.
Companies continue to receive support in low-interest rates and are turning that into growth opportunities. In particular, small caps are viewed as benefiting from the current economic cycle. While large-caps are seeing some profit-taking among investors, those investments are rotating back into small-caps.
Commodity prices, especially Oil and Aluminum, are showing the bullishness among investors on economic growth. Aluminum is a metal required across many sectors of manufacturing, from consumer products to industrial applications. The demand for oil is increasing, raising oil prices and helping the Energy sector recover from recent selling.
-=x=-=x=-=x=-=x=-=x=-=x=-=x=-
The Bearish Side
The Delta variant of COVID is a top concern among investors. Statements made this weekend by leaders in D.C. stated there would not be another lockdown, but that does not mean there won't be any impact on the rising cases even among the vaccinated. Bad news here could send the indexes back into volatility and send prices lower.
As earnings reports pass and investors look toward Q3, they may see a top here for many companies. The comparable year-over-year performance is favorable in Q2, but the expectation is that this growth will slow down in Q3. Time to take profits?
-=x=-=x=-=x=-=x=-=x=-=x=-=x=-
Key Nasdaq Levels to Watch
The Nasdaq set another all-time high this week after moving back above the 21d EMA. If the index pulls back, the most critical level is around 14,200. A break below that level would signal a bearish double-top pattern.
On the positive side, the levels are:
On the downside, there are a few key levels:
-=x=-=x=-=x=-=x=-=x=-=x=-=x=-
Wrap-up
It's never an easy ride when the indexes are making new all-time highs. Investors are waiting for an overdue correction but not wanting to exit just in case the markets move another leg up. Right now, with the Fed support, low interest rates, and outstanding performance of earnings reports, I would lean toward a bullish outlook. The fact that investor sentiment is in extreme fear is often contrarian to what happens.
At the same time, there is always the possibility for a double-top pattern here with a move much lower. Keep trading with stops in place and be ready to reduce positions if the market shows weakness.
Good luck, stay healthy, and trade safe!
Notes
- The Market Week in Review is my weekend homework where I look over what happened in the previous week and what might come in the next week.
- I occasionally have some errors or typos and will correct them in my blog or the comments on TradingView. I do not have an editor and do this in my free time.
- If you find this helpful, please let me know in the comments. I am also more than happy to add new perspectives and data points if you have ideas.
The structure is the following:
- A recap of the daily updates that I do here on TradingView.
- View on the past week
- What's coming in the next week
- The Bullish View, The Bearish View
- Key index levels to watch out for
- Wrap-up
If you have been following my daily updates, you can skip down to "View on the Week." If not, then this first part is a great play-by-play recap for the week. Click the daily charts for more detail on sectors, indexes, and market leaders each day.
-=x=-=x=-=x=-=x=-=x=-=x=-=x=-
Monday, July 26, 2021

Facts: +0.03%, Volume higher, Closing range: 69%, Body: 27%
Good: Slight gain on higher volume, healthy pause
Bad: A/D low but not surprising with sideways move
Highs/Lows: Higher high, higher low
Candle: Thin green body in the middle of a short candle
Advanced/Decline: 0.57, almost two declining stocks for every advancing stock
Indexes: SPX (+0.24%), DJI (+0.24%), RUT (+0.33%), VIX (+2.33%)
Sectors: Energy (XLE +2.47%) and Materials (XLB +0.84%) at the top. Industrials (XLI -0.05%) and Health (XLV -0.65%) were bottom.
Expectation: Sideways or Higher
Small caps had a volatile start to the week, gaining on Monday morning and losing those gains by mid-day. Still, the gains were enough for all the major indices to advance today as investors look forward to a massive earnings week.
The Nasdaq closed the day with a small +0.03% gain. It traded up and down throughout the day but stayed within a tight range. Volume was higher for the day. A thin green body sits in the middle of the short candle, with equal upper and lower wicks. The closing range was 69%. There were almost two declining stocks for every advancing stock.
-=x=-=x=-=x=-=x=-=x=-=x=-=x=-
Tuesday, July 27, 2021

Facts: -1.21%, Volume lower, Closing range: 51%, Body: 48%
Good: Lower volume on pullback, longer lower wick from bounce at 14,500 support.
Bad: Lower high, lower low, dip below 21d EMA
Highs/Lows: Lower high, lower low
Candle: Half red body above half lower wick, no upper wick
Advanced/Decline: 0.28, more than three declining stocks for every advancing stock
Indexes: SPX (-0.47%), DJI (-0.24%), RUT (-1.13%), VIX (+10.01%)
Sectors: Utilities (XLU +1.72%) and Real Estate (XLRE +0.80%) at the top. Consumer Discretionary (XLY -1.01%) and Communications (-1.19%) were bottom.
Expectation: Sideways or Lower
Earnings reports releasing this week have been very positive, but investors are already looking beyond the reports to expectations for the second half of the year. With mounting fears around the new Delta variant of COVID and potential changes in monetary policy by the Fed, all major indexes retreated today.
The Nasdaq closed with a -1.21% loss in a session that was mostly selling before a bounce at the 14,500 support level. Volume was lower than the previous day. The bounce brought the index back up to the middle of the candle for a 51% closing range. The 48% red body is in the upper half of the candle, over a long lower wick. There were more than three declining stocks for every advancing stock.
-=x=-=x=-=x=-=x=-=x=-=x=-=x=-
Wednesday, July 28, 2021
Facts: +0.70%, Volume lower, Closing range: 76%, Body: 31%
Good: Rally in morning and afternoon to close with gain, A/D ratio above 1.0
Bad: Lower high, lower volume, dip at end of day
Highs/Lows: Lower high, higher low
Candle: Inside day, slightly longer lower wick
Advanced/Decline: 2.0, two advancing stocks for every declining stock
Indexes: SPX (-0.02%), DJI (-0.36%), RUT (+1.51%), VIX (-5.43%)
Sectors: Energy (XLE +0.91%) and Communications (XLC +0.78%) at the top. Utilities (XLU -0.76%) and Consumer Staples (XLP -0.88%) at the bottom.
Expectation: Sideways
Investors survived another Fed meeting with stocks gaining after the Fed left monetary policy untouched but confirmed the economy is still on track and inflation appears transitory. Small caps and growth stocks soared while only a few of the SPDR sectors registered gains.
The Nasdaq dipped at open but recovered quickly and ended the day with a +0.70% gain. Volume was lower for the day, but the 76% closing range and 31% green body are positive outcomes on an Inside day (lower high, higher low). The lower wick is slightly longer than the upper wick. There were two advancing stocks for every declining stock.
-=x=-=x=-=x=-=x=-=x=-=x=-=x=-
Thursday, July 29, 2021
Facts: +0.11%, Volume lower, Closing range: 23%, Body: 10%
Good: Higher high and higher low, A/D ratio
Bad: Long upper wick relative to body as early gains faded
Highs/Lows: Higher high, higher low
Candle: Thin body at the bottom of candle with long upper wick
Advanced/Decline: 1.41, more advancing stocks than declining stocks
Indexes: SPX (+0.42%), DJI (+0.44%), RUT (+0.68%), VIX (-3.22%)
Sectors: Consumer Discretionary (XLY +1.13%) and Materials (XLB +1.10%) at the top. Real Estate (XLRE -0.30%) and Communications (XLC -1.08%) at the bottom.
Expectation: Sideways
GDP growth was less than expected this morning while employment data confirmed the Fed's message that there is still more work to do in the economic recovery. That wasn't necessarily a bad thing for equities, as it means economic support will continue for some time.
The Nasdaq closed the day with a +0.11% but gave back intra-day gains, creating a long upper wick over a thin green body. Volume was lower for the day. The closing range of 23% and 10% green body at the bottom of the candle represents a failed attempt to rally today, but the A/D ratio shows some broader gains under the surface.
-=x=-=x=-=x=-=x=-=x=-=x=-=x=-
Friday, July 30, 2021

Facts: -0.71%, Volume lower, Closing range: 50%, Body: 50%
Good: Bounce off 21d EMA and did not revisit low
Bad: Could not hold intraday high from morning rally
Highs/Lows: Lower high, lower low
Candle: Half green body at the bottom of the candle, no lower wick
Advanced/Decline: 0.45, two declining stocks for every advancing stock
Indexes: SPX (-0.54%), DJI (-0.42%), RUT (-0.62%), VIX (+2.94%)
Sectors: Materials (XLB +0.41%) and Real Estate (XLRE +0.32%) at the top. Energy (XLE -1.59%( and Consumer Discretionary (XLY -2.06%) at the bottom.
Expectation: Sideways
A disappointing earnings report from Amazon weighed down major indexes, but inflation data came in less than expected, helping give the market a boost in the morning.
The Nasdaq closed the day with a -0.71% loss to end the week. Volume was lower and declining every day this week since Monday's all-time high in the index. The 50% green body sits at the bottom of the candle with no lower wick. The upper wick formed in the morning rally, but the index could not hold onto the intraday high. There were two declining stocks for every advancing stock.
-=x=-=x=-=x=-=x=-=x=-=x=-=x=-
View on the Week
This week's story has many parts, including Chinese stocks, Earnings Reports, the Infrastructure Bill, and a two-day Fed meeting which all ended with advances in small-caps and gains in commodity prices. Each made its influence felt across the market as investors shifted to respond to the implications of each.
Chinese stocks were already on a slide downward coming into the week. China started a regulatory crackdown on companies listed in foreign exchanges that started with the IPO of ride-hailing company Didi a few weeks ago. After several days of losses last week, the stocks opened the week again this week. They seemed to hit bottom and bounce mid-week, but the gains were gone by the end of the week.
Earnings reports mainly were spectacular, but the responses by investors were inconsistent. Look to the results of the largest four mega-caps as an example. On Tuesday, Apple, Alphabet, and Microsoft released their earnings reports after the market closed. All three smashed expectations, which were already high given the height of the pandemic was one year previous. Yet, Apple and Microsoft sold off after hours while Google gained 3%. Microsoft recovered most of the loss the following day, but Apple could not.
The reactions represent a still very nervous market. Even as companies turn in great results, the big fears of the year continue to be top of mind. Examples are supply chain pressures for Apple and a potential slow-down in Q3 of demand for Microsoft compared to the previous year. One area that isn't a concern is the advertising business, which is booming and helped send Alphabet yet higher.
Tesla pleased investors with their earnings report on Monday, sending the stock up over 6% for the week. One company that did not please investors was Amazon. Although the company had great results, the outlook for the year did not meet expectations. The mega-cap dropped 7% on Friday and brought the major indexes down with it.
The Fed had a two-day meeting this week and released a statement on Wednesday. The tone struck the right balance for investors. The economic recovery is on track, but there was more work to do, and so they would not change the anticipated timing of tapering. They noted inflation was still a concern but still held firm that the inflationary conditions are transitory. That sent the indexes higher on Wednesday.
The new all-time high on Monday and subsequent pullback still have double-top potential. 14,200 is the critical level to watch for this week if there is a further pullback.
The Nasdaq declined -1.11% for the week after getting a new all-time high on Monday. The result is a higher high and higher low and a not-so-terrible closing range of 47%. Volume was lower than the previous week.
The market was good for small-caps this past week. With investors pulling profits out of the mega-cap stocks and the Fed keeping a supportive but hawkish stance, the Russell 2000 (RUT) ended the week with gains while the other major indexes declined. The RUT gained +0.75% for the week. The S&P 500 (SPX) lost -0.37%, while the Dow Jones Industrial Average (DJI) declined -0.36%.
The VIX volatility advanced +6.05% for the week.

Materials ( XLB ) was the top sector of the week as manufacturing and core durable goods data showed increase demand and was confirmed in consumer spending numbers. At the same time, the Infrastructure bill moved closer to becoming law. The growth in the sector was matched by increased prices in metal commodities required to support economic expansion.
Energy ( XLE ) started the week strong and led several days throughout the week but ended in second place behind Materials at the end of the week.
The three worst sectors were the growth sectors, all losing for the week. Technology ( XLK ), Communication Services ( XLC ), and Consumer Discretionary ( XLY ) were at the bottom of the weekly sector list.
Yields for the US 30y, 10y, and 2y Treasuries all dropped for the week. The yields continue to slide, and the gap between long-term and short-term yields is tightening.
Both High Yield Corporate Bond (HYG) prices declined, and Investment Grade Bond (LQD) prices advanced. Both remain high as demand for higher yield continues to push investors toward riskier corporate bond investments.
The US Dollar (DXY) declined -0.88% for the week. The index fell sharply after the Fed's statements on Wednesday.
Silver (SILVER) advanced +1.16%, and Gold (GOLD) advanced +0.71%, mostly reacting to moves in the USD.
Crude Oil (CRUDEOIL1!) advanced +2.76%.
Timber (WOOD) advanced +0.17%.
Copper (COPPER1!) declined -1.18%.
Aluminum (ALI1!) advanced +3.67%.
-=x=-=x=-=x=-=x=-=x=-=x=-=x=-
Big Four Mega-caps
Only Alphabet (GOOGL) gained among the big four this week, advancing +1.29% on a solid performance in the advertising business, helping the entire communications sector. Apple (AAPL) and Microsoft (MSFT) declined -1.82% and -1.64% but remained above the key weekly moving average lines. Amazon (AMZN) disappointed investors on Thursday, falling -9.00% for the week. The stock closed the week below its 10w moving average line.
-=x=-=x=-=x=-=x=-=x=-=x=-=x=-
The Four Recovery Stocks
I picked four recovery stocks to track against the indexes and other indicators in this weekly report. Marriot (MAR) was the top performer among the four this week, advancing +4.89% and moving back above its 10w moving average line. Exxon Mobil (XOM) gained +0.93% but remained below the 10w line. Carnival Cruise Lines (CCL) and Delta Airlines (DAL) both had losses this week and traded below the 10w moving average and 40w moving average lines.
-=x=-=x=-=x=-=x=-=x=-=x=-=x=-
Cryptocurrency
I started tracking four major cryptocurrencies on the week in review. The four are Bitcoin, Ethereum, Litecoin, and Bitcoin Cash. The latter two are not the largest by market cap but seem to be well-known and are part of the CIX capital.com index, tracking five cryptocurrencies, including these four (Ripple is the fifth).
The cryptocurrencies continued to rebound from lows two weeks ago. Bitcoin (BTCUSD) gained +12.52% this week. Ethereum (ETHUSD) climbed by +16.53%. Litecoin (LTCUSD) advanced +9.81%. Bitcoin Cash (BCHUSD) rose +15.55%. Bitcoin and Ethereum are trading above the key moving averages, with Ethereum showing the best trend as the 10w line is above the 40w line.
-=x=-=x=-=x=-=x=-=x=-=x=-=x=-
Investor Sentiment
The put/call ratio (PCCE) rose above 0.8 on Tuesday but ended the week at 0.668.
The CNN Fear & Greed Index moved back into the Extreme Fear level.
The NAAIM money manager exposure index moved up to 78.39.
-=x=-=x=-=x=-=x=-=x=-=x=-=x=-
The Week Ahead
It will be another big week of earnings reports.
There are a lot of earnings reports, and I won't try to list them all here. Check your portfolio for earnings events to prevent surprises.
Monday
The ISM will release manufacturing purchasing managers index data on Monday.
HSBC (HSBC), Mitsubishi UFJ (MUFG), Heineken (HEINY), and Zoominfo (ZI) are a few of the earnings reports for Monday.
Tuesday
Factory Orders data will be available in the morning, with the API Weekly Crude Oil Stock data coming after the market close.
Alibaba (BABA), Eli Lilly (LLY), Amgen (AMGN), Fidelity (FIS), Marriott (MAR), Match Group (MTCH), Occidental (OXY), Ringcentral (RNG), LYFT (LYFT), Hyatt (H), and Skillz (SKLZ) are some of the many earnings reports for Tuesday.
Wednesday
Several economic indicators will get updates tomorrow. Mortgage data will be available early in the morning. Then Nonfarm Employment Change data will give an update on the labor market. Purchase Manager Index data for Services will show growth for the services sector, while Non-Manufacturing purchasing manager index data will provide a broader look at economic activity. Finally, Crude Oil Inventories get an update later in the morning.
Toyota Motor (TM ), Sony (SONY), CVS (CVS), Booking (BKNG), General Motors (GM), Uber (UBER), Roku (ROKU), Allstate (ALL), Etsy (ETSY), AMC Entertainment (AMC), Fastly (FSLY), Lemonade (LMND), and DermTech (DMTK) are some of the exciting earnings reports for Wednesday.
Thursday
Initial Jobless Claims gets an update on Thursday. We will also get new Exports, Imports, and Trade Balance data.
Novo Nordisk (NVO), Moderna (MRNS), Square (SQ), MercadoLibre (MELI), Cloudflare (NET), DataDog (DDOG), Zillow (Z), Penn National Gaming (PENN), Zynga (ZNGA), Virgin Galactic (SPCE), and Redfin (RDFN) report earnings. Many of these and others not listed had tremendous growth over the past year, and investors will be watching the year-over-year comparisons closely to see if growth continues at the same or similar pace.
Friday
More employment data will be available on Friday morning, including Average Hourly Earnings, Nonfarm Payrolls, and the Unemployment Rate.
Interesting earnings reports for Friday include DraftKings (DKNG) and Riot Blockchain (RIOT).
-=x=-=x=-=x=-=x=-=x=-=x=-=x=-
The Bullish Side
Despite the pullback in the indexes this week, prices remain near all-time highs. The Fed reaffirmed steady progress for the economic recovery while stating that there is still more support needed and they would not change monetary policy in the short term. There is also some indication in pricing data that inflation is slowing down a bit, lending support toward the Fed's statements that it is transitory.
Companies continue to receive support in low-interest rates and are turning that into growth opportunities. In particular, small caps are viewed as benefiting from the current economic cycle. While large-caps are seeing some profit-taking among investors, those investments are rotating back into small-caps.
Commodity prices, especially Oil and Aluminum, are showing the bullishness among investors on economic growth. Aluminum is a metal required across many sectors of manufacturing, from consumer products to industrial applications. The demand for oil is increasing, raising oil prices and helping the Energy sector recover from recent selling.
-=x=-=x=-=x=-=x=-=x=-=x=-=x=-
The Bearish Side
The Delta variant of COVID is a top concern among investors. Statements made this weekend by leaders in D.C. stated there would not be another lockdown, but that does not mean there won't be any impact on the rising cases even among the vaccinated. Bad news here could send the indexes back into volatility and send prices lower.
As earnings reports pass and investors look toward Q3, they may see a top here for many companies. The comparable year-over-year performance is favorable in Q2, but the expectation is that this growth will slow down in Q3. Time to take profits?
-=x=-=x=-=x=-=x=-=x=-=x=-=x=-
Key Nasdaq Levels to Watch
The Nasdaq set another all-time high this week after moving back above the 21d EMA. If the index pulls back, the most critical level is around 14,200. A break below that level would signal a bearish double-top pattern.
On the positive side, the levels are:
- The high of this past week was a new all-time high at 14,863.65.
- The round number 15,000 is likely to be a new area of resistance.
On the downside, there are a few key levels:
- The 10d MA is at 14,664.22.
- The 21d EMA is at 14,597.11.
- 14,503.76 is the low of the past week.
- 14,500 support area was tested this past week and held.
- The 50d MA is at 14,262.13.
- 14,200 remains a critical level that would signal a bearish double top. 14,178.66 is the pivot low for the technical pattern.
- 14,000 has been an area of support/resistance.
- There is a pivot at 13,548.93.
-=x=-=x=-=x=-=x=-=x=-=x=-=x=-
Wrap-up
It's never an easy ride when the indexes are making new all-time highs. Investors are waiting for an overdue correction but not wanting to exit just in case the markets move another leg up. Right now, with the Fed support, low interest rates, and outstanding performance of earnings reports, I would lean toward a bullish outlook. The fact that investor sentiment is in extreme fear is often contrarian to what happens.
At the same time, there is always the possibility for a double-top pattern here with a move much lower. Keep trading with stops in place and be ready to reduce positions if the market shows weakness.
Good luck, stay healthy, and trade safe!