The Nasdaq Week in Review is my weekend homework where I look over what happened in the previous week and what might come in the next week. It helps me evaluate my observations, recognize new data points, and create a plan for possible scenarios in the future.
If you find this helpful, please let me know in the comments. I am also more than happy to add new perspectives and data points if you have ideas.
The structure is the following:
- A recap of the daily updates that I do here on TradingView.
- The Meaning of Life, a larger view on the past week
- What's coming in the next week
- Key index levels to watch out for
- Wrap-up
If you have been following my daily updates, you can skip down the “The Meaning of Life”. If not, then this first part is a great play-by-play recap for the week.
-=x=-=x=-=x=-=x=-=x=-=x=-=x=-=x=-=x=-=x=-=x=-=x=-=x=-=x=-=x=-=x=-=x=-=x=-=x=-=x=-=x=-=x=-=x=-=x=-
Monday, October 26, 2020
Hold tight, we're in for nasty weather
Burning down the house
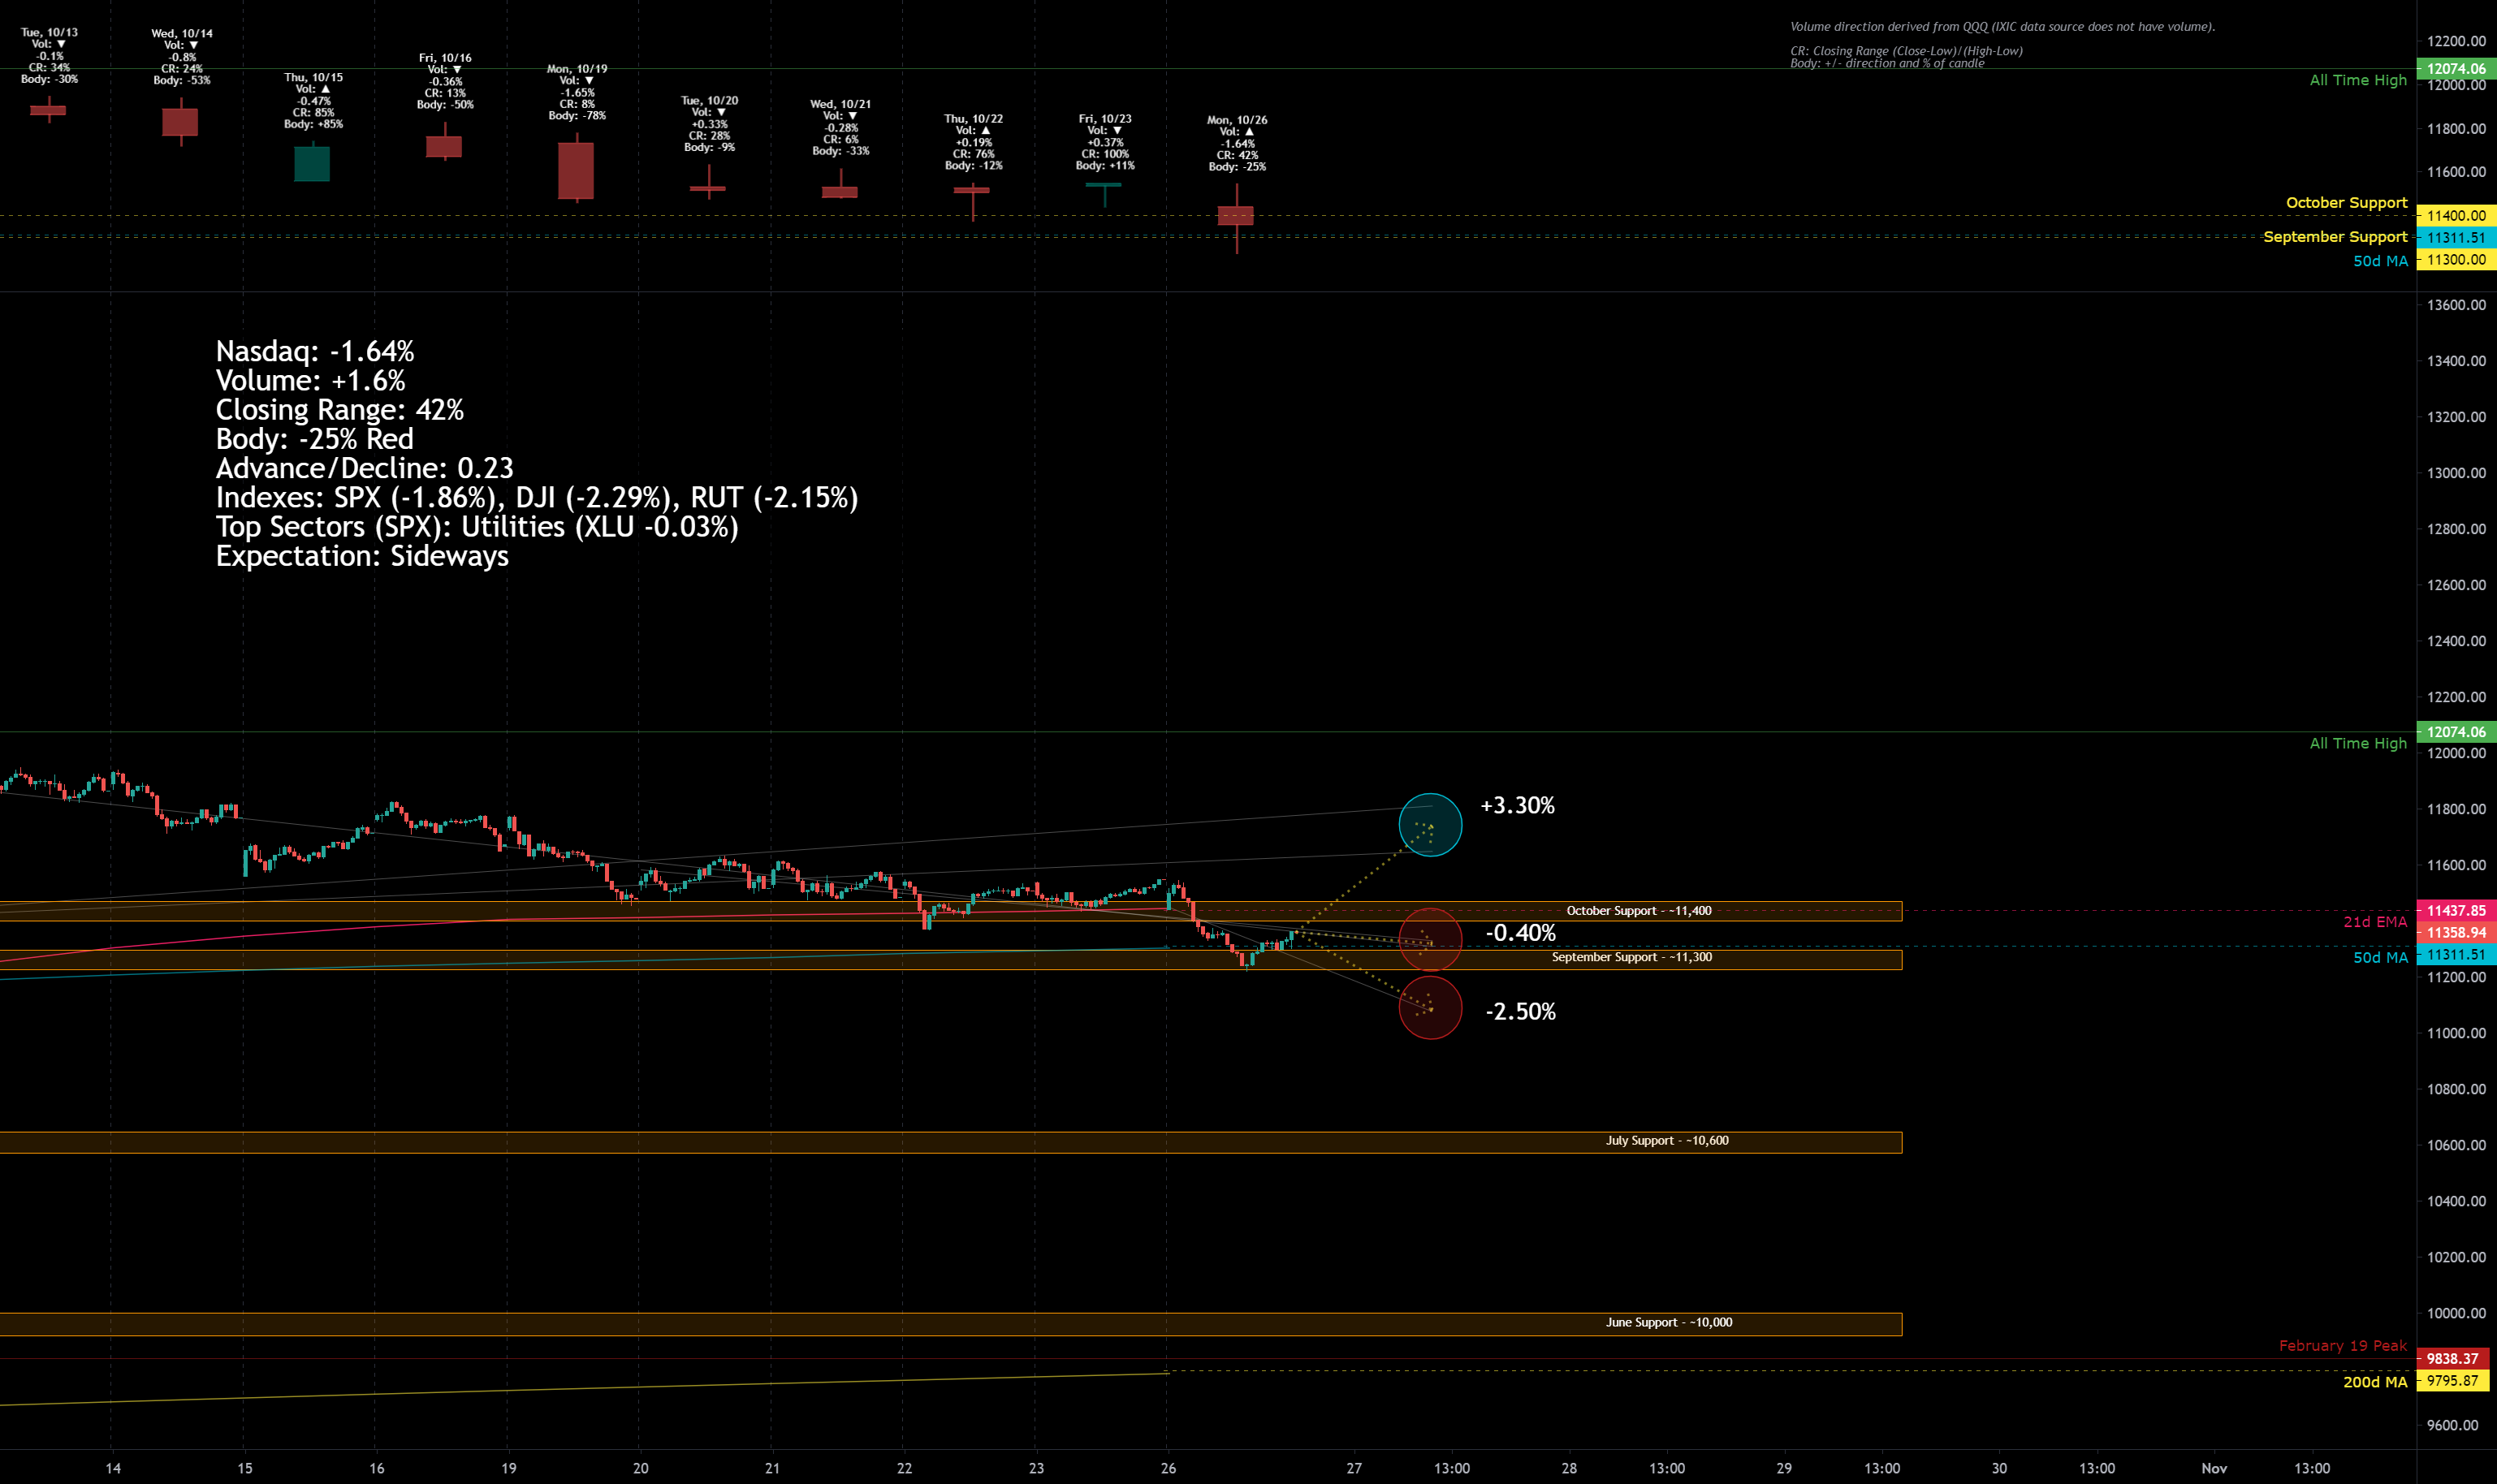
Facts: -1.64% higher, Volume higher, Closing range: 42%, Red Body: -25%
Good: Support at the end of the day, brought the index back over 50d MA
Bad: Everything else, gap down, closed below the 21d EMA and took a visit below the 50d MA
Highs/Lows: Lower high, lower low
Candle: A large body for a spinning top , but nonetheless shows clearer the action from bears and bulls.
Advance/Decline: 0.23, more than 4 decliners for every advancer
Sectors: All sectors down with Utilities ( XLU ) performing best, holding to a -0.03% loss. Energy ( XLE ) was the worst sector with a -3.59%, erasing gains from last week. Keeping an eye on Technology ( XLK ) this week, it’s near the middle of the sector list with a -2.17% loss and underperforming the SPX .
Expectation: Sideways
Well, crap. Welcome to Monday. News over the weekend reset expectations coming into the morning, but there was still hope that support would firm up and it initially did that as the market opened, coming close to Friday’s high. Then the reversal, 30 minutes into trading, came after New Home Sales data disappointed and it was a long slide from there. At 1:30p, the Nasdaq was down nearly 3% and below the key 50d MA support line. At that point, the bulls came in and brought it back to end the day with a -1.64% loss. The candle looks like a spinning top , albeit a fat one, with a 25% red body and a 42% closing range. There were more than four declining stocks for every advancing stock. Volume was slightly higher than Friday, but still well below recent average volume . The index closed below the 21d EMA for the first time since 9/25.
The S&P500 had a slightly different character with no morning gains. It was all downhill most of the day, with some buying in the afternoon to finish at -1.86% loss. All sectors finished with a loss, but Utilities ( XLU ) held up the best with only a -0.03% loss. This has been the safe haven sector for investors to stay in the market, instead of going to bonds or commodities . Health ( XLV -1.11%), Consumer Staples ( XLP -1.28%), Real Estate ( XLRE -1.21%) all outperformed the broader index. The first two likely because of pandemic news and the third benefiting from the drop in new home sales ( XLRE is dominated by management companies, that benefit from less demand and cheaper prices in real estate). The Russell 2000 (RUT -2.15%) wiped away all gains from the previous week, performing almost as bad as the Dow Jones Industrial (DJI -2.29%).
Treasury Bond spreads shrunk but remained in an upward channel from the last few weeks.
The mega-caps had a mixed day. Microsoft ( MSFT -2.84%) closed well below it’s 50d MA line, likely being impacted by SAP (SAP -23.16%) that revised guidance downward over the weekend, sending a signal there may be trouble in enterprise software. Google ( GOOG -3.08%) gave up about half of it’s gains from last week. Apple ( AAPL +0.01%) and Amazon ( AMZN +0.08%) faired a bit better, ending the day with small gains, although both are holding below key indicators of 21d EMA and 50d MA. The storied stock from last week, Snap (SNAP -4.40%) finally gave up some profits, while there was a lot of carnage with other growth stocks. There were some positive stories among growth stocks. Deckers Outdoor (DECK +2.58%), Shopify (SHOP +1.15%), ZScaler (ZS +1.33%), Zoom Video (ZM +1.23%), Wayfair (W +2.07%) all had good days while the market was struggling.
Microsoft ( MSFT ) and AMD ( AMD ) earnings after close tomorrow. Core Durable Goods Orders data comes in before market and Consumer Confidence data at 10:00am.
I’ll start with the positive trend lines , although I think some sideways action is in order after a negative expectation breaker day. Nonetheless, unexpected news can help put some positive gains in the market. With enough energy, the index could find its way back to the correction regression trend line (which is still on an upward slope) and the trend from the 9/24 bottom. That would be an unlikely +3.30% gain.
The index landed below the 21d EMA , but above the 50d MA. This provides both a resistance and support point that points to a sideways move. The trend line from the 10/12 pivot day, points to a -0.40% loss that keeps the index within this channel. The one day trend points to more losses and would result in -2.50% loss.
-=x=-=x=-=x=-=x=-=x=-=x=-=x=-=x=-=x=-=x=-=x=-=x=-=x=-=x=-=x=-=x=-=x=-=x=-=x=-=x=-=x=-=x=-=x=-=x=-
Tuesday, October 27, 2020
You shake my nerves and you rattle my brain
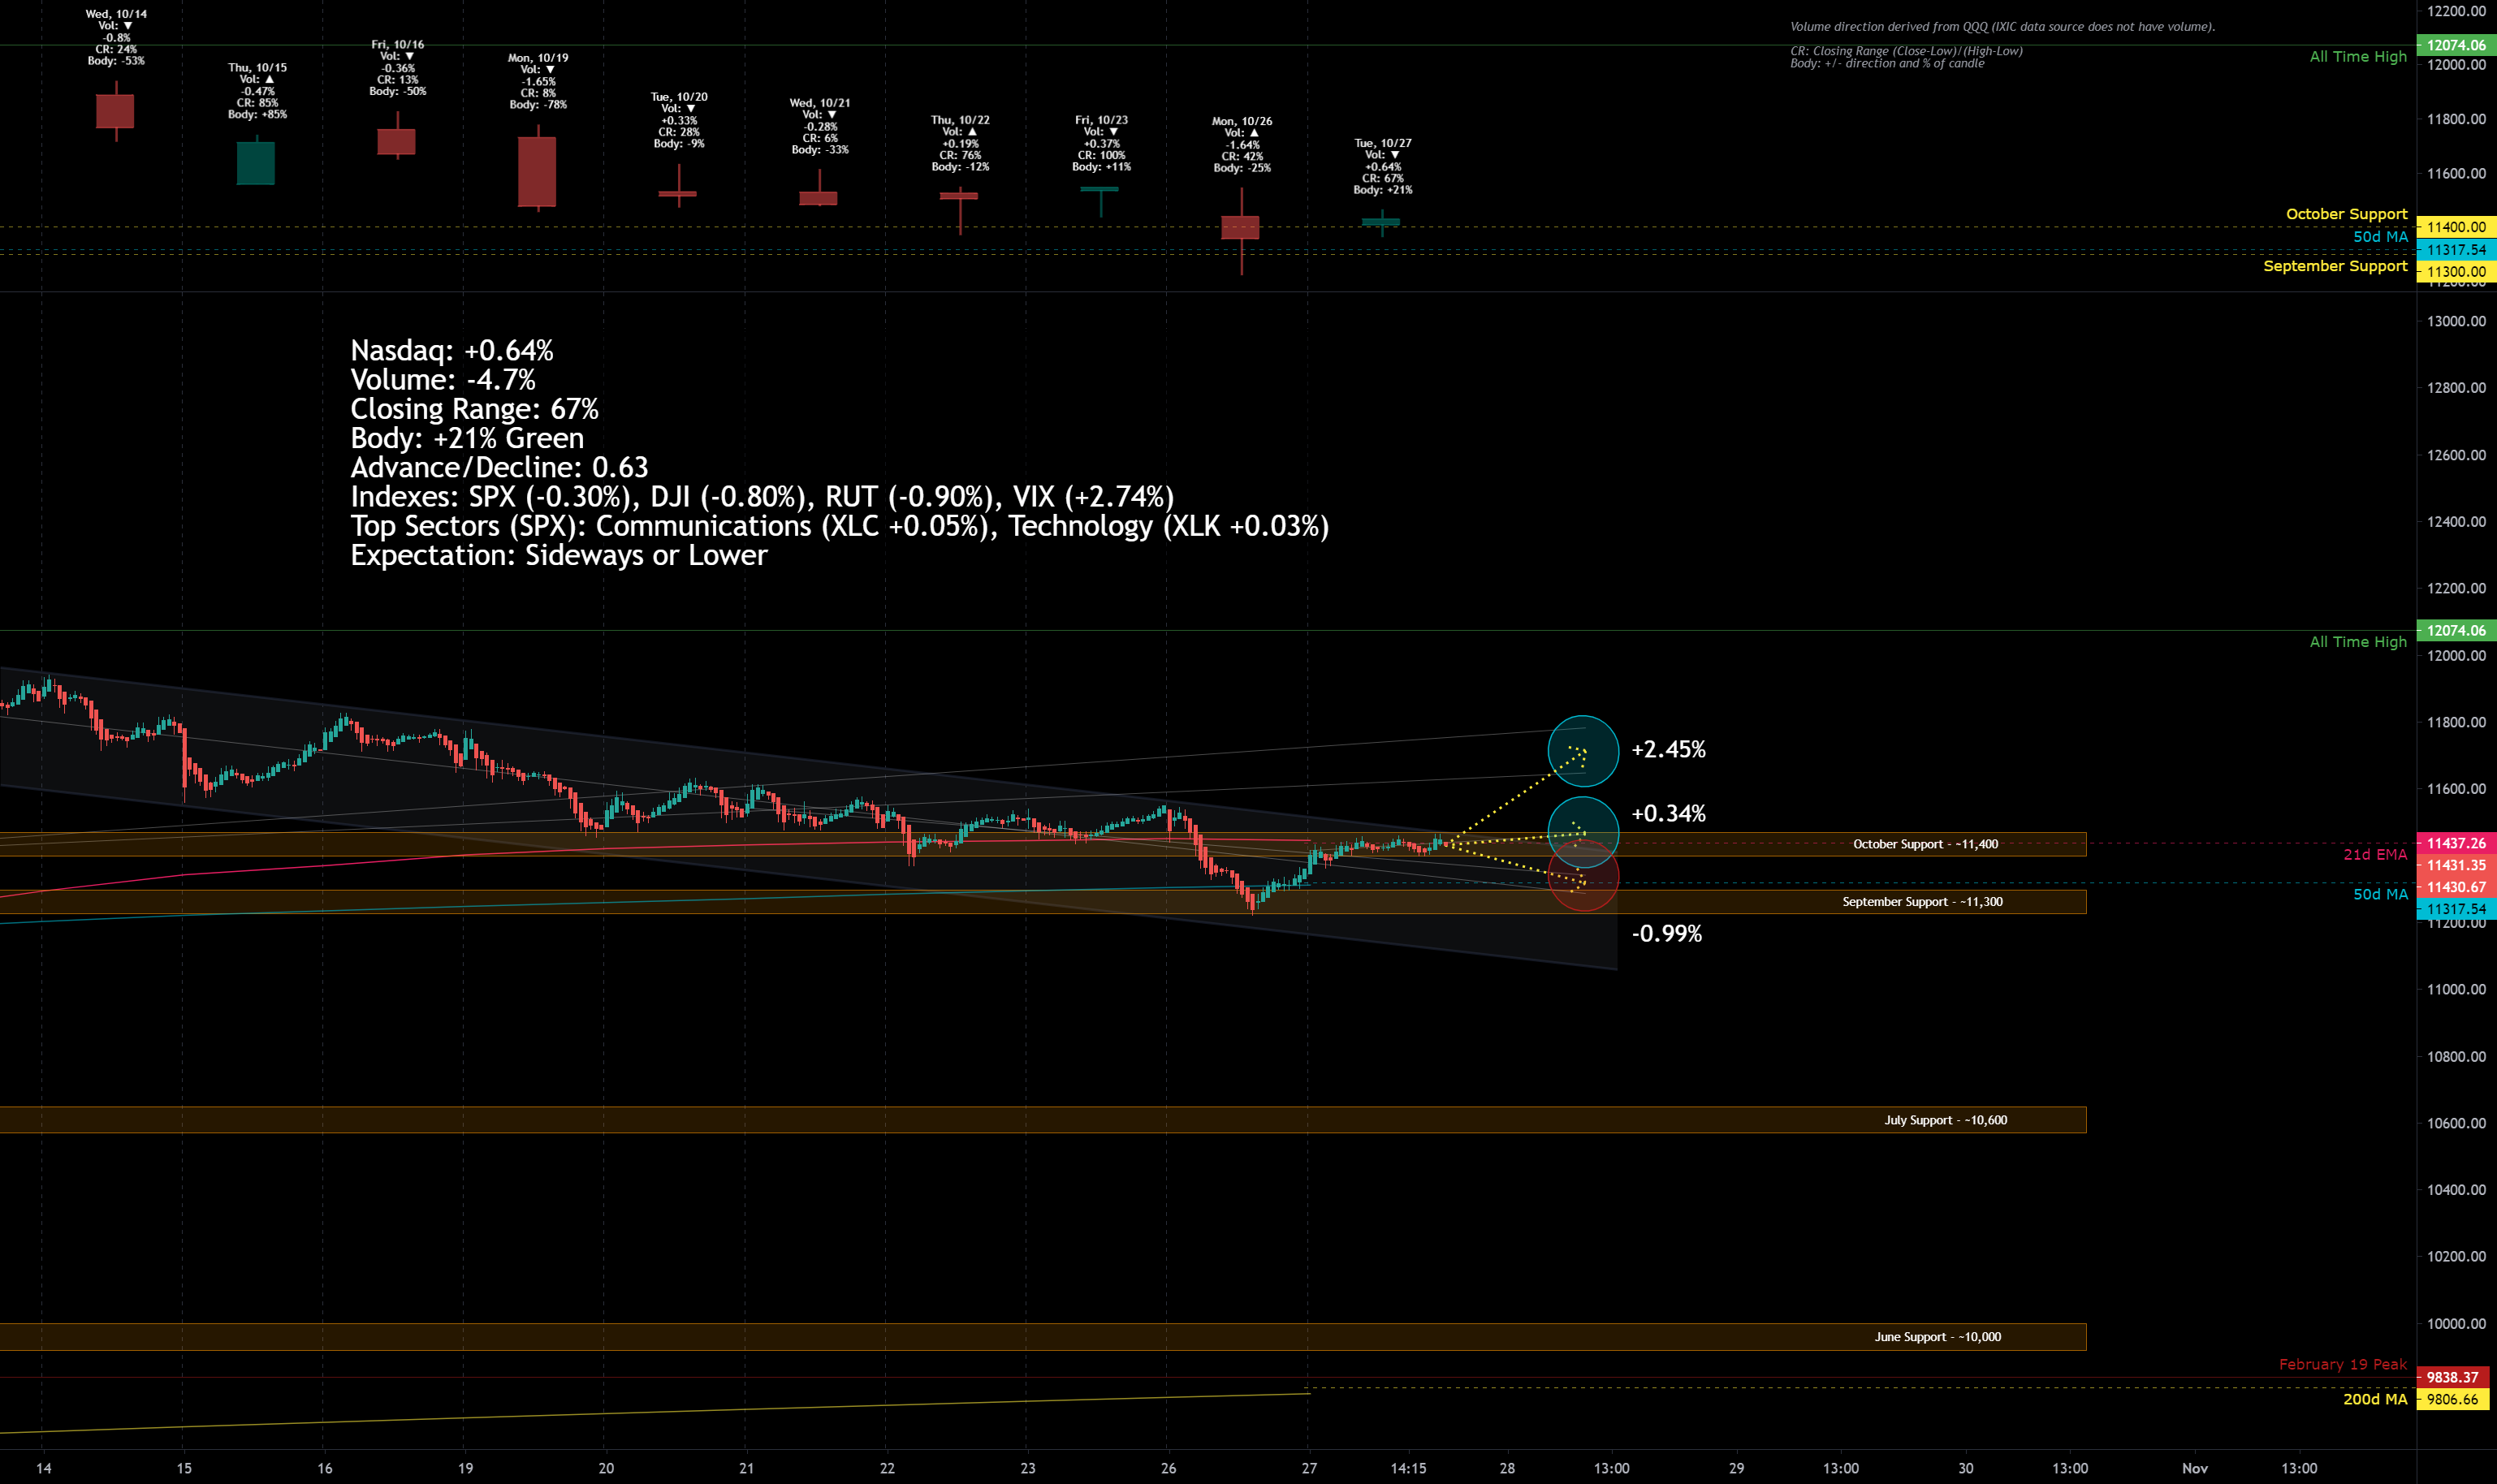
Facts: +0.64% higher, Volume lower, Closing range: 67%, Green Body: +21%
Good: Upward trend most of the day, staying above the 50d MA
Bad: Could not stay above the 21d EMA
Highs/Lows: Lower high, higher low, inside day
Candle: An inside day with a small green body, nearly identical upper and lower wicks
Advance/Decline: 0.63, 3:2 decliners to advancers
Sectors: Communications ( XLC ) and Technology ( XLK ) performed best. All other sectors lost, with Industrials ( XLI ) and Financials ( XLF ) performing worst.
Expectation: Sideways or Lower
The follow-up to a terrible Monday was an inside day with gains in the Nasdaq while the rest of the market continued to melt down among mixed signals from a positive Durable Goods report, but an unexpected dip in Consumer Confidence. The Nasdaq ended the day up +0.64% higher, driven by big tech and hot communications sector stocks. The day was a bit choppy, but the overall channel for the day was upward. The index poked above its 21d EMA four times but settled at the end of the day just below the key line. The candle is inside the highs and lows of the previous day which typically is a continuation (vs a reversal). Keeping that in mind, it did close in the 67% range of the candle with a green 21% body. There were many more declining stocks than advancing stocks at a ratio of 3:2 (the ratio is worse in the broader NYSE). Volume was lower and continues to be much lower than recent average volume . The index closed below the 21d EMA , but above the 50d MA, both key lines that investors commonly watch.
The S&P500 ( SPX -0.30%) and Dow Jones Industrial (DJI -0.80%), had decidedly bearish inside days, spending most of the day trading below their 50d MA. The Russell 2000 (RUT -0.90%) also had another loss, falling below the 21d EMA . Communication Services ( XLC +0.64%) was the best sector of the day, driven by gains from Facebook ( FB +2.23%) and Google ( GOOG +0.87%). Technology ( XLK +0.50%) sector also had a great day but was driven mostly by the larger stocks Apple ( AAPL +1.35%) and Microsoft ( MSFT +1.51%). All other sectors lost on the day with Industrial ( XLI -2.19%) and Financial ( XLF -1.83%) sectors ending the day with the worst performance. Utilities ( XLU -0.08%) had early gains and topped the sector list at times, then faded near close.
The VIX volatility index increased +2.74% for another gain on top of Monday's surge. The key indicator is now up over 20% for the week and nearing the early September highs.
Treasury Bond spreads shrunk for another day. This is something to keep an eye on, but the spread is still in an upward trend channel from an August pivot .
The real winners of the day were the mega-caps. Microsoft ( MSFT +1.51%), Apple ( AAPL +1.35%), Google ( GOOG +0.87%), Amazon ( AMZN +2.47%), Tesla ( TSLA +1.05%) and Facebook ( FB +2.23%) all turned in solid gains for the day. Microsoft and Apple still closed below their 21d EMA , but Amazon regained this key support to join Google above the line. Facebook has a nice base forming heading into earnings . Beyond the mega-caps, the performance is mixed among favorite growth stocks. Dexcom ( DXCM -8.94%), Draft Kings ( DKNG +2.49%), Workhorse Group ( WKHS -6.91%), AMD (-4.07%) were among the losers. Pinterest (PINS +4.08%), Etsy ( ETSY +4.33%), Peloton (PTON +2.58%) and Datadog ( DDOG +1.57%) were some of the winners. Notice these lists of winners and losers among the favorite growth stocks is rotating at an accelerated space.
Microsoft ( MSFT ) and AMD ( AMD ) reported earnings with Microsoft down -1.71% and AMD up +0.34% in afterhours trading, despite both beating expectations. Tomorrow’s reports will include Mastercard (MA) and Visa (V), Boeing (BA), and ServiceNow (NOW) which will all be significant, with several reporting before market open. In economic news, Crude Oil Inventories will be announced at 10:30a.
Continuing today’s trend direction would result in a +0.34% gain tomorrow, taking the index back above the 21d EMA and signaling some recovery from the recent downtrend. Better news from stimulus talks or coronavirus treatments could accelerate that to meet up with the longer trend lines at +2.45%.
The index is still trading below the 21d EMA and above the 50d MA which seems to be a channel for now. In addition, there is a channel that formed from the 10/12 pivot day with a well-defined upper and lower channel line. Following the channel and the regression trend from the 10/12 pivot day as well as the 5d trend, would mean a -0.99% loss and land the index right above the 50d MA.
I'm keeping the June Support line in view, but its ~12.5% below the Tuesday close and there are 3 key support levels that the index would have to break thru. If we have a significant downside that takes the index below 11,300 again, then I'll add that possibility back to the chart.
-=x=-=x=-=x=-=x=-=x=-=x=-=x=-=x=-=x=-=x=-=x=-=x=-=x=-=x=-=x=-=x=-=x=-=x=-=x=-=x=-=x=-=x=-=x=-=x=-
Wednesday, October 28, 2020
Let down and hanging around
Crushed like a bug in the ground
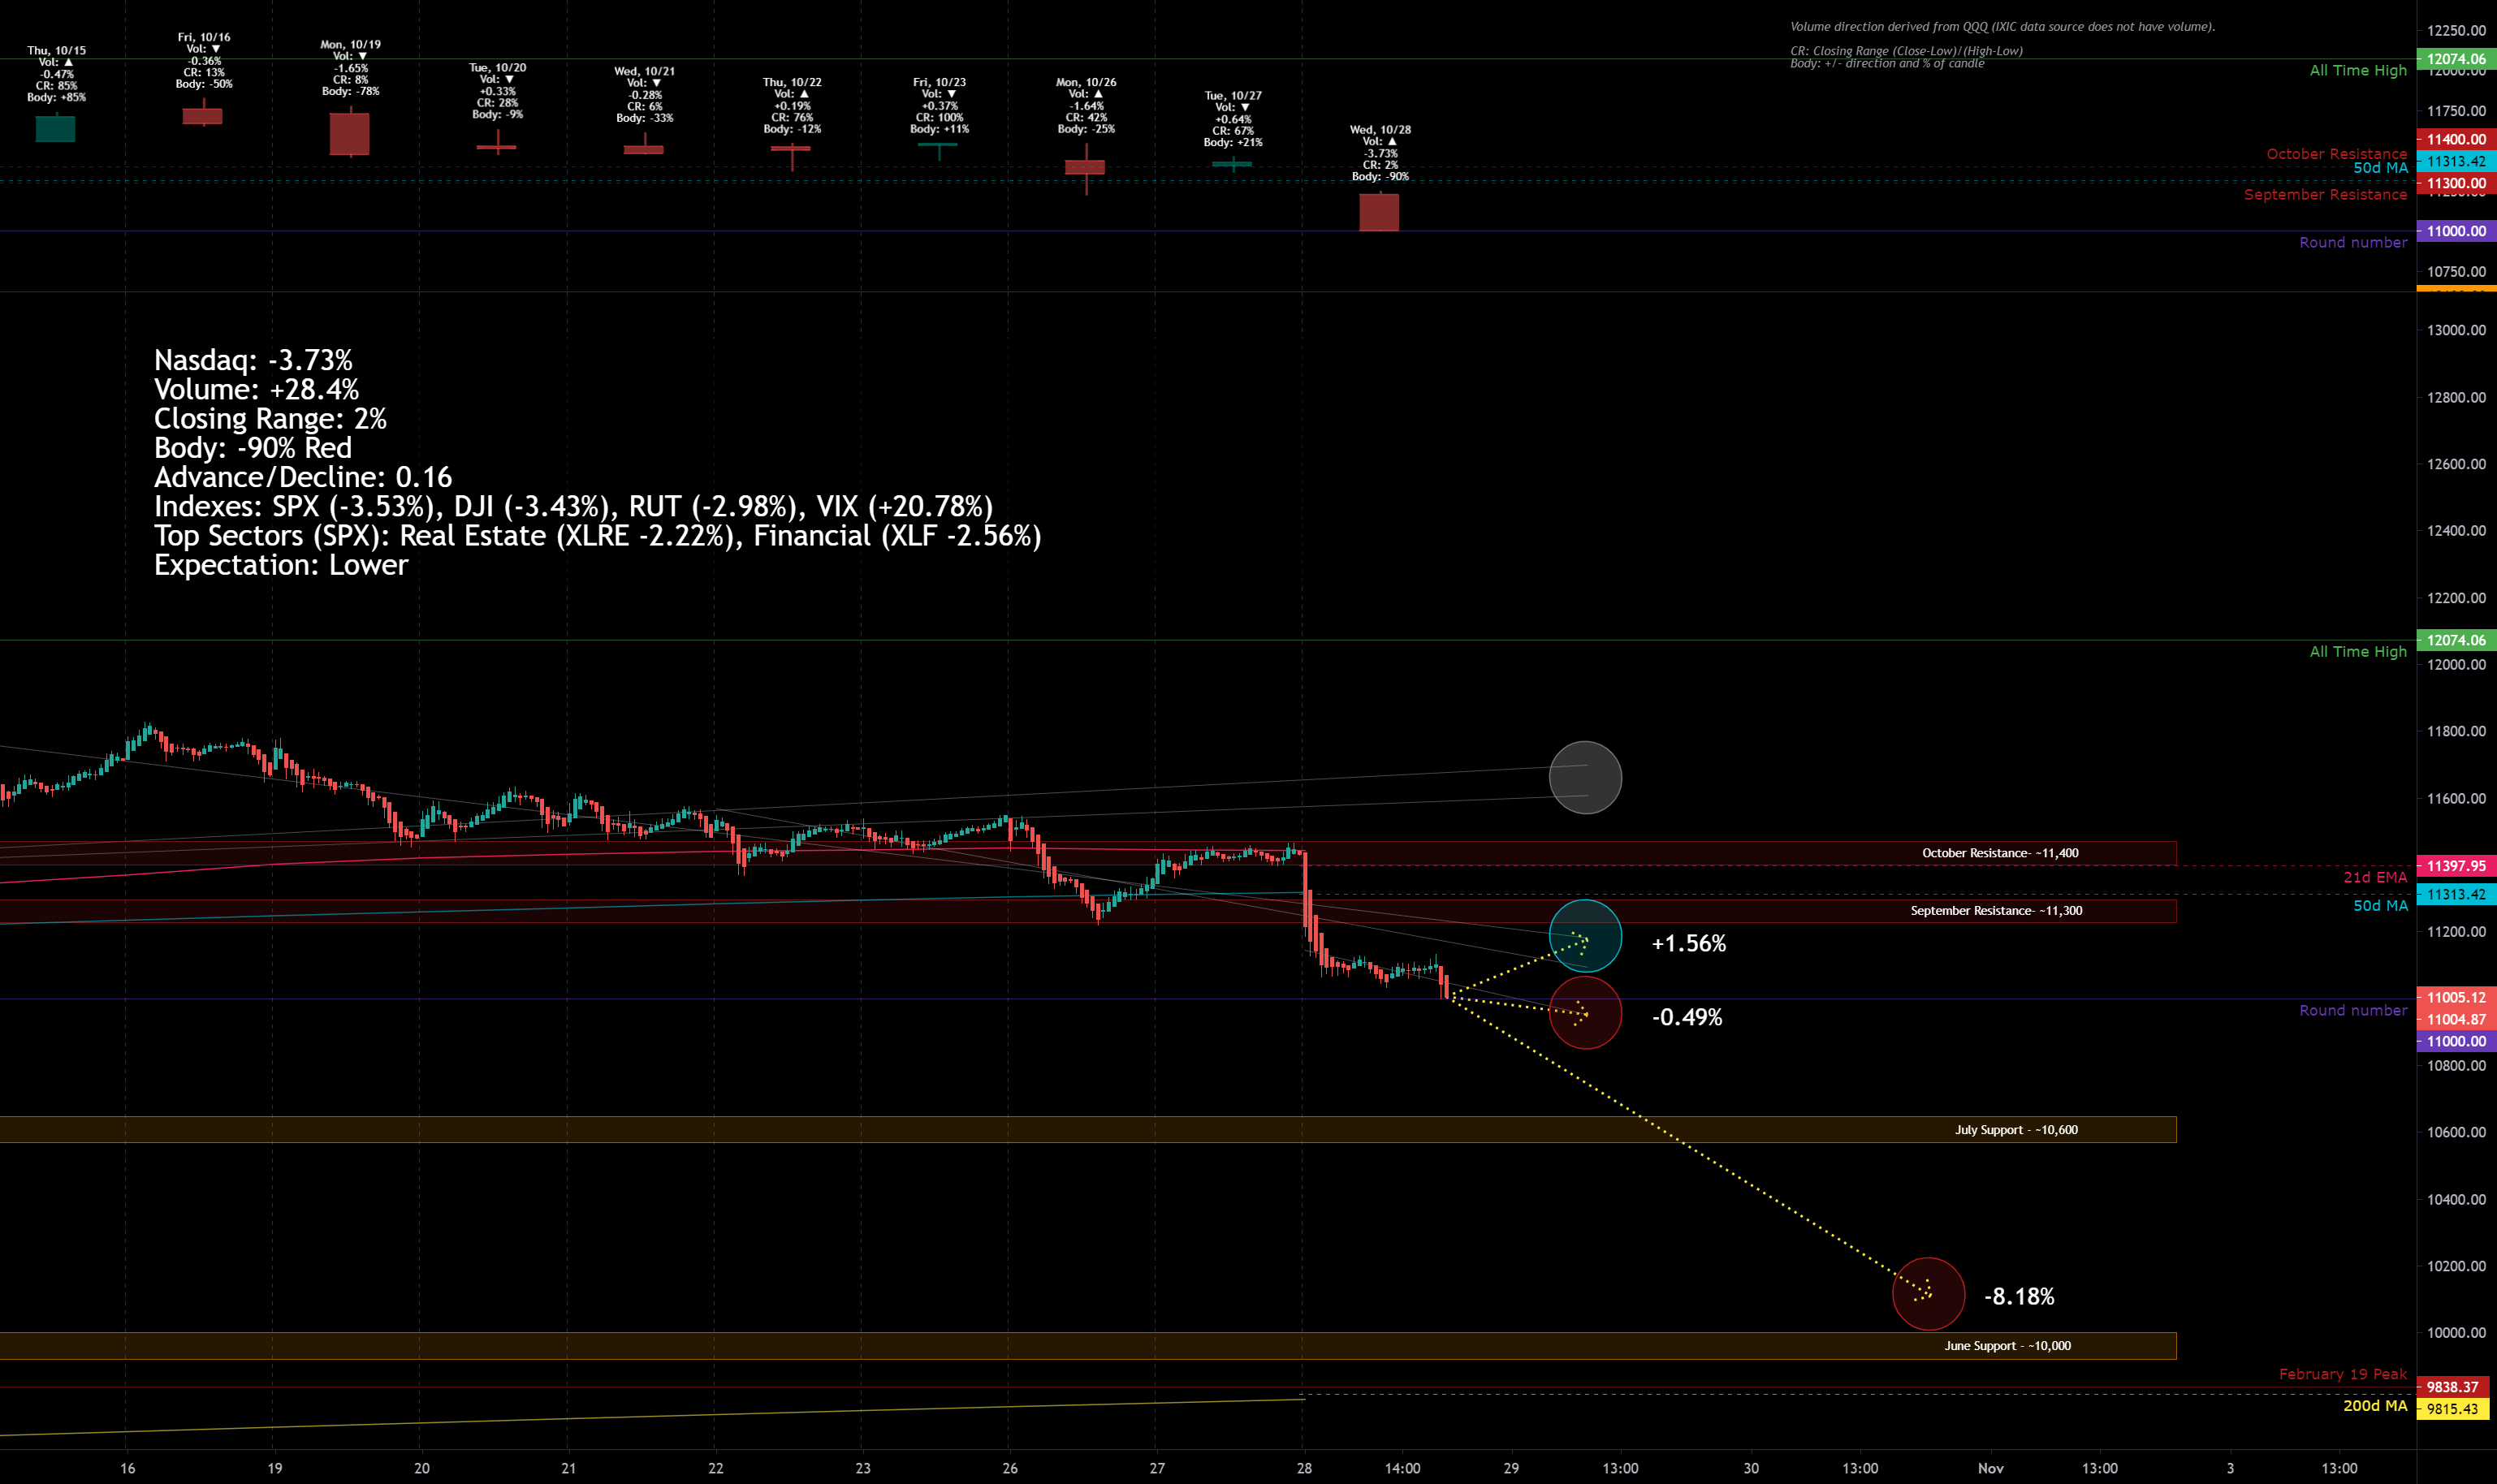
Facts: -3.73% lower, Volume higher, Closing range: 2%, Red Body: -90%
Good: Nothing
Bad: Gap down, deep red candle, ending at the days lows, broke below 50d MA
Highs/Lows: Lower low, lower high
Candle: Very tiny wicks on either side of a fat red body
Advance/Decline: 0.16, 6 decliners for every one advancer
Sectors: All sectors down, Real Estate ( XLRE -2.22%) and Financials ( XLF -2.56%) held up best.
Expectation: Lower
Market Overview
The day was not so much of a surprise but still hurts for a bull in the market. Sure, there were hopes for a bounce off the 50d MA or bulls coming in at the end of the day to buy the dip. But none of that happened. The Nasdaq finished down -3.73%, well below the 50d MA and testing the round number area of 11,000. Round number support is created by the tendency for investors to pick big round numbers as buy/sell triggers. The candle has a huge 90% red body with tiny wicks on top and bottom and a dismal 2% closing range. There were many more declining stocks than advancing stocks at a 6:1 to ratio with the broader NYSE seeing a 10:1 ratio. Volume on the Nasdaq had a huge 28.4% increase over the previous day and is above average volume for the past 50 days.
Indexes and Sectors
The S&P 500 ( SPX -3.53%) and Dow Jones Industrial Average (DJI -3.43%) indexes also saw big losses on increased volume . The Dow Jones Industrial went below September lows. The Russell 2000 (RUT -2.98%) faired slightly better, but still saw big losses. All sectors were losers with Real Estate (XLR -2.22%) and Financials ( XLF -2.56%) holding up the best. Technology ( XLK -4.24%) was the worst sector of the day. Communication Services ( XLC -3.93%) and Energy ( XLE -4.18%) also underperformed the SPX index, with Energy having some positive gains after Crude Oil Inventories were announced, but later selling off. Utilities ( XLU -2.91%) was strongest in morning trading, before giving up to the excessive selling.
The VIX volatility index increased a whopping +20.78% to add to the weeks gains which are now at 46.21% and exceeding the volatility highs of September.
Bonds
Treasury Bond spreads stayed about the same as the previous day. This is something to keep an eye on, but the spread is still in an upward trend channel from an August pivot .
Market Leaders
The mega-caps were all impacted by the selling with Microsoft ( MSFT -4.96%), Apple ( AAPL -4.63%), Google ( GOOG -5.46%), Amazon ( AMZN -3.76%) all dropping significantly. All of them closed below their 50d MA. Add Tesla ( TSLA -4.29%), Facebook ( FB -5.51%) and every other company over 200B market cap to that list. Not even one was spared. On the other hand, there were some bright spots elsewhere in the market. Chewy ( CHWY +6.33%) continued its breakout despite the heavy selling. Twilio ( TWLO +3.73%) finally got some credit for a good earnings report after selling earlier this week. Pinterest (PINS -6.23%) turned a big loss into huge >30% gains after the market closed thanks to their earnings report.
Looking ahead to Tomorrow
Tomorrow is the week’s big day with an enormous number of companies announcing quarterly earnings including Google , Amazon, Apple , Facebook , Starbucks ( SB -3.30%) after market close. Shopify (SHOP -5.19%) will release earnings before market open. The big economic news tomorrow will include the Gross Domestic Product. It is expected to show a record amount of growth but remember that this quarter will follow the worst quarter in history, and it is not an indicator of future economic activity. Any initial excitement in the market on this data alone, would certainly sell off without additional reasons to support gains.
Trends, Support and Resistance
For trend lines and expectation circles, I’ve grayed out the trend lines from the 9/3 correction start and the 9/24 bottom. These trend lines have lost significance against the current trend lines , and I’ll remove them in the next update. However, the trend from the 10/12 pivot day (which becomes the top in the current wave), and the 5d trend provide for the possibility of a +1.56% gain tomorrow. This would put the index just below September resistance area that held prices down in early October.
Continuing today’s trend which was mostly flat after the initial sell-off would mean a -0.49% loss tomorrow and would break through the 11,000 round number resistance. Beyond the trend lines , there are two support areas to watch for. The first is at 10,600 which is where we found the bottom of 10,519.49 in September. Breaking through this area would be dangerous as there is not much trading activity in the second half of the year in between that line and the June support area of 10,000. I have added back the future possibility of reaching that line. An additional -8.18% loss to that area feels within the realm of possible outcomes.
-=x=-=x=-=x=-=x=-=x=-=x=-=x=-=x=-=x=-=x=-=x=-=x=-=x=-=x=-=x=-=x=-=x=-=x=-=x=-=x=-=x=-=x=-=x=-=x=-
Thursday, October 29, 2020
It's something unpredictable
But in the end is right
I hope you had the time of your life
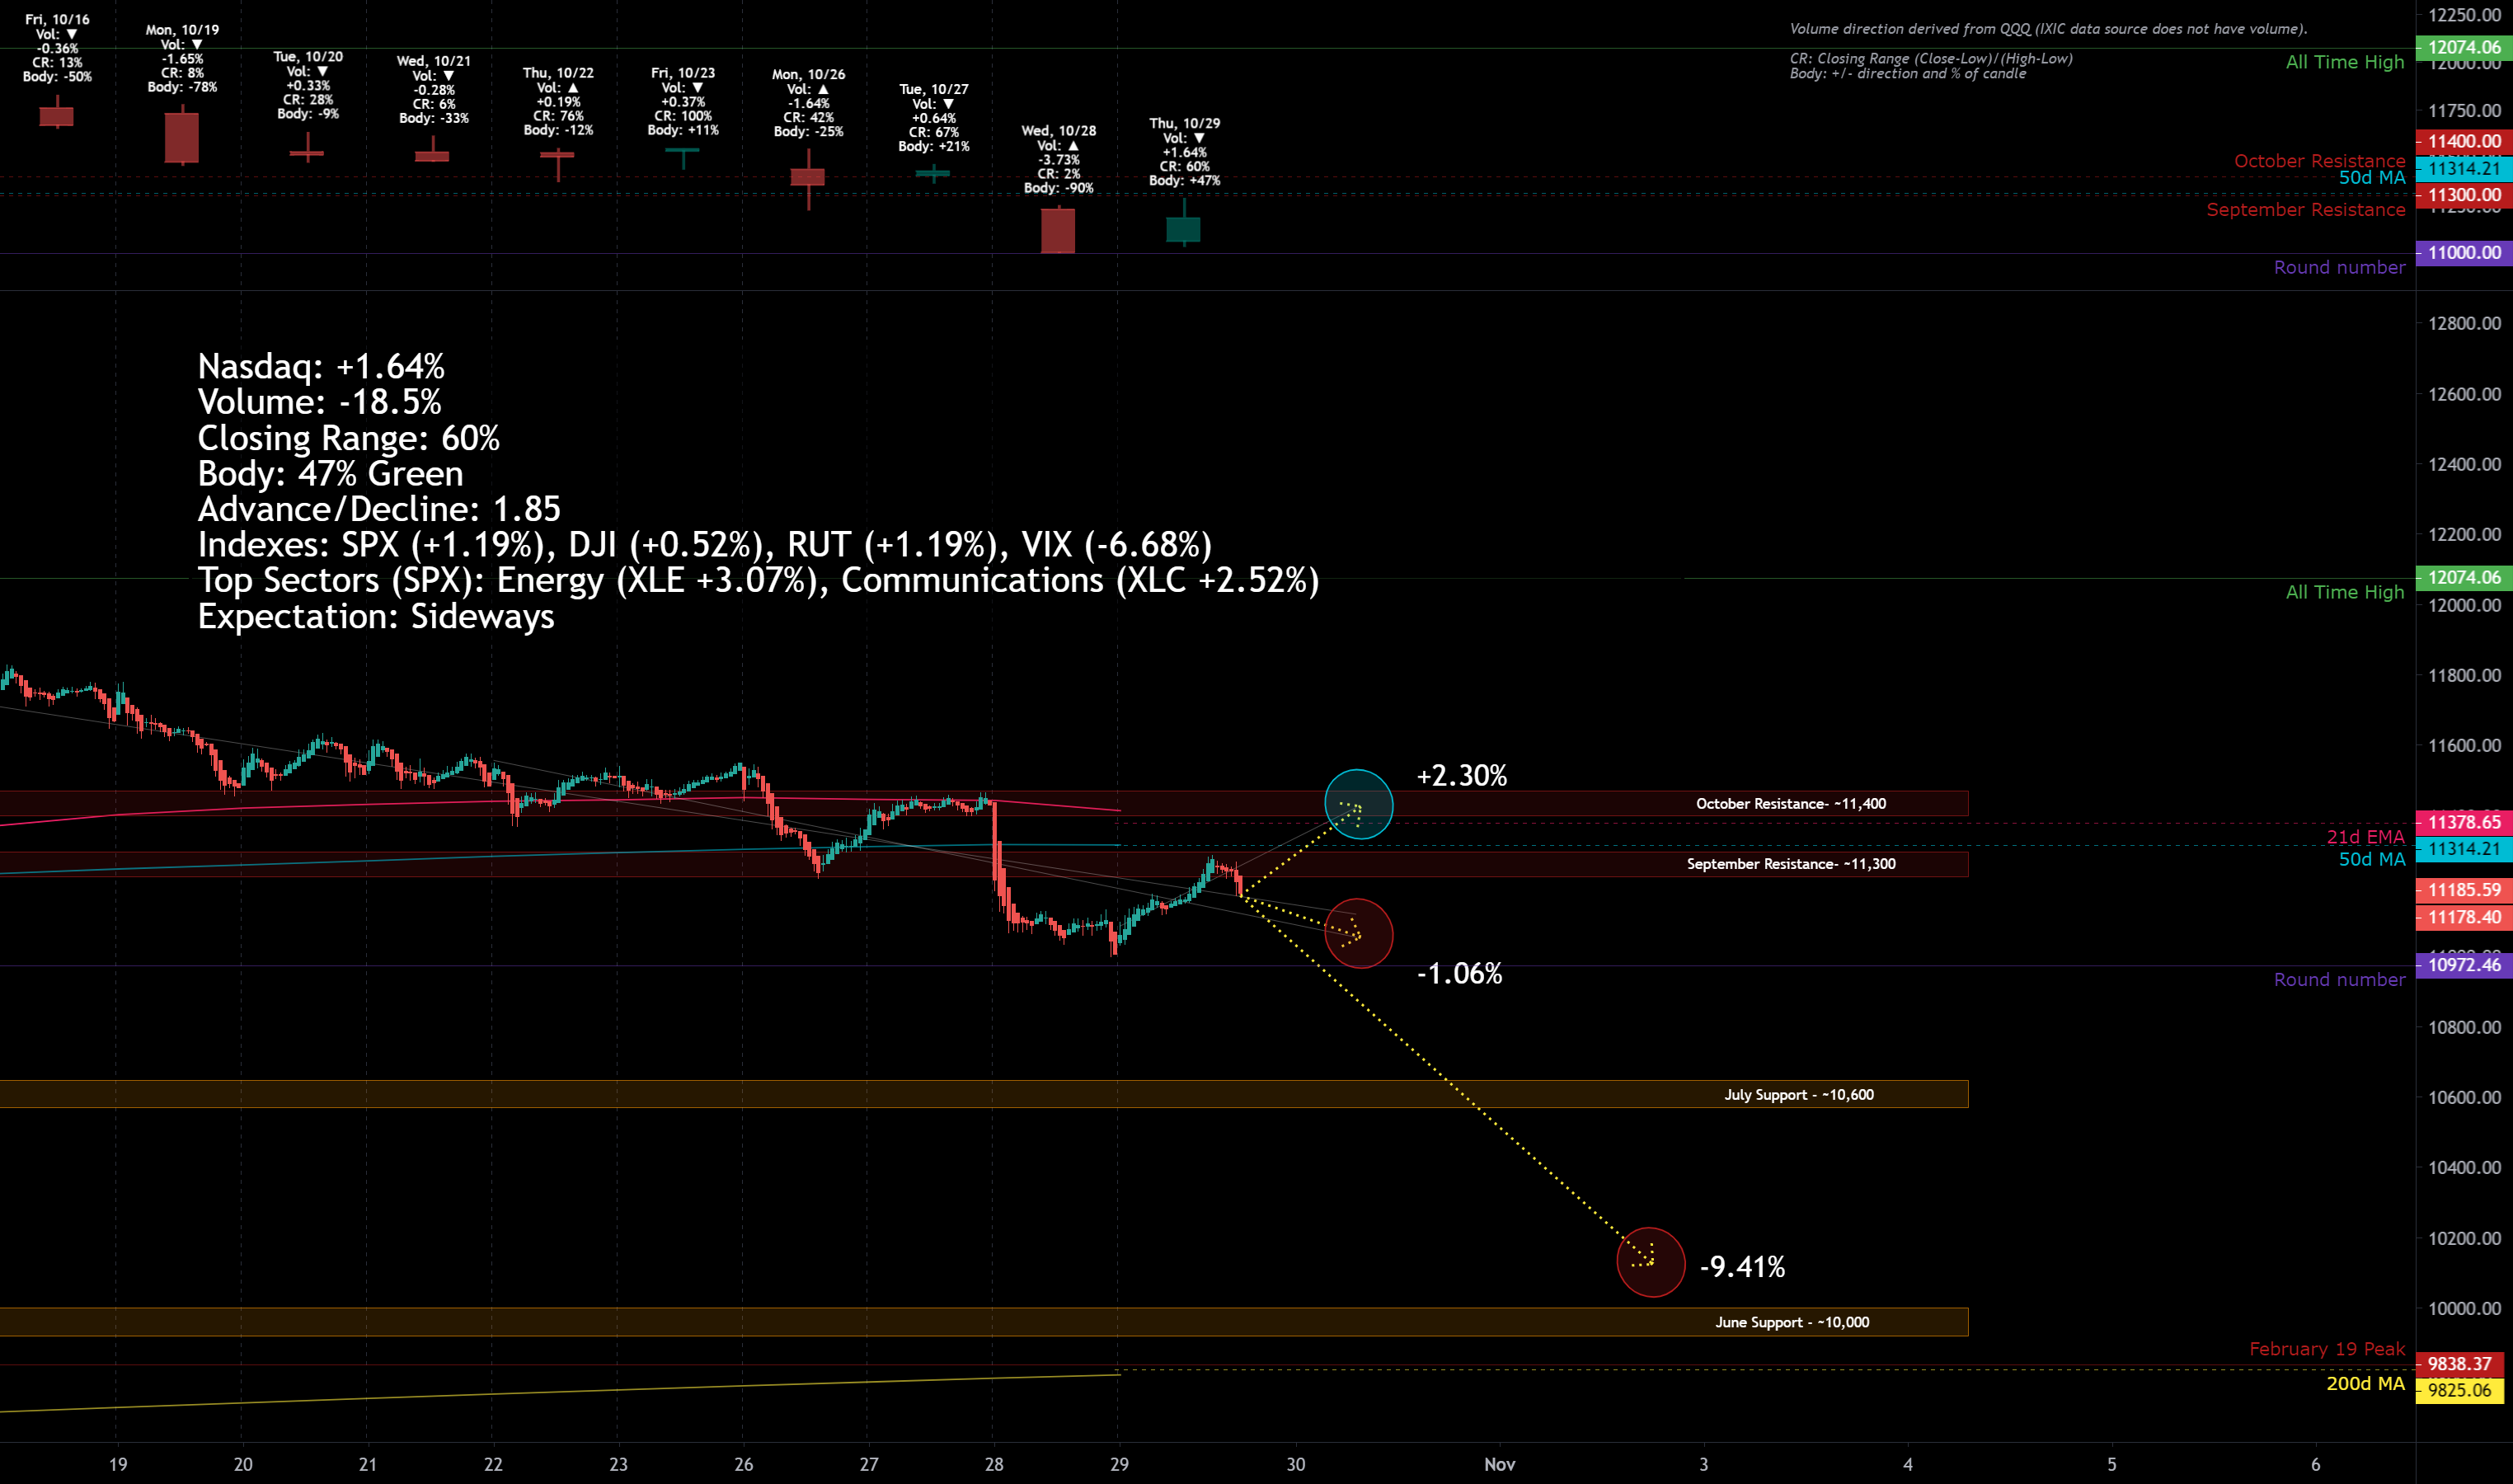
Facts: +1.65% lower, Volume lower, Closing range: 60%, Green Body: 47%
Good: Traded above yesterday’s low, fat green bullish body
Bad: Selling at end of day after 50d MA resistance
Highs/Lows: Higher low, higher high
Candle: Thick green body, majority in lower part of candle, long top wick
Advance/Decline: 1.85, about 2 advancers for every decliner
Sectors: Energy ( XLE +3.07%), Communications ( XLC +2.25%) were top, Health ( XLV -0.82%) was bottom.
Expectation: Sideways
Market Overview
It was a reasonably good day following the sell-off on Wednesday. The Nasdaq finished up +1.64% after tempting itself with the 50d MA and September Resistance line. Volume was lower, returning to the recent levels that have represented the wait-and-see level of activity in the market, well below the 50d average volume . The candle has a 47% green body with a 60% closing range which is good considering the bounce from yesterday but also shows not everyone is back in the game yet. Breadth was ok with two advancing stocks for every declining stock.
Indexes and Sectors
The S&P 500 ( SPX +1.19%) had a similar day with gains on lower volume that somewhat dropped back at the end of the day. Both the S&P 500 and the Dow Jones Industrial Average (DJI +0.52%) had lower highs and lower lows, putting them further below their key moving averages with the 21d EMA slipping below the 50d MA. Energy ( XLE +3.07%) and Communication Services ( XLC +2.52%) were the best performing sectors with Energy passing Communications in the last 30 minutes of trading. Keeping an eye on Technology ( XLK +1.67%), it had decent gains today ahead of some important earnings announcements. Consumer Staples ( XLP -0.03%) and Health ( XLV -0.82%) were the only two sectors with losses.
The VIX volatility index finally took a step back, losing -6.68%, but the close remains above the September numbers.
Bonds
Treasury Bond spreads increased for the day. The spreads are in an upward trend channel from an August pivot .
Market Leaders
The mega-caps all faired well after yesterday’s selling. Apple ( AAPL +3.71%), Amazon ( AMZN +1.52%) Microsoft ( MSFT +1.01%) and Google ( GOOG +3.34%) had significant gains as did the majority of mega cap companies. Pinterest (PINS +26.92%) followed up great earnings with a huge gain, trying to keep up with rival Snap (SNAP -1.49%) which had is starting to build a base after the huge gains from last week. Lots of growth stocks had good gains on the day. Shopify (SHOP -4.84%) and Spotify (SPOT -3.36%) retreated heading into earnings .
So let’s talk about earnings . All of the big tech companies that released earnings reports today, beat expectations. Apple , Google , Amazon, Facebook all had good reports compared to expectations, yet except for Google they sold off in after hours. The same story played out for Shopify. Spotify missed slightly but had great customer adds data. Apple had higher revenue but low performance in China and no guidance. The market, not willing to stomach that, sold off AAPL over -4% in after hours. Facebook is down -2.88% after market, Amazon is down -1.81%. This is also a continuation of earnings beats earlier in the week that have seen losses in the stock price. Investors are looking for the extremely good beats and expectations like the ones we saw from Snap and Pinterest.
Looking ahead to Tomorrow
Tomorrow will be a big day for Energy as Exxon Mobile ( XOM +4.43%) and Chevron ( CVX +2.87%) will announce earnings before market open. In addition, a plethora of other large cap companies will report before market open. Employment Wages and Personal Consumption Expenditures aren’t expected to have much impact in the context to this week’s other economic indicators and impact of earnings reactions. We already know people are spending more while earning less based on other economic indicators.
Trends, Support and Resistance
As I stated in yesterday’s update, I removed the trend lines from 9/3 and 9/24 which were having less and less relevance since we pivoted on 10/12 and are approaching the lows of September. For tomorrow, the one day trend line would point to a +2.30% gain that breaks back above the key 21d EMA and 50d MA that often act as support or resistance.
Continuing the trend from the 10/12 pivot day as well ad the last five days would result in a -1.06% drop . This is where the trend line points to, but it’s reasonable to believe a continued loss for Friday and into Monday that would take us to the 10,600 support level . Breaking through this area would be dangerous as there is not much trading activity in the second half of the year in between that line and the June support area of 10,000. I have added back the future possibility of reaching that line, a -9.41% loss from today’s close. This downward trend seems to be how the market is heading into the election on Tuesday. Following Tuesday, we could finally see a turn for the better.
-=x=-=x=-=x=-=x=-=x=-=x=-=x=-=x=-=x=-=x=-=x=-=x=-=x=-=x=-=x=-=x=-=x=-=x=-=x=-=x=-=x=-=x=-=x=-=x=-
Friday, October 30, 2020
If there's somethin' strange in your neighborhood
Who ya gonna call?

Facts: -2.45% lower, Volume higher, Closing range: 29%, Red Body: 62%
Good: Not much, small uptick at end of day
Bad: Lower low
Highs/Lows: Lower low, lower high
Candle: Thick green body, majority in lower part of candle, long top wick
Advance/Decline: 1.85, about 2 advancers for every decliner
Sectors: Energy ( XLE +3.07%), Communications ( XLC +2.25%) were top, Health ( XLV -0.82%) was bottom.
Expectation: Sideways
Market Overview
The market sold off heavily on Friday after a big day of earnings releases that did not meet the demands of investors who were already nervous from the resurging pandemic and the pending turmoil from next week’s election. There is not much to look at on the good side other than the pullbacks will eventually create new opportunities. The index fell -2.45% in Friday’s session, with an increase in volume as investors sold off equities before the weekend. There was a slight uptick at the end of the day as bulls came in for low priced opportunities, with focus on Energy and Finance sectors. The candle has a long 62% body with a short lower wick from the last few minutes of buying, ending with a 29% closing range. There were about 2.5 declining stocks for every advancing stock.
Indexes and Sectors
The S&P 500 ( SPX -1.21%) did not lose as much as the Nasdaq but still saw selling on higher volume . All the indexes turned out lower highs and lower lows to end the worst week for equity markets since March. Energy ( XLK +0.56%) and Financials ( XLF +0.26%) were the only sectors with positive numbers. Technology ( XLK -2.21%) and Consumer Discretionary ( XLY -2.18%) shared the bottom of the sector list, with those sectors driving the broader market sell off. Although having many bright spots throughout the week, Communication Services ( XLC -1.69) also had significant losses on Friday.
The VIX volatility index increased +1.14% to close the week 38% higher than the previous week and well above September numbers.
Bonds
Treasury Bond spreads increased for the day. The spreads are in an upward trend channel from an August pivot . No worries from that perspective.
Market Leaders
Google ( GOOG +3.43%) was the only of the big four mega-caps to have gains. Apple ( AAPL -5.60%) and Amazon ( AMZN -5.45%) both had huge losses after their earnings releases, while Microsoft ( MSFT -1.10%) did not do too bad given the market condition. Each has a bit of a different profile of trading during the day. Google gaped up at market open but then sold throughout the day losing some of the early gains. Microsoft dipped over 3% but was bought back later in the day. Apple followed or drove the market, depending on how you view it, trading almost exactly along the same path. Facebook ( FB -6.31%), Snap (SNAP -6.70%), and Pinterest (PINS -5.70%) soared the past two weeks but gave back some ground on Friday. Most growth stocks did not fair well. Chevron ( CVX +1.02%) and Exxon Mobile ( XOM -1.06%) had opposite reactions after morning earnings reports. Both continued struggling with revenue while Chevron seems to be managing costs better.
Looking ahead
Next week is the big week that will both answer questions and create new questions. Who will win the election and what impact will that have on the market longer term? Will there be a smooth end to the process, or will the candidates start a long battle to contest the results? Can congress resume discussions for a stimulus or will we have to wait until transitions to new leadership in government?
Beyond the election, we will get updates on Manufacturing data early in the week and the Fed is scheduled to announce any interest rate changes on Thursday.
Trends, Support and Resistance
Since we are in between two support and resistance areas, there is room to move in either direction on Monday. Getting back to the midpoint trend line from the 10/12 pivot would mean a +0.90% gain. That seems a reasonable move after the uptick at today’s close and without any big context changes over the weekend.
On the downside, the one-day and five-day trend lines point to about the same place which is a -1.11% loss. The lower trend line is just above the July support area and still within a parallel channel drawn from 10/12. Breaking through this support area would be dangerous as there is not much trading activity in the second half of the year in between that line and the June support area of 10,000. I have added back the future possibility of reaching the June support area , a -7.21% loss from today’s close. This downward trend seems to be how the market is heading into the election on Tuesday. Following Tuesday, we could finally see a turn for the better.
-=x=-=x=-=x=-=x=-=x=-=x=-=x=-=x=-=x=-=x=-=x=-=x=-=x=-=x=-=x=-=x=-=x=-=x=-=x=-=x=-=x=-=x=-=x=-=x=-
The Meaning of Life (Larger View on the Week)

It was another tough week, especially if you are bullish growth investor. There were so many things that could have gone well, from positive earnings beats to the good economic news. But nothing, not even the over the top performance of Social Media stocks (Snap, Pinterest, Facebook, Twitter) could hold up through the week. The Nasdaq fell through several key support areas including the 50d moving average, a line that is often watched as a sign of health for markets.
The week started with a negative expectation breaker, smashing hopes formed from the previous Thursday and Friday character changes. More lockdowns, election uncertainty and finally some economic news that did not meet expectations, was too much for the market to hold. That began the back and forth that often occurs as we pivot toward correction territory. Tuesday up, Wednesday down, Thursday up, Friday down. The index closed on Friday for a -5.51% weekly loss, the worst week since March.
Investors Business Daily, a great site with market updates for CANSLIM investors, moved quickly from Confirmed uptrend early in the week, to Uptrend under Pressure, until finally marking the Correction on Friday. Hopefully, you all had a chance to raise cash, hedge your investments and move to the sidelines, or to an alternative trading strategy for correcting markets.
US Treasury Yield spreads largely not impacted by the stock market performance. Yields are still so low that investors are not exiting the equities market.
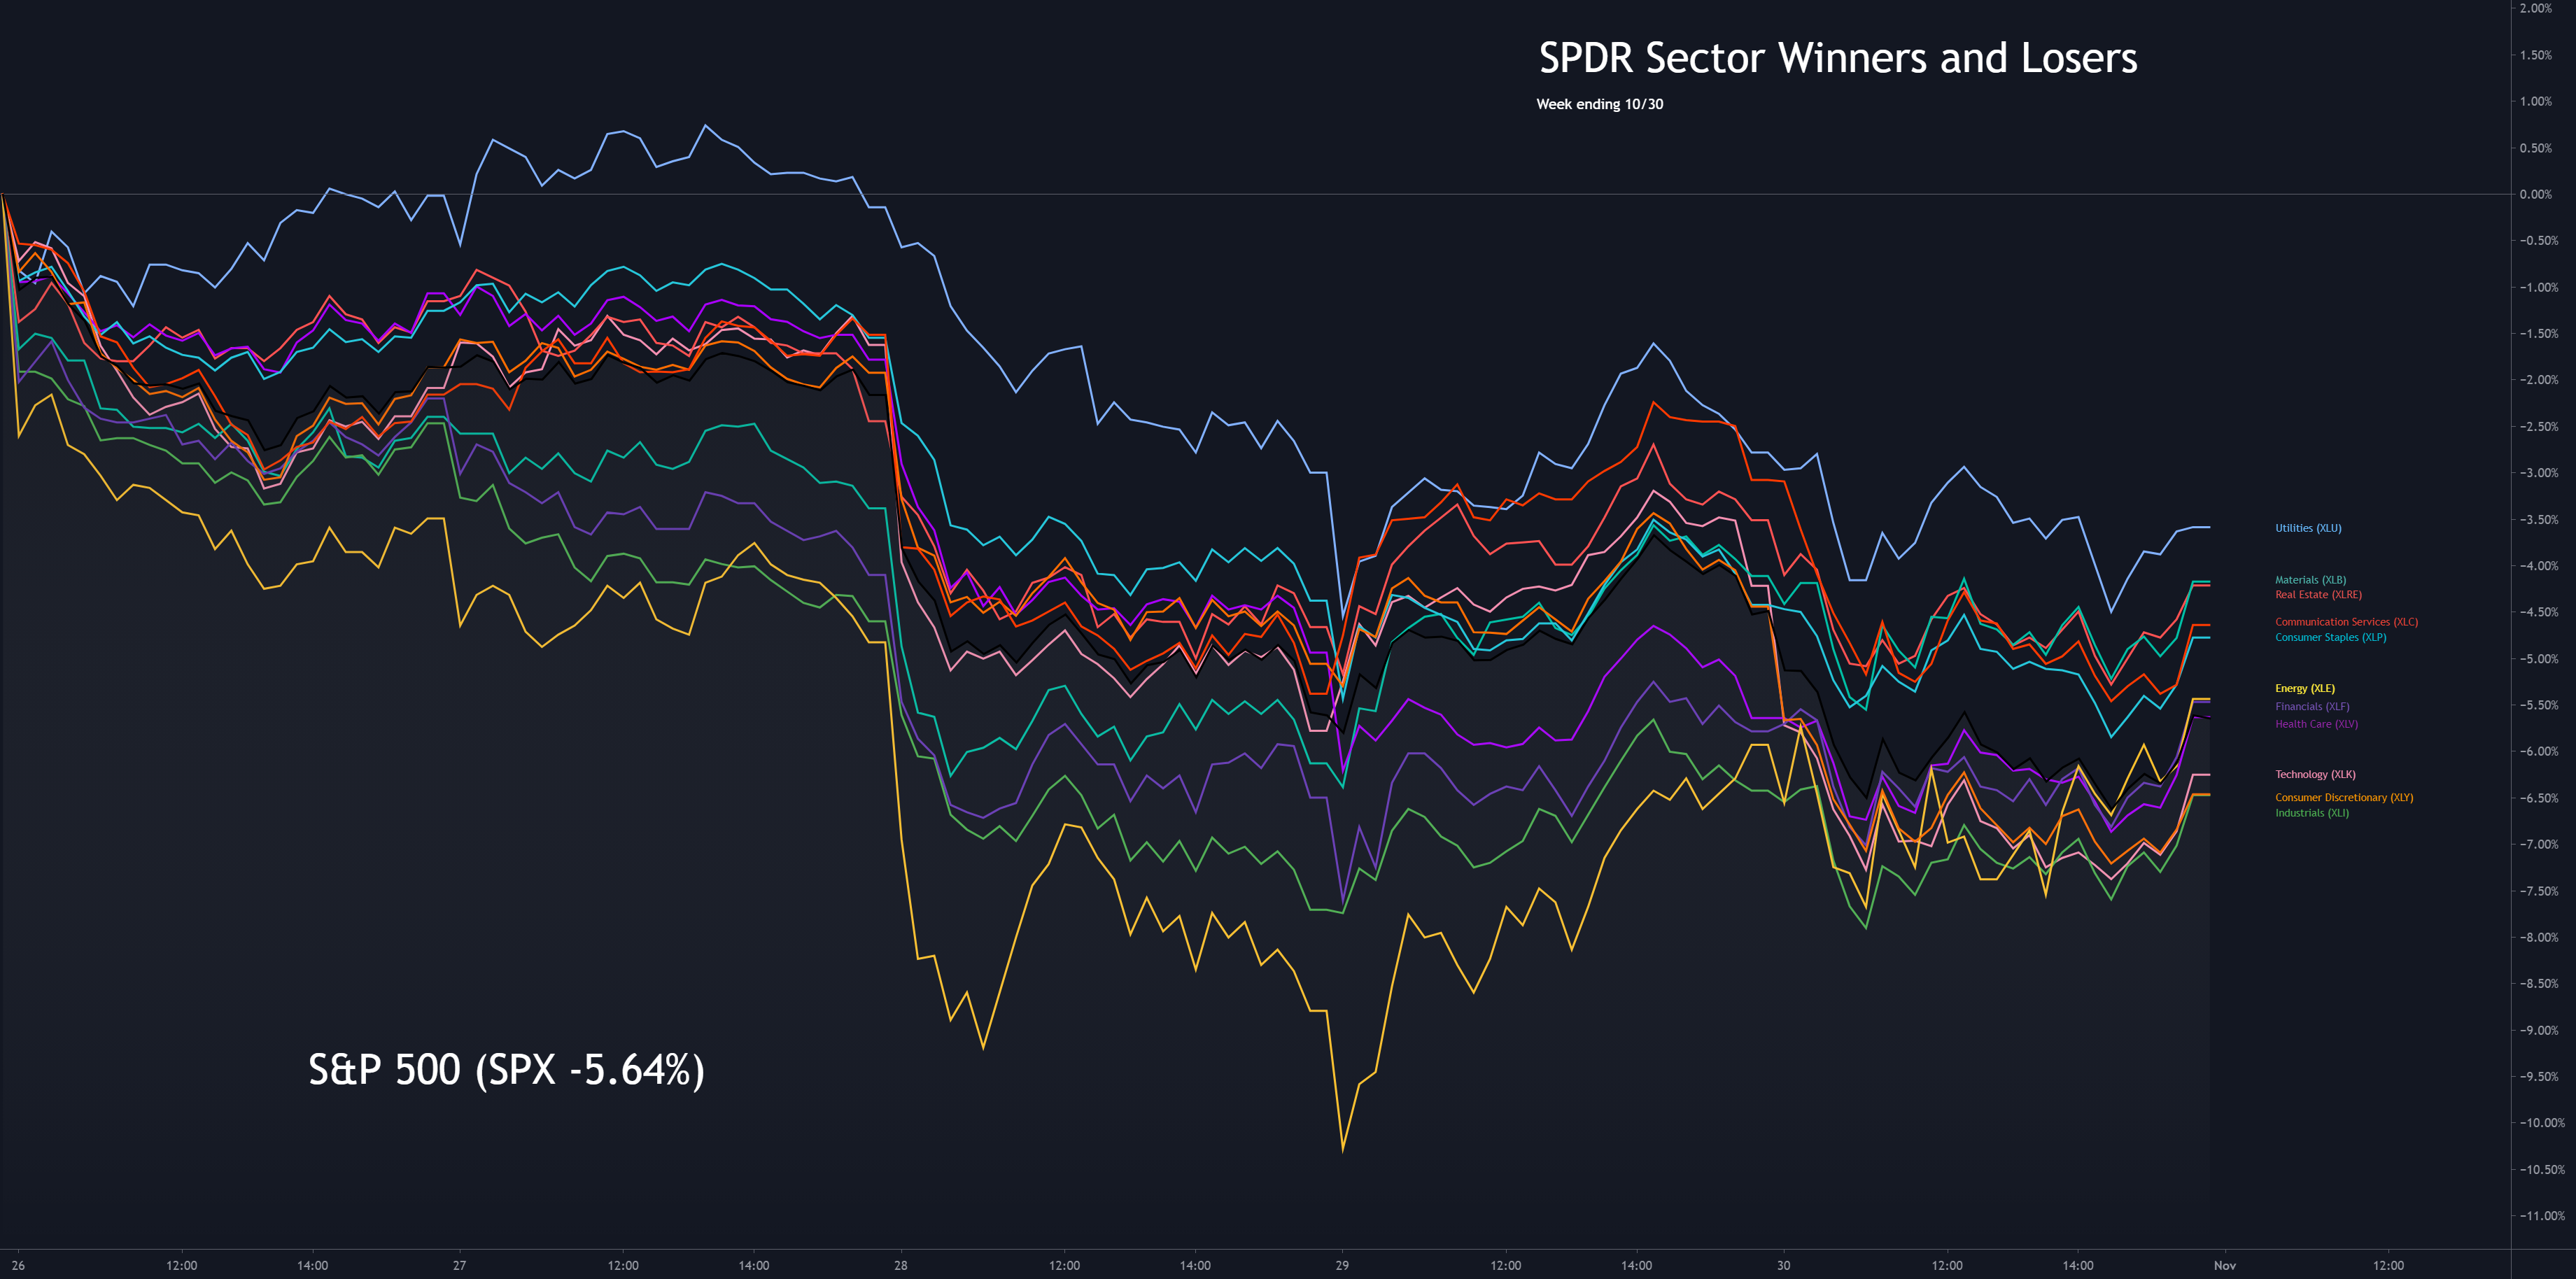
It was a long painful week for all the sectors with the overall S&P 500 index losing -5.64%, worst since March of this year. Utilities ( XLU ) topped the list of sectors "only" losing -3.66% and remained as the safe place for investors to go to stay into equities instead of the alternatives.
There were certainly days that each sector had to shine, but as far as the week-to-date performance, there was not a lot of back and forth as the days progressed in the weekly list of sector winners/losers. Most sectors beat the overall S&P 500 index. The exception is Technology ( XLK ), Consumer Discretionary ( XLY ) and Industrials ( XLI ). Consumer Discretionary just barely beat out Industrials to be the week's loser at a -6.55% loss.
In addition to the indexes and the sectors, it is also important to look at how the market leaders are behaving. Each of the big four mega-caps had a different character for the week. Apple (AAPL) came into the week already trending down with the fast moving 21d EMA below the slower 50d MA and widening that gap by the end of the week. Microsoft (MSFT) started the week with the 21d EMA above the 50d MA but investors did not respond well to the guidance in the earnings announcements, gaping down on Wednesday. Amazon (AMZN) was holding up pretty well, looking to form a base and possibly a breakout, but could not overcome the market and investors demands for better performance. Google (GOOG) on the other hand, bucked the trend, coming into the week with the 21d EMA below the 50d MA and leaving the week with huge gains thanks to better than expected recovery in the online advertising business.
To me, that shows that investors were not in a sell-everything fear mode this week. There was still some discriminate choices of equities to put money into. That does not mean those stocks will not sell off next week, but it certainly sheds some hope and tells us to keep our eyes on the market.
-=x=-=x=-=x=-=x=-=x=-=x=-=x=-=x=-=x=-=x=-=x=-=x=-=x=-=x=-=x=-=x=-=x=-=x=-=x=-=x=-=x=-=x=-=x=-=x=-
The Week Ahead
We just came out of a hugely pivotal and impactful week, full of earnings reports and economic news. Next week will be no less important. The biggest event being the election. There will be a lot of uncertainty on Monday and Tuesday in the market. If the early election results are definitive, there’s hope for some stabilization after Tuesday. More likely, there is going to be more drama to come and that will continue the back-and-forth market we have been experiencing the past few weeks. There is hope that stimulus talks will continue and that a deal will be struck, but there is also a lot of nervousness about how the leaders in the Whitehouse and in Congress will act after the election.
In addition to that, we’ll have updates on Manufacturing economic data and the Fed is scheduled to update on any interest rate changes on Thursday. The expectation is they will hold to the plan of no interest rate changes.
The next week will be a pivotal one for where the market goes next. The questions for the indexes will be whether they can continue the character change from Thursday and Friday and turn that into gains early in the week. They are still testing key support areas and the 21d EMA , often used by investors as an indicator of market health.
Economic news will include New Home Sales, Consumer Confidence and Q3 GDP and are all expected to increase. Positive news in these economic indicators could give the market a boost.
The earnings calendar includes Berkshire Hathaway (BRKB) on Monday morning and Paypal (PYPL) in the evening. Alibaba (BABA), Uber (UBER) and Square (SQ) report on Thursday.
It will be another tough week to safely trade next week. Unless you have a strategy that can play well in volatility, or a good hedge strategy, it’s best to raise some cash and stay on the sidelines. Watch for stocks that are doing well against the market correction and build those into your daily/weekly watch lists. Those are the stocks that will most likely perform well once we get past all the turmoil.
-=x=-=x=-=x=-=x=-=x=-=x=-=x=-=x=-=x=-=x=-=x=-=x=-=x=-=x=-=x=-=x=-=x=-=x=-=x=-=x=-=x=-=x=-=x=-=x=-
Key Nasdaq Levels to Watch
There are several key levels in the Nasdaq to keep an eye out for and respond accordingly. First on the positive side:
- The first is the 50-day moving average at 11307.14 right now. It would put a lot of confidence into the market to have the index close back above this level.
- The next is the 21-day exponential moving average, not too far above the 50-day moving average at 11336.19.
- There is a resistance area at around 11,300 and 11,400 that are also key to watch. These held back market gains in late September and early October before the index finally broke through. Expect that resistance to come up again.
- Getting above 11,545.63 would erase a very difficult week and put us back on a path for a rally.
- Next would be to make it above the high of 10/12 at 11,965.54 which was the downside pivot day from October gains.
- Passing 12074.06 would be a new all-time high and a clear sign that the bull market is back.
On the downside, there are several key levels to raise red flags, many similar to what we watched for last week:
- 10,822.57 is Friday and last week’s low. The index needs to hold above that low to prevent even further correction-level losses.
- The next area to watch us the July support area at 10,600. If further losses are to come, then the hope is we'd at least stop at this level. If we break through here, there is danger of a much more damaging decline.
- 10,519.49 is the September low. The index found itself in that area twice but closed higher during those days. Closing below that line would be significant.
- Beyond the July support area, there is not much to hold back the index from dropping to the June support area of 10,000. There were only 2-3 days in early July that we were trading between these two levels. At the 10,000 level, there would be a lot of support from the round number psychology as well as the approaching 200d MA.
-=x=-=x=-=x=-=x=-=x=-=x=-=x=-=x=-=x=-=x=-=x=-=x=-=x=-=x=-=x=-=x=-=x=-=x=-=x=-=x=-=x=-=x=-=x=-=x=-
Wrap-up
How do you feel? That is one of the most important questions you should ask yourself. Your mental health is the most important part of your trading system. Are you disappointed from the last few weeks? Are you feeling anxious about the coming week, the market, the elections and the pandemic? Spend some time to get yourself centered.
Next, have a plan. Most of us will plan to stay in cash. If you have some hedging strategies or a trading strategy for volatile markets, then write it out. Spend some time thinking through the what-ifs for the week. Things will move fast, and it’s best to be prepared for multiple possibilities.
Good luck, stay healthy and trade safe!