The Nasdaq Week in Review is my weekend homework where I look over what happened in the previous week and what might come in the next week. It helps me evaluate my observations, recognize new data points, and make a plan for possible scenarios in the near future.
If you find this helpful, please let me know in the comments. I'm also more than happy to add new perspectives and data points if you have ideas.
The structure is the following:
-=x=-=x=-=x=-=x=-=x=-=x=-=x=-=x=-=x=-=x=-=x=-=x=-=x=-=x=-=x=-=x=-=x=-=x=-=x=-=x=-=x=-=x=-=x=-=x=-=x=-=x=-=x=-=x=-=x=-=x=-
Monday, October 19, 2020
Pray tomorrow takes me higher

Facts: 1.65% lower, Volume higher, Closing range: 8%, Red Body: 78%
Good: Held above 21d EMA , volume still not super high
Bad: Almost everything, start up 1% but go down the whole day
Candle: 78% red body with 8% closing range.
Advance/Decline: 0.35, twice as many stocks declining than advancing
Sectors: All sectors were down, but Utilities ( XLU ) was the best performing of the day. Energy ( XLE ) led with gains in the morning. Technology ( XLK ) and Communications ( XLC ) were worst of day.
Expectation: Sideways or Lower
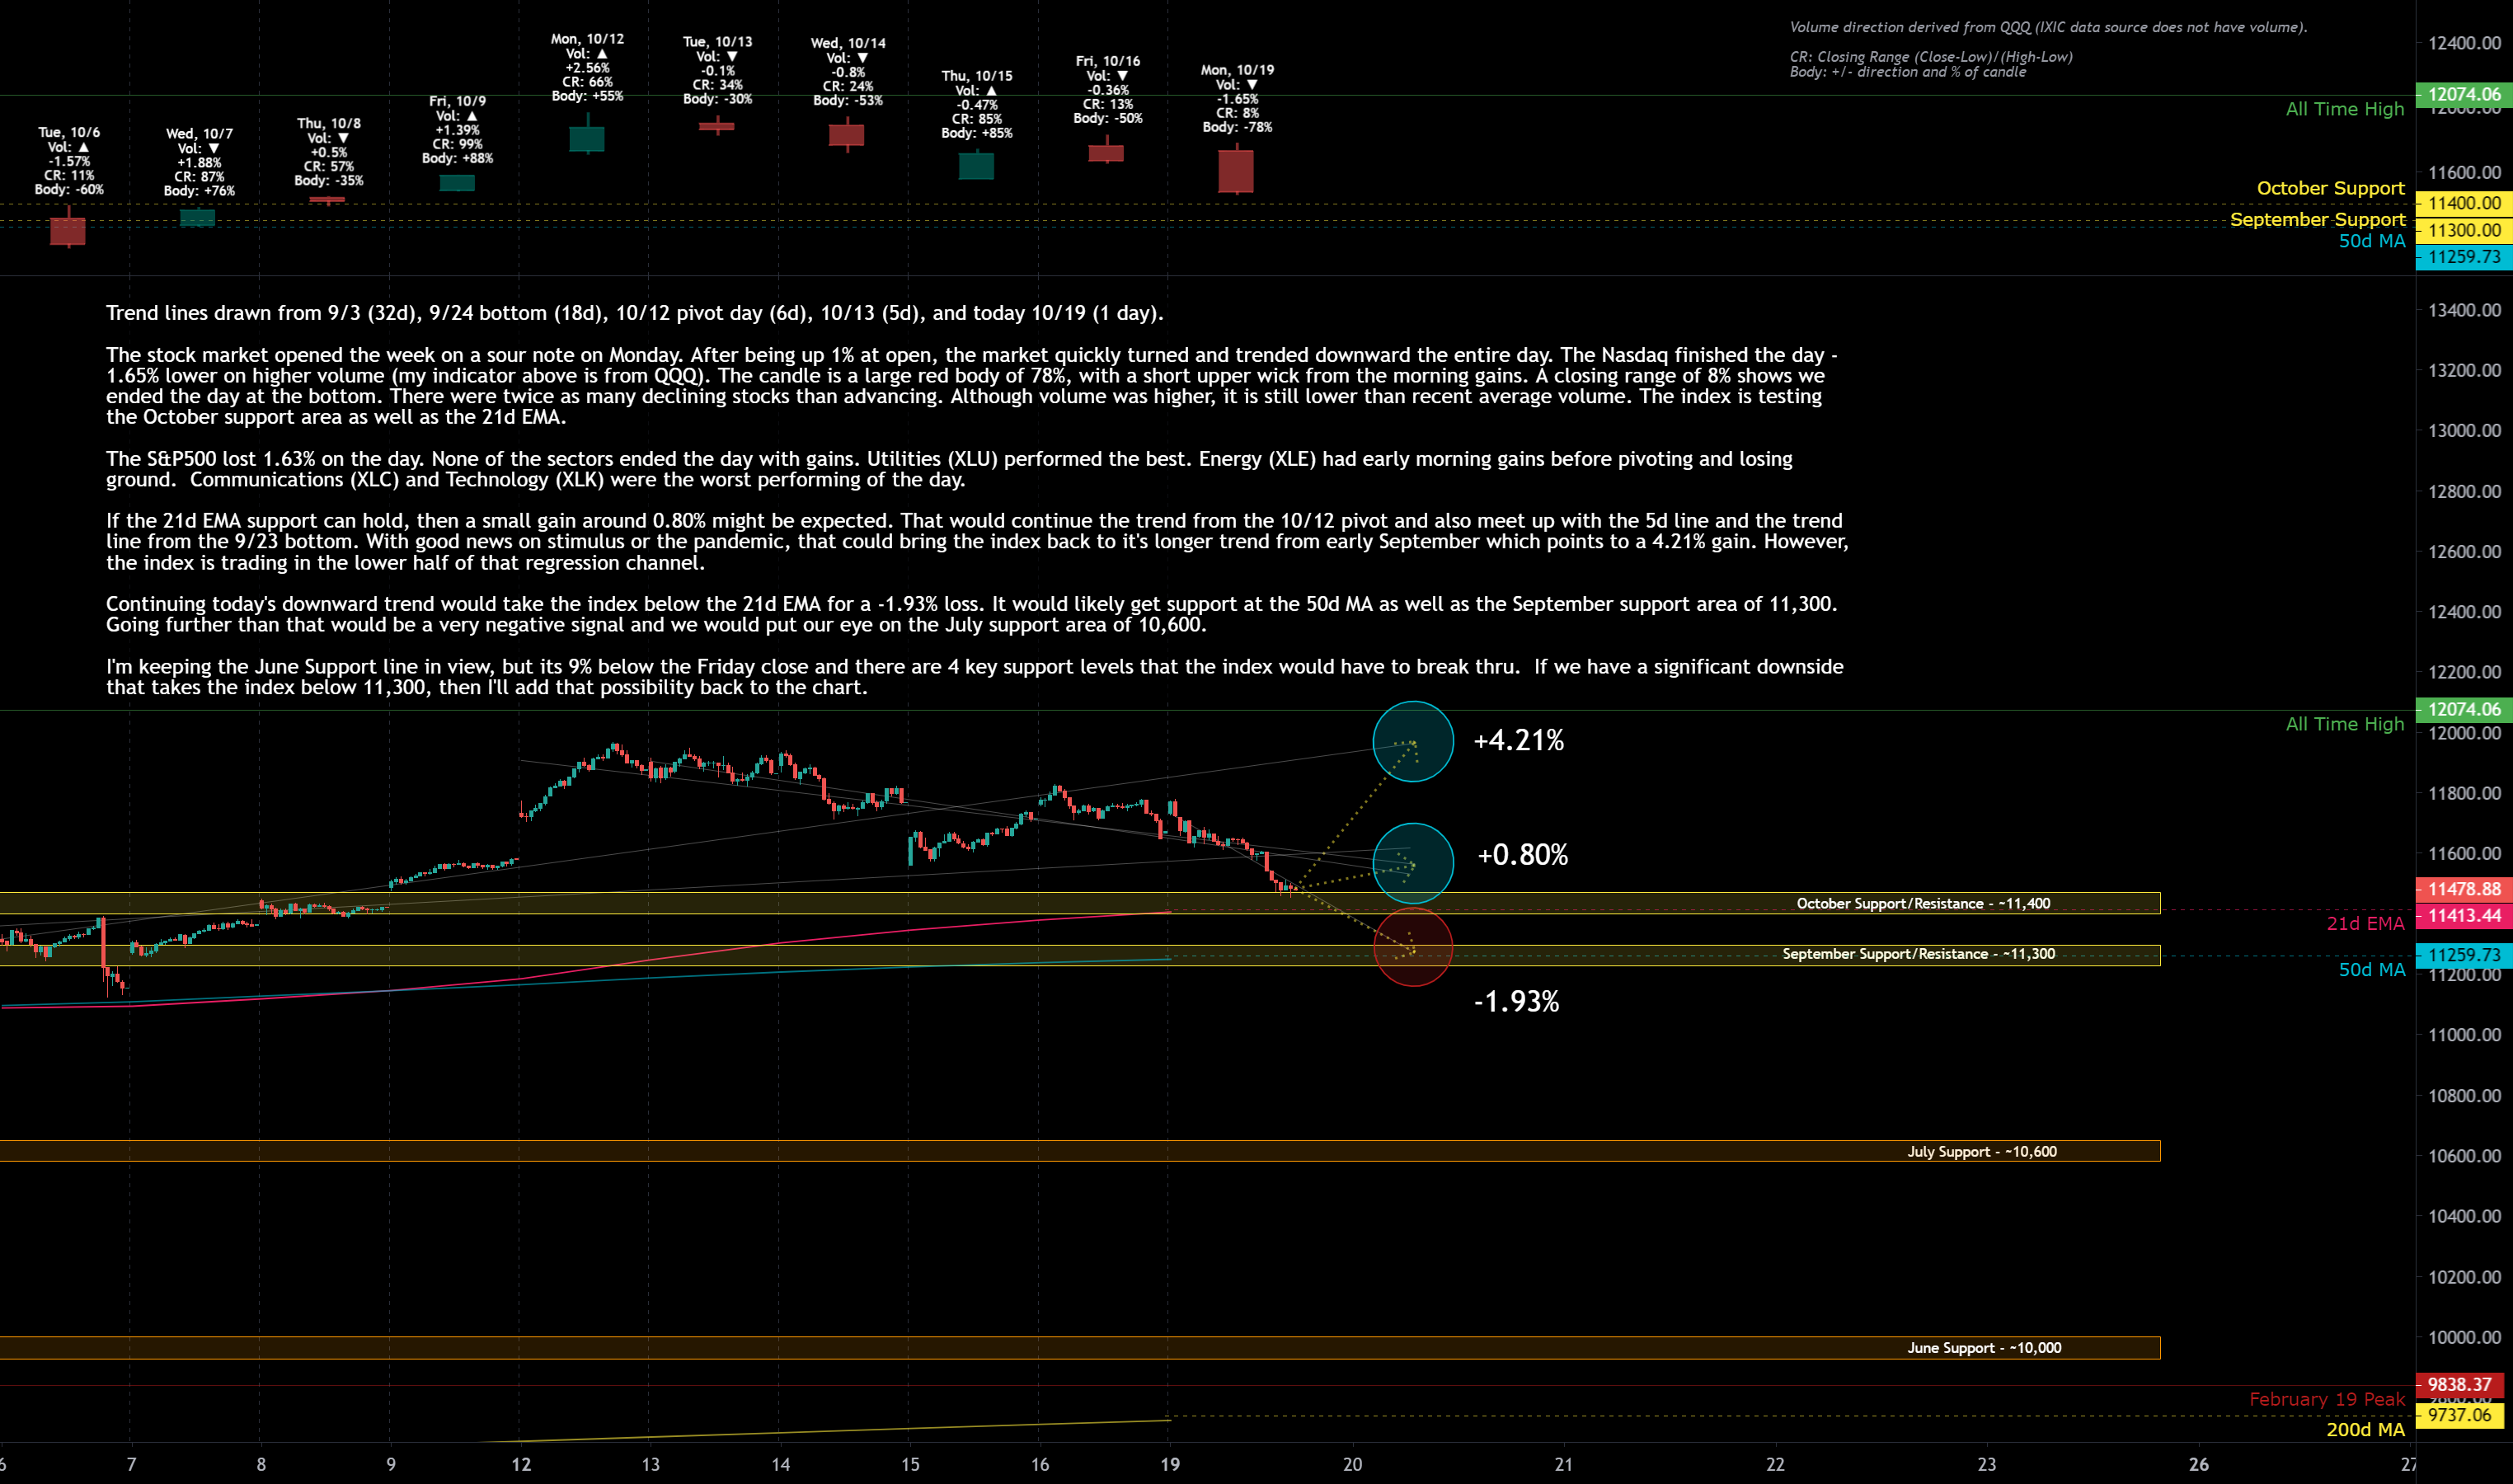
The stock market opened the week on a sour note on Monday. After being up 1% at open, the market quickly turned and trended downward the entire day. The Nasdaq finished the day -1.65% lower on higher volume (my indicator above is from QQQ ). The candle is a large red body of 78%, with a short upper wick from the morning gains. A closing range of 8% shows we ended the day at the bottom. There were twice as many declining stocks than advancing. Although volume was higher, it is still lower than recent average volume . The index is testing the October support area as well as the 21d EMA.
The S&P500 lost 1.63% on the day. None of the sectors ended the day with gains. Utilities ( XLU ) performed the best. Energy ( XLE ) had early morning gains before pivoting and losing ground. Communications ( XLC ) and Technology ( XLK ) were the worst performing of the day.
If the 21d EMA support can hold, then a small gain around 0.80% might be expected. That would continue the trend from the 10/12 pivot and also meet up with the 5d line and the trend line from the 9/23 bottom. With good news on stimulus or the pandemic, that could bring the index back to it's longer trend from early September which points to a 4.21% gain.
However, the index is trading in the lower half of that regression channel. Continuing today's downward trend would take the index below the 21d EMA for a -1.93% loss. It would likely get support at the 50d MA as well as the September support area of 11,300. Going further than that would be a very negative signal and we would put our eye on the July support area of 10,600.
-=x=-=x=-=x=-=x=-=x=-=x=-=x=-=x=-=x=-=x=-=x=-=x=-=x=-=x=-=x=-=x=-=x=-=x=-=x=-=x=-=x=-=x=-=x=-=x=-=x=-=x=-=x=-=x=-=x=-=x=-
Tuesday, October 20, 2020
I know why you want to hate me
Facts: 0.33% higher, Volume higher, Closing range: 28%, Red Body: 9%
Good: Stayed above yesterday’s low and holding above 21d EMA
Bad: Very choppy day with selling into close
Highs/Lows: Lower high, Higher low (Inside day)
Candle: Inside day, 9% red body with 28% closing range.
Advance/Decline: 1.18, slightly more advancing than declining
Sectors: Utilities ( XLE ) finished the day on top. Consumer Discretionary ( XLY ) and Finance ( XLF ) led at mid-day but fell off. Consumer Staples ( XLP ) was the worst performing.
Expectation: Sideways or Lower
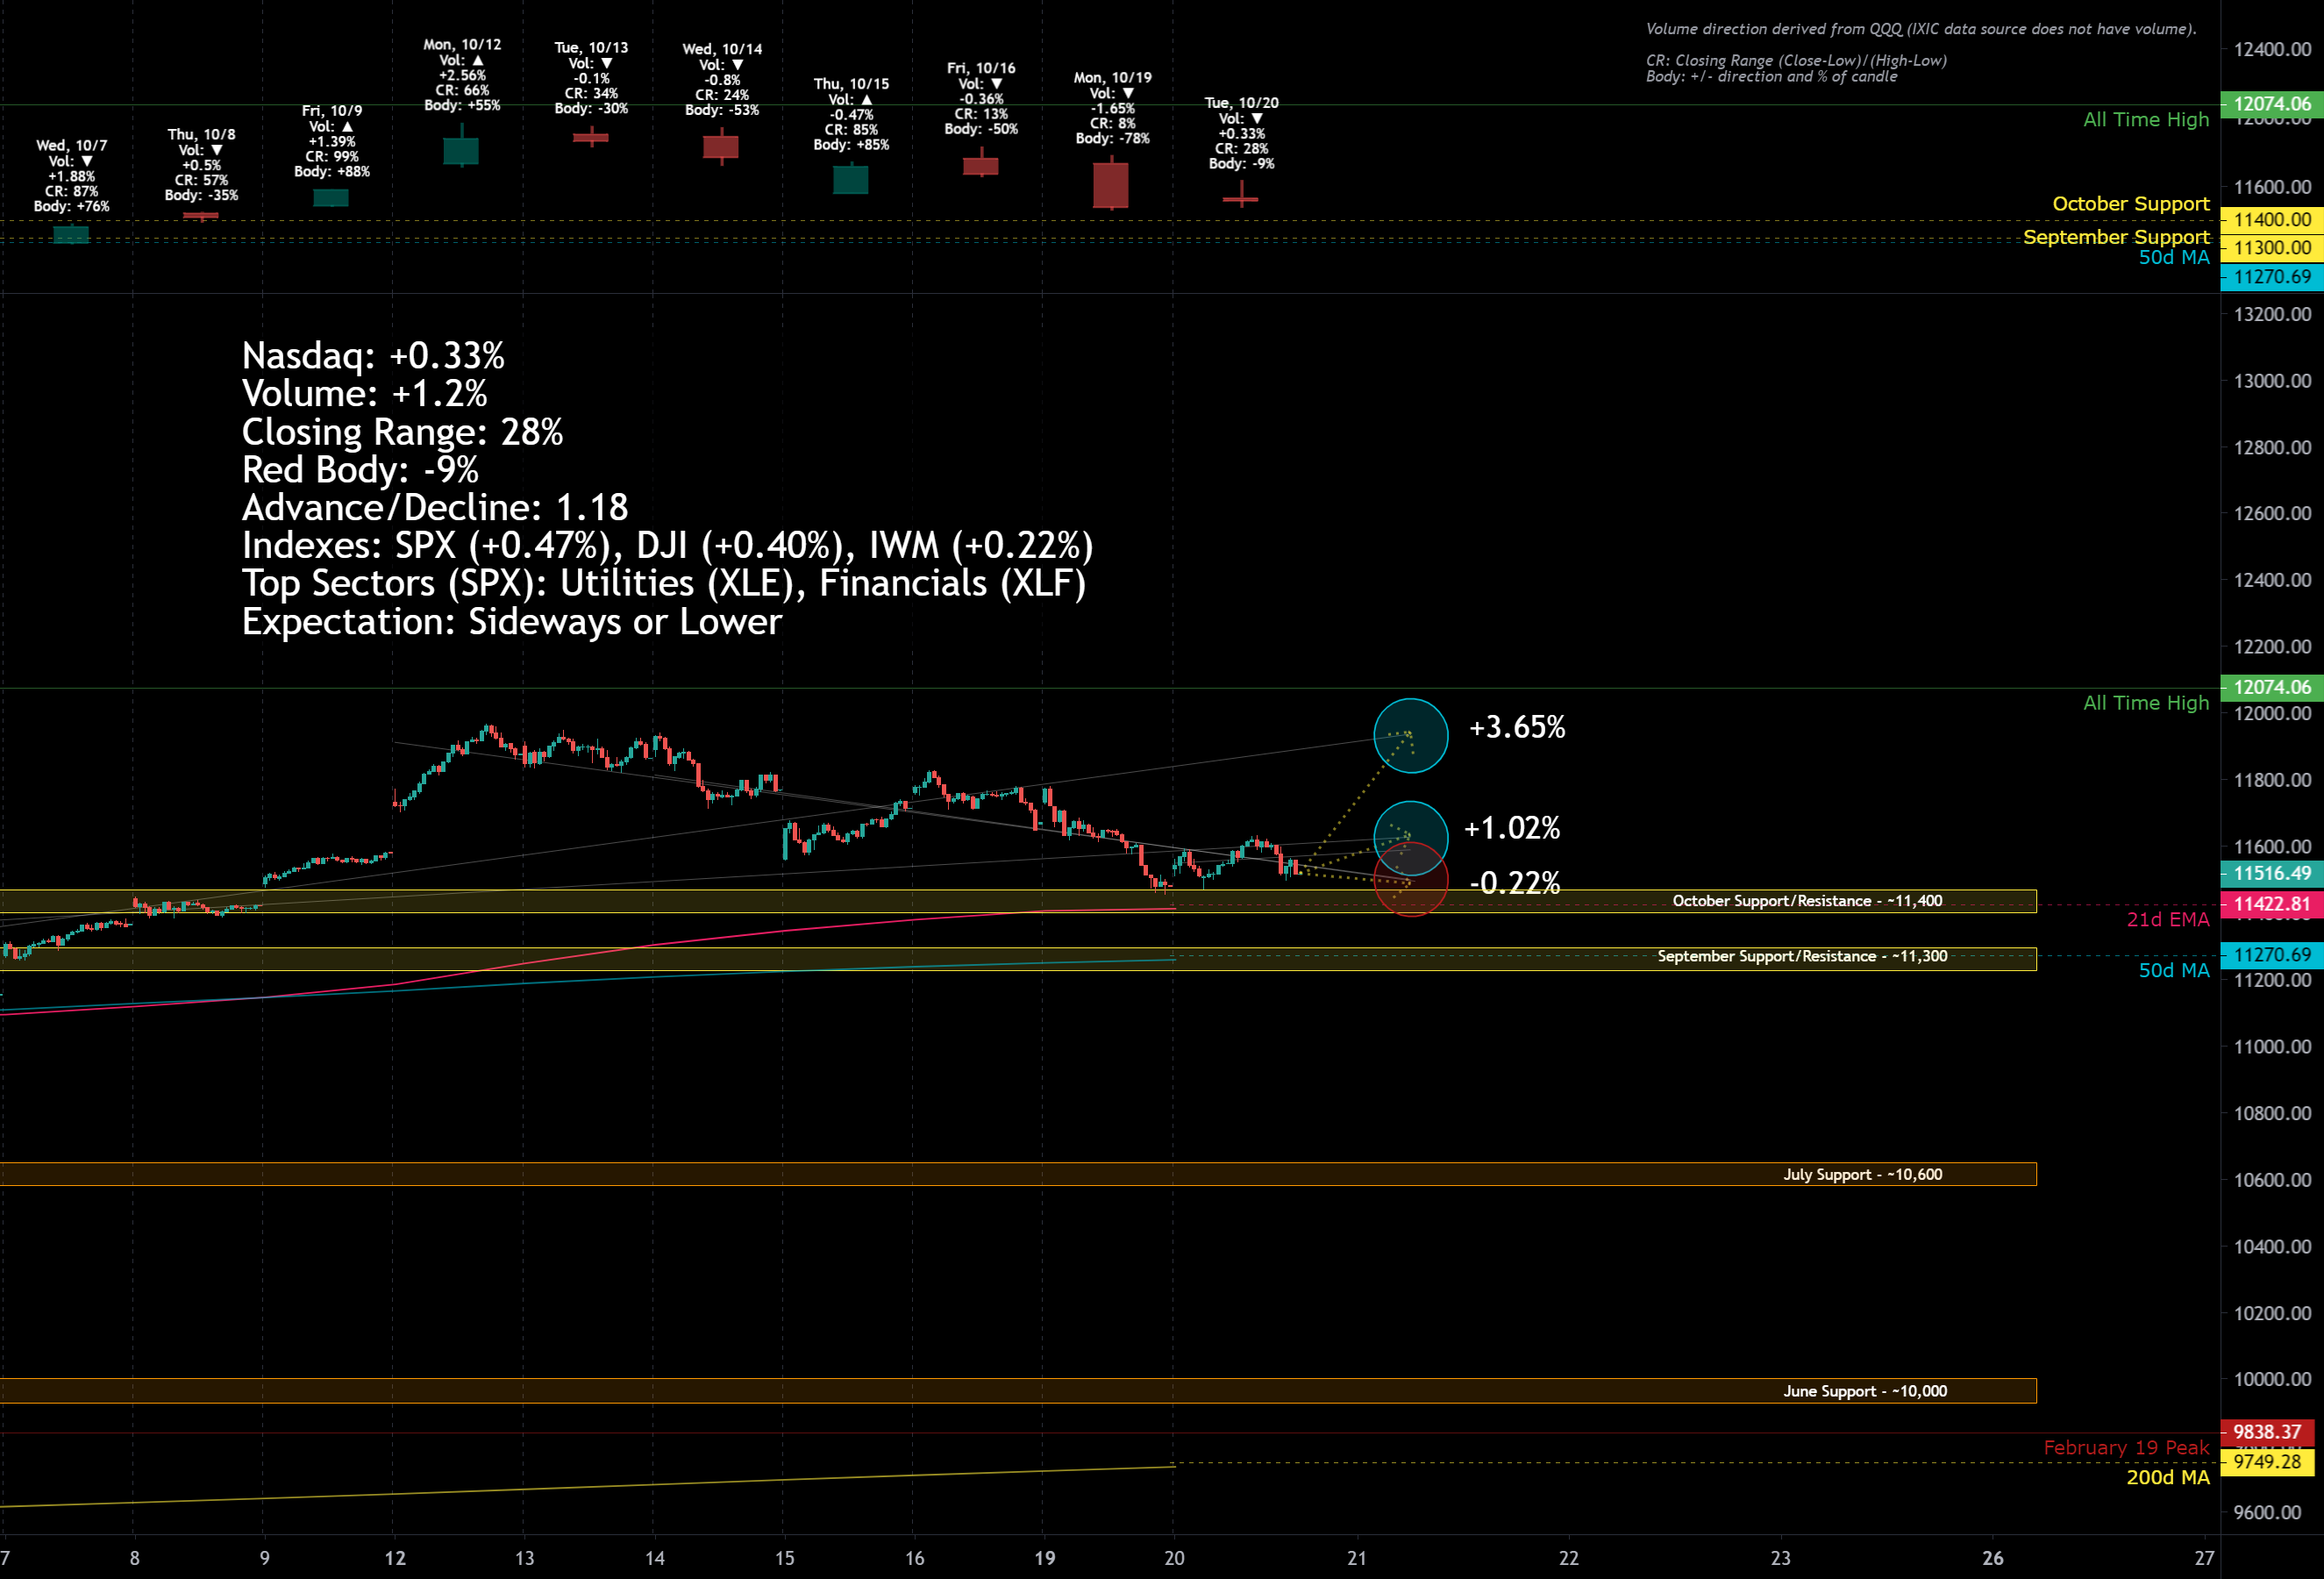
It was a choppy day with many moves back and forth. After being up 1.34% at one point in the day, the Nasdaq dropped in afternoon selling, ending the day with a 0.33% gain. The candle has a thin negative body of 9% and a lower closing range of 28%. The inside day (recognized by the price range being within the previous days range) often marks a continuation of the current trend. There were slightly more advancing stocks than declining stocks. Although volume was higher, it is still lower than recent average volume . The index is still testing October support area and the 21d EMA . Breaking the 21d EMA would be a negative signal.
The S&P500 gained +0.47%, with Utilities ( XLE ) ending the day as the leading sector. Consumer Discretionary ( XLY ) and Financials ( XLF ) both led at mid-day but lost those gains in the late afternoon. Consumer Staples ( XLP ) was the worst performing sector today and the only sector with a loss.
The mega-caps all saw gains with Apple ( AAPL +1.32%) and Google ( GOOG +1.39%) outperforming the indexes. Microsoft ( MSFT +0.20%) and Amazon ( AMZN +0.31%) turned in smaller gains. Growth stock Tesla ( TSLA -2.06%) continues to lose ground heading in Wednesday earnings . Logitech ( LOGI +15.76%) had a huge gap up after bearing expectations. Some 2020 favorites such as Zoom (ZM -5.51%), Datadog ( DDOG -2.75%), and Pinterest (PINS -1.09%) had losing days. Snap (SNAP -0.74%) is up over 22% after hours after also smashing expectations.
As for expectations, a lot depends on news coming from ongoing stimulus discussions. A positive sign of an agreement could have the index bounce of this support area and move up +3.65% to rejoin the trend line drawn from the 9/23 bottom. Another potential outcome is that stimulus talks continue and investors remain optimistic which could result in a +1.02% gain, continuing today’s trend line and rejoining the trend from 9/3.
The index is trading in the lower half of all these regression trends. However, there seems to be good support at the 21d EMA and so a downward move looks like it would be limited to a -0.22% loss. That would continue along the trend drawn from the pivot on 10/12. If investor sentiment were to worsen, the index could break through the 21d EMA and then hopefully find support at the 50d MA.
-=x=-=x=-=x=-=x=-=x=-=x=-=x=-=x=-=x=-=x=-=x=-=x=-=x=-=x=-=x=-=x=-=x=-=x=-=x=-=x=-=x=-=x=-=x=-=x=-=x=-=x=-=x=-=x=-=x=-=x=-
Wednesday, October 21, 2020
Have you heard about the Lonesome Loser?
He's a loser but he still keeps on trying.
Facts: 0.28% lower, Volume lower, Closing range: 6%, Red Body: 33%
Good: Still holding above 21d EMA
Bad: Another choppy day with selling into close
Highs/Lows: Lower high, Higher low (Inside day)
Candle: Inside day, 33% red body with 6% closing range.
Advance/Decline: 0.61, ratio of 3:2 decliners to advancers
Sectors: Communication Services ( XLC ) stole the day as the big winner. Energy ( XLE ) was the worst performing.
Expectation: Sideways or Lower
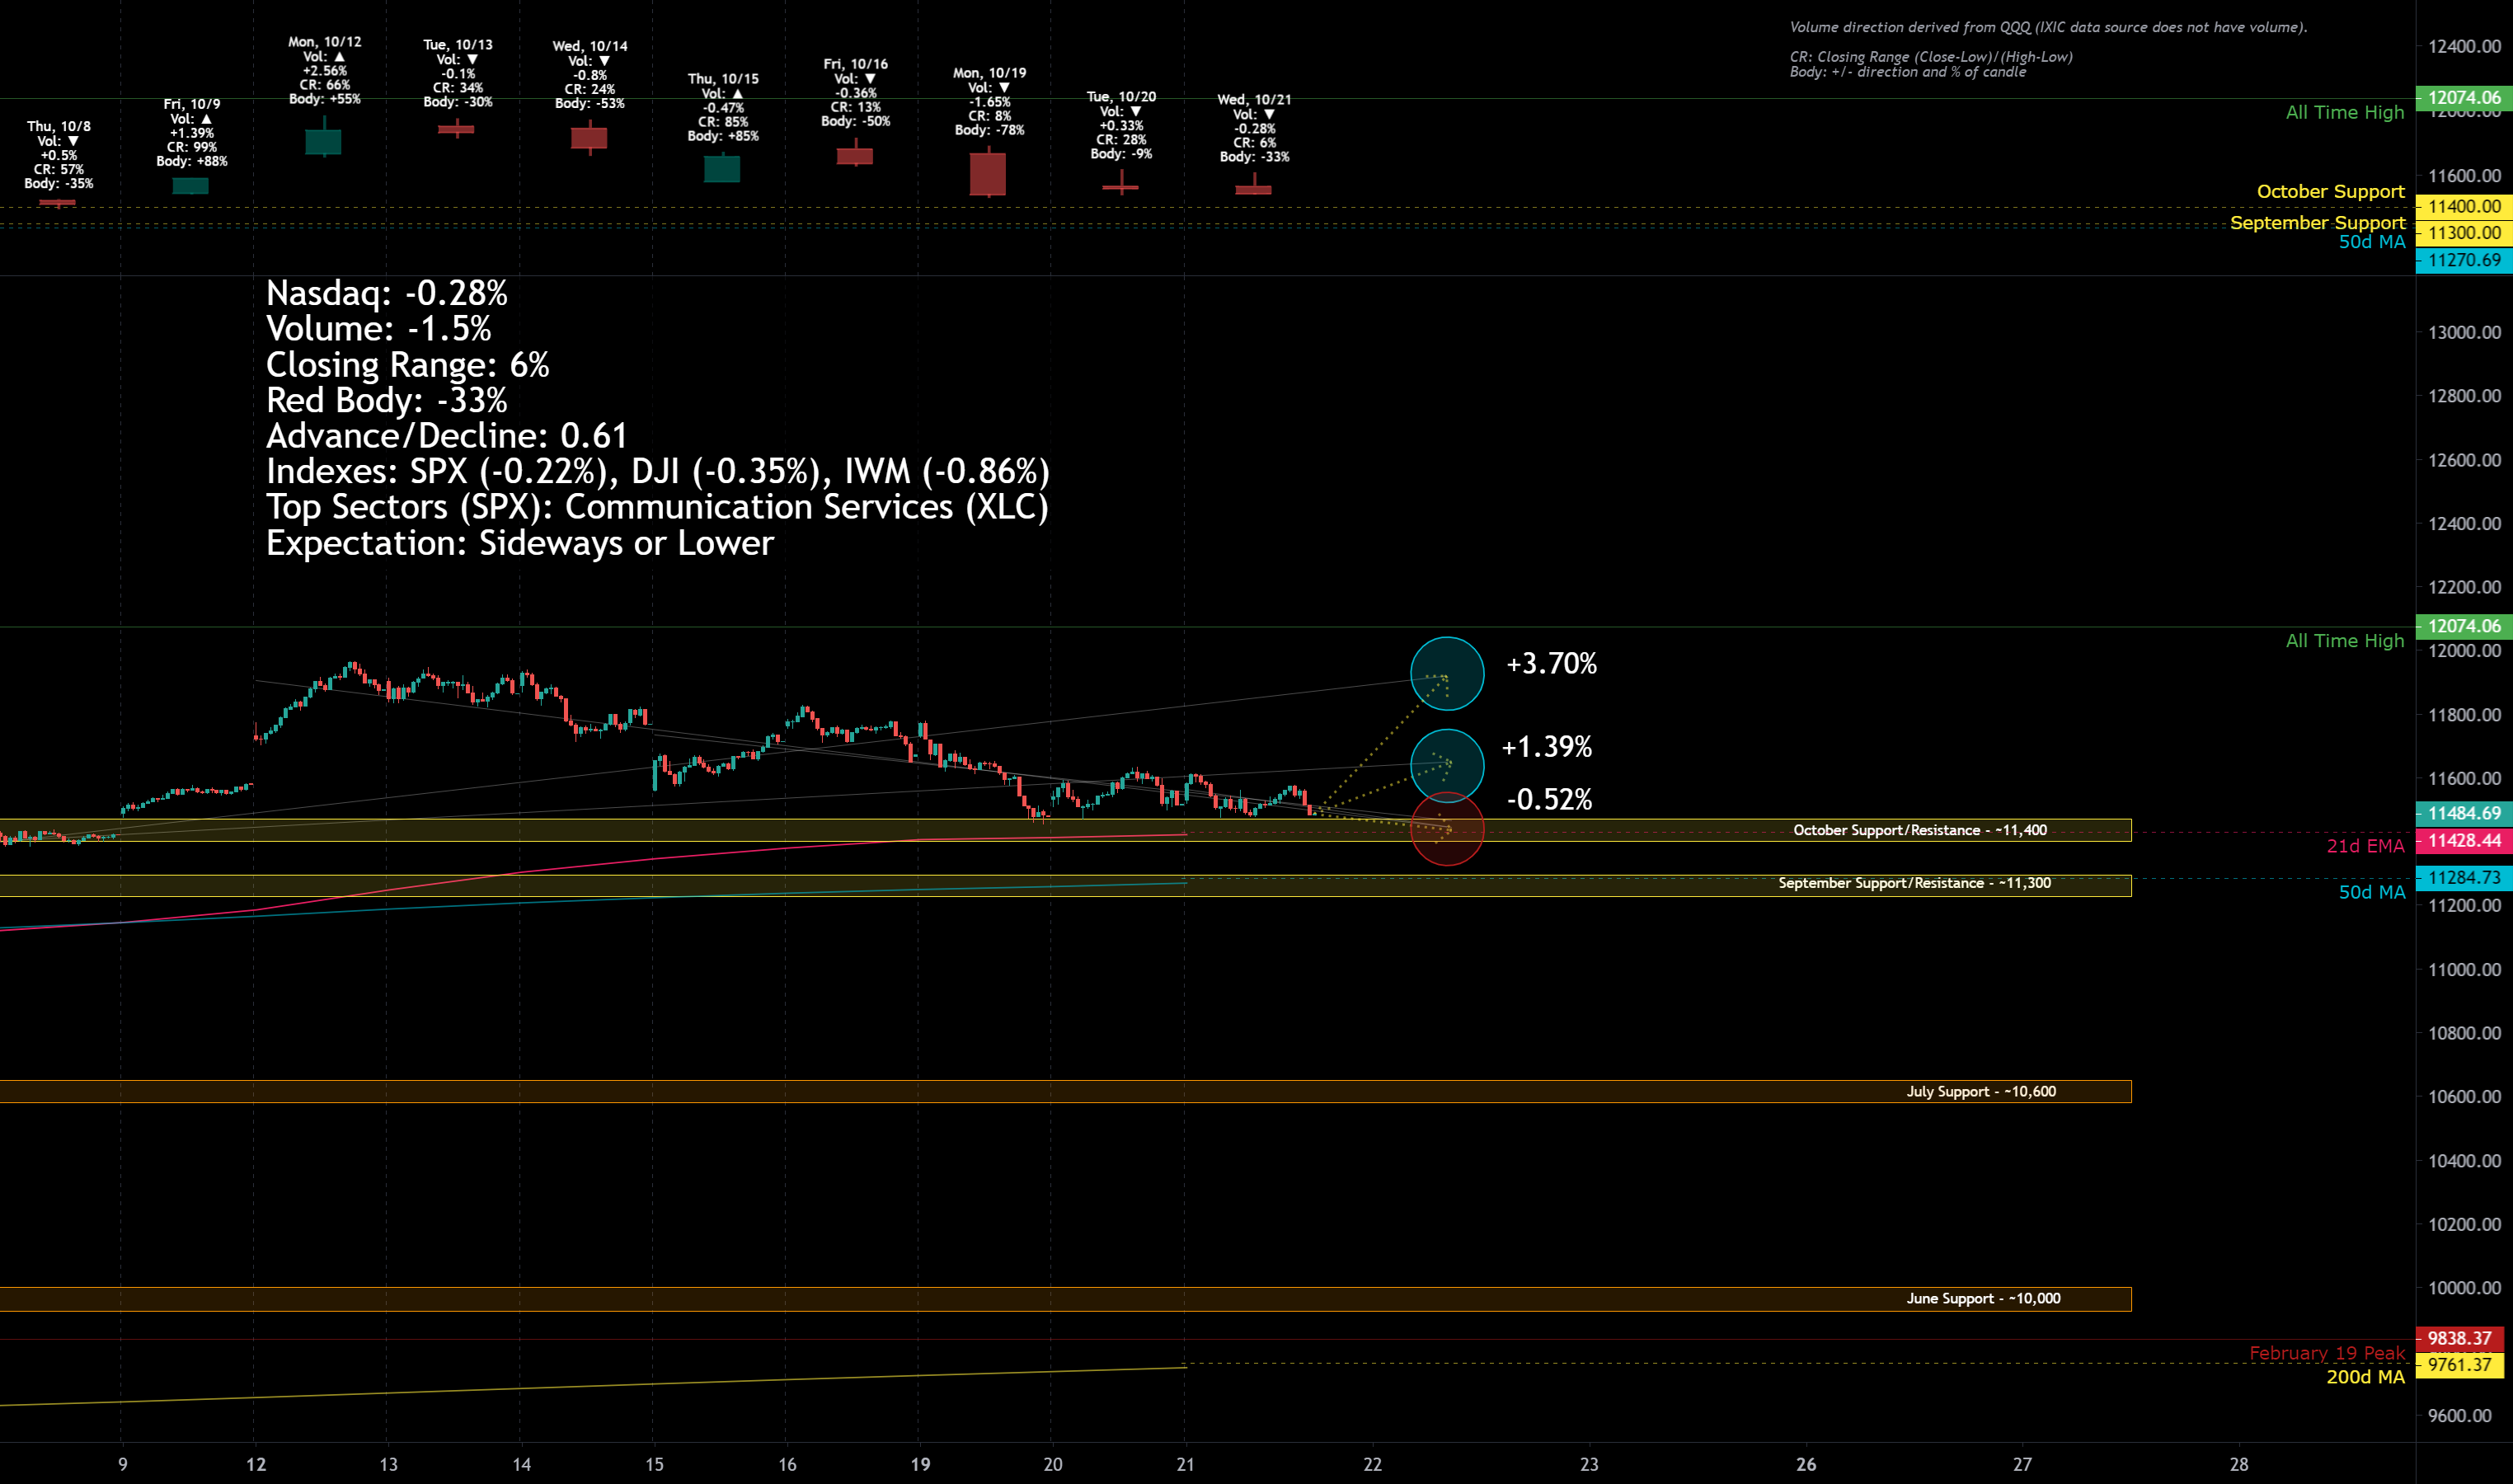
Wednesday was a continuation of Tuesday with an attempt to make gains that sold off in a choppy fashion throughout the rest of the day. After gaining 0.84%, the Nasdaq dropped to close with a -0.28% loss. The candle has a very tiny lower wick with a 33% red body and 6% closing range. Another inside day (recognized by the price range being within the previous days range) shows little direction in which way the market will go. There were more declining stocks than advancing stocks at a ratio of 3:2. Volume was lower than the previous day and continues to be lower than recent averages. The index is still testing October support area and the 21d EMA . Breaking the 21d EMA would be a negative signal.
The S&P500 lost -0.22%, despite all the efforts of Communication Services ( XLC ) sector which gained 1.68%. Most of the other sectors incurred losses of around 0.5%. Industrials ( XLI ) lost -1.01%. Energy ( XLE ) was the worst performing sector with a loss of -1.91%.
Google ( GOOG +2.4%), Facebook ( FB +4.17%) and Twitter ( TWTR +8.39%) drove huge gains in the Communication Services sector, possibly all helped by the Snap (SNAP +28.30%) earnings beat which earned the social platform a massive gain. Netflix ( NFLX -6.92%) retreated on news of lower than expected earnings and slowing subscriber growth. Other mega-caps Apple ( AAPL -0.24%), Amazon ( AMZN -1.0%) and Microsoft ( MSFT -0.09%) did not fair as well with Apple and Amazon closing below 21d EMA and 50d MA lines. Tesla ( TSLA +0.17%) announced an earnings beat after market close and is up over 3% in after hours trading. Recent growth favorites Peloton (PTON -5.78%), Fiverr ( FVRR -9.30%) and Datadog ( DDOG -5.91%) are all losing recent gains.
The trend lines provide a few possibilities, but much still depends on news coming from ongoing stimulus discussions. With some positive news, a gain of +3.70% would rejoin the trend line drawn from the 9/23 bottom. If the mega-caps and a breadth of stocks of regain ground, a more likely result would be a +1.39% gain, rejoining the trend from 9/3.
With all but XLC having a challenging Wednesday, the big test for Thursday will be whether the index can hold above the October support and 21d EMA lines. That support looks in jeopardy at this point given the momentum. A downward move looks like it would be around -0.52% loss, possibly dipping below the 21d EMA and then coming back up to as a resistance line. That would continue today’s trend line and the trend drawn from the pivot on 10/12. If investor sentiment were to worsen, the index could go further below the 21d EMA and then hopefully find support at the 50d MA.
-=x=-=x=-=x=-=x=-=x=-=x=-=x=-=x=-=x=-=x=-=x=-=x=-=x=-=x=-=x=-=x=-=x=-=x=-=x=-=x=-=x=-=x=-=x=-=x=-=x=-=x=-=x=-=x=-=x=-=x=-
Thursday, October 22, 2020
Livin’ on a prayer.
Facts: 0.19% higher, Volume lower, Closing range: 76%, Red Body: -12%
Good: Reversed from morning lows to end day positive
Bad: Dipped below 21d EMA
Highs/Lows: Lower high, Lower low
Candle: Looks like a hammer , 12% red body with 76% closing range.
Advance/Decline: 1.76, more advancers than decliners
Sectors: Energy ( XLE ) had a huge 4.13% gain. Financial ( XLF ), Health ( XLV ) and Utilities ( XLU ) also had good days.
Expectation: Sideways or Higher
Finally, there is a bit of character change in the market. After several days of morning gains selling off in afternoon trading, the opposite happened on Thursday. A big morning loss that took the index below the 21d EMA was bought back in the afternoon to end the day with gains. The Nasdaq ended the day with a 0.19% gain. The candle, with a 76% closing range and 12% red body looks like a reversal hammer . That will need to be confirmed with the next few days of trading. Volume was lower (my indicator above is based on QQQ volume ) for the Nasdaq and continues to be lower than average volume in recent weeks. For a true hammer candlestick , we'd want to see higher volume . There were more advancing stocks than declining stocks at a ratio of 1.76. It’s a positive sign that the index regained it’s ground and closed above the 21 day EMA .
The S&P500 had a similar pattern and closed the day with a 0.52% gain, led by Energy ( XLE +4.13%) and Financial ( XLF +1.99%). Most of the sectors saw gains on the day. Technology ( XLK -0.24%) and Real Estate ( XLRE -0.70%) were the worst performing. The Russell 2000 Index had gains of 1.65% as investors looked for good opportunities in small cap stocks.
Google ( GOOG +1.38%) led the mega-cap stocks with it’s second day of solid gains. Apple ( AAPL -0.96%) and Amazon ( AMZN -0.27%) had losses on the day and continue to trade below their 50 day MA. It would be a positive sign for an overall upward trend if these mega-caps got back above this key line. Chevron ( CVX +3.57%) and Exxon Mobil ( XOM +5.13%) along with almost every energy stock saw gains after talk of consolidation in the industry and layoffs at Exxon. Snap (SNAP +6.77%) continued it’s rally after an earnings breakout. Several growth stocks such as Restoration Hardware ( RH +4.34%) and Zoom (ZM +1.43%) had gains after several days of losses. This is all a good sign, but needs to be confirmed with additional gains from more growth stocks.
If the candlestick hammer is confirmed and we see gains from here, trend lines point to two possibilities. The first is a +1.01% gain in the area between today’s trend line and the trend drawn from the 9/3 correction start. Additional positive news could accelerate gains to reach the trend line draw from the 9/23 bottom. That would mean a +3.42% gain.
If the index cannot hold above the 21d EMA , then the 5 day trend and trend from the 10/12 pivot would point to a -1.50%. This is where the 50d MA line is at and where we’ve seen support from September trading.
-=x=-=x=-=x=-=x=-=x=-=x=-=x=-=x=-=x=-=x=-=x=-=x=-=x=-=x=-=x=-=x=-=x=-=x=-=x=-=x=-=x=-=x=-=x=-=x=-=x=-=x=-=x=-=x=-=x=-=x=-
Friday, October 23, 2020
We were runnin' against the wind
Facts: 0.37% higher, Volume lower, Closing range: 100%, Green Body: +11%
Good: Held above key support at 21d EMA
Bad: Low volume , not much price movement
Highs/Lows: Higher high (by a fraction), higher low
Candle: Long lower wick as investors bought up the lows to end nearly where the day started.
Advance/Decline: 1.63, more advancers than decliners
Sectors: Communication Services ( XLC ) led the day with +0.94% gain. Consumer Discretionary ( XLY ) also had a good day at +0.88%.
Expectation: Higher
One more day of reversals to close a choppy week. Every day this week had a morning move that reversed once or more by close. Earlier in the week it was higher highs that reversed to lower lows. At the end of the week, it was lows that reversed to close with gains. Today the Nasdaq ended with a +0.37% gain. The candle has a tiny 11% green body and 100% closing range as the day ended at its high, but not much above where it started. There were more advancing stocks than declining stocks at a ratio of 1.63. Volume was lower than the previous day and much lower than average volume over the past few weeks. The index tested the 21d EMA again and stayed above it.
The S&P500 had an even tighter range between open and close and ended with a similar +0.34% gain. Communication Services ( XLC +0.94%) had the best gains among sectors fueled by positive gains from social platforms. Consumer Discretionary ( XLY +0.88%) also did well today, with a mix of discount retailers, auto parts and restaurant/service companies doing well. Technology ( XLK -0.11%) and Energy ( XLE -0.49%) were the worst performing of the day. The Russell 2000 capped off a winning week with another +0.88% gain.
Google ( GOOG +1.59%) continued the momentum it has gained the last few weeks while Microsoft ( MSFT +0.62%) and Amazon ( AMZN +0.88%) finally found some support with significant gains. Apple ( AAPL -0.61%) and Amazon remain under their 21d EMA and 50d MA lines. The story of the week has been Snap (SNAP +10.78%) which continues to have incredible gains after it’s earnings release. More growth stocks have turned back toward gains which is a positive sign for continued gains next week.
Continuing today’s trend into Monday would mean around a +0.66% gain, splitting the difference between the 1d trend line and the trend drawn from the 9/3 correction. The trend from the 9/24 bottom is +2.67% from today’s close and is a possibility if good news comes over the weekend to fuel gains.
As the index continues to test the 21d EMA , it’s possible it can find itself below that line. That would continue this past week’s trend to a -1.29% loss and land under the October Support area . Further losses would find the 50d MA and the index would likely get support at that level.
-=x=-=x=-=x=-=x=-=x=-=x=-=x=-=x=-=x=-=x=-=x=-=x=-=x=-=x=-=x=-=x=-=x=-=x=-=x=-=x=-=x=-=x=-=x=-=x=-=x=-=x=-=x=-=x=-=x=-=x=-
Larger View on the Week
This was not an easy week to be trading in the stock market. It started with a huge disappointment on Monday where the market started with gains and then quickly lost them for a 1.65% loss. And the rest of the week traded in the lower half of Monday's range, testing October support area and dipping below the 21d EMA once. the closing range on the week is 44%, not terrible but also not great. There were some good signs. Despite the dip below the 21d EMA, the index recovered and otherwise traded above that key support line. The character of Monday to Wednesday of higher opens and lower closes changed on Thursday and Friday with lows turning into intraday highs and closing at the upper range of the day's candles. The closing range on Friday was 100% as the market was on an uptrend heading into the weekend. That's good support at the current price range to build a base going into next week.
US Treasury Yield spreads were up for the week and continue to be on an upward trend since dipping in mid-July. This is a good sign from investors that they staying out of the bond market and in the stock market.
Looking at the mega-caps, Microsoft (MSFT), Apple (AAPL) and Amazon (AMZN) were down on the week with -1.56%, -3.34% and -2.09% losses respectively. Google (GOOG) and Facebook (FB) had great weeks, with +4.32% and +7.09% gains and driving huge gains in the Communication Services sector, specifically social platform stocks. Pinterest (PINS) had a 20% gain. There was the amazing Snap (SNAP) earnings release and 50% gain of that stock. Twitter (TWTR) was up 10%. Beyond those, there were a lot of mixed results. Many of the growth stocks had a tough week although turned in positive gains on Friday. On a daily average, there were more advancers than decliners, but the value of the declines were bigger.
Clearly Communication Services (XLC) was the winning sector of the week, but there was also some back and forth in that race. Consumer Discretionary (XLY) came into the week as the leader, with early gains that faded later in the week. Energy (XLE) had a huge day on Thursday with +4.13% gains that put it at the top of the sectors for a day before giving up the lead to Communication Services on Friday. Financials (XLF) had a good week and Utilities (XLU) continues to turn in consistent performance as a safe bet for conservative investors. It's not often that Technology (XLK) finds itself at the bottom of the sector list, and that is really where to story begins for next week.
-=x=-=x=-=x=-=x=-=x=-=x=-=x=-=x=-=x=-=x=-=x=-=x=-=x=-=x=-=x=-=x=-=x=-=x=-=x=-=x=-=x=-=x=-=x=-=x=-=x=-=x=-=x=-=x=-=x=-=x=-
The Week Ahead
The next week will be a pivotal one for where the market goes next. The questions for the indexes will be whether they can continue the character change from Thursday and Friday and turn that into gains early in the week. They are still testing key support areas and the 21d EMA, often used by investors as an indicator of market health.
Economic news will include New Home Sales, Consumer Confidence and Q3 GDP and are all expected to increase. Positive news in these economic indicators could give the market a boost.
However, probably more attention will be paid to big earnings releases happening next week. There is a huge number of earnings reports scheduled, with a high concentration of technology stocks. Given the technology sector just had an awful week and still influences the broader stock market heavily, the positive and negative earnings reports could have a huge impact. Microsoft (MSFT) will announce on Tuesday, 10/27 and Apple will announce on Thursday 10/29. Shopify (SHOP) which has had a huge growth year, also reports on Thursday.
Of course, you can't discount the influence of the election and the continuing worldwide pandemic. The election seems to already be priced in, but uncertainty around the results and how the candidates will react in either direction is making everyone nervous. The pandemic is accelerating with new highs in daily case counts and people are watching closely what that does to hospital bed availability and death rates worldwide.
-=x=-=x=-=x=-=x=-=x=-=x=-=x=-=x=-=x=-=x=-=x=-=x=-=x=-=x=-=x=-=x=-=x=-=x=-=x=-=x=-=x=-=x=-=x=-=x=-=x=-=x=-=x=-=x=-=x=-=x=-
Key Nasdaq Levels to Watch
There are several key levels in the Nasdaq to keep an eye out for and respond accordingly. First on the positive side:
On the downside, there are several key levels to raise red flags, many similar to what we watched for last week:
-=x=-=x=-=x=-=x=-=x=-=x=-=x=-=x=-=x=-=x=-=x=-=x=-=x=-=x=-=x=-=x=-=x=-=x=-=x=-=x=-=x=-=x=-=x=-=x=-=x=-=x=-=x=-=x=-=x=-=x=-
Wrap-up
Next week will certainly be an intense one to watch. Will we have huge gains from positive economic news and earnings reports? Or will the news disappoint and we have big losses? Or maybe, nothing. Maybe more sideways because investors just want to wait and see on the election and coronavirus news.
Either way, it's important to have a plan. Watch for the key levels in the market, and weigh your exposure against the level of risk you see. Making smaller bets and adding after things go you way is a good approach. Raising cash and waiting it out is also a valid strategy for uncertain weeks.
Good luck and trade safe!
If you find this helpful, please let me know in the comments. I'm also more than happy to add new perspectives and data points if you have ideas.
The structure is the following:
- A recap of the daily updates that I do here on TradingView.
- Larger view on the past week
- What's coming in the next week
- Key index levels to watch out for
- Wrap-up
-=x=-=x=-=x=-=x=-=x=-=x=-=x=-=x=-=x=-=x=-=x=-=x=-=x=-=x=-=x=-=x=-=x=-=x=-=x=-=x=-=x=-=x=-=x=-=x=-=x=-=x=-=x=-=x=-=x=-=x=-
Monday, October 19, 2020
Pray tomorrow takes me higher
Facts: 1.65% lower, Volume higher, Closing range: 8%, Red Body: 78%
Good: Held above 21d EMA , volume still not super high
Bad: Almost everything, start up 1% but go down the whole day
Candle: 78% red body with 8% closing range.
Advance/Decline: 0.35, twice as many stocks declining than advancing
Sectors: All sectors were down, but Utilities ( XLU ) was the best performing of the day. Energy ( XLE ) led with gains in the morning. Technology ( XLK ) and Communications ( XLC ) were worst of day.
Expectation: Sideways or Lower
The stock market opened the week on a sour note on Monday. After being up 1% at open, the market quickly turned and trended downward the entire day. The Nasdaq finished the day -1.65% lower on higher volume (my indicator above is from QQQ ). The candle is a large red body of 78%, with a short upper wick from the morning gains. A closing range of 8% shows we ended the day at the bottom. There were twice as many declining stocks than advancing. Although volume was higher, it is still lower than recent average volume . The index is testing the October support area as well as the 21d EMA.
The S&P500 lost 1.63% on the day. None of the sectors ended the day with gains. Utilities ( XLU ) performed the best. Energy ( XLE ) had early morning gains before pivoting and losing ground. Communications ( XLC ) and Technology ( XLK ) were the worst performing of the day.
If the 21d EMA support can hold, then a small gain around 0.80% might be expected. That would continue the trend from the 10/12 pivot and also meet up with the 5d line and the trend line from the 9/23 bottom. With good news on stimulus or the pandemic, that could bring the index back to it's longer trend from early September which points to a 4.21% gain.
However, the index is trading in the lower half of that regression channel. Continuing today's downward trend would take the index below the 21d EMA for a -1.93% loss. It would likely get support at the 50d MA as well as the September support area of 11,300. Going further than that would be a very negative signal and we would put our eye on the July support area of 10,600.
-=x=-=x=-=x=-=x=-=x=-=x=-=x=-=x=-=x=-=x=-=x=-=x=-=x=-=x=-=x=-=x=-=x=-=x=-=x=-=x=-=x=-=x=-=x=-=x=-=x=-=x=-=x=-=x=-=x=-=x=-
Tuesday, October 20, 2020
I know why you want to hate me
Facts: 0.33% higher, Volume higher, Closing range: 28%, Red Body: 9%
Good: Stayed above yesterday’s low and holding above 21d EMA
Bad: Very choppy day with selling into close
Highs/Lows: Lower high, Higher low (Inside day)
Candle: Inside day, 9% red body with 28% closing range.
Advance/Decline: 1.18, slightly more advancing than declining
Sectors: Utilities ( XLE ) finished the day on top. Consumer Discretionary ( XLY ) and Finance ( XLF ) led at mid-day but fell off. Consumer Staples ( XLP ) was the worst performing.
Expectation: Sideways or Lower
It was a choppy day with many moves back and forth. After being up 1.34% at one point in the day, the Nasdaq dropped in afternoon selling, ending the day with a 0.33% gain. The candle has a thin negative body of 9% and a lower closing range of 28%. The inside day (recognized by the price range being within the previous days range) often marks a continuation of the current trend. There were slightly more advancing stocks than declining stocks. Although volume was higher, it is still lower than recent average volume . The index is still testing October support area and the 21d EMA . Breaking the 21d EMA would be a negative signal.
The S&P500 gained +0.47%, with Utilities ( XLE ) ending the day as the leading sector. Consumer Discretionary ( XLY ) and Financials ( XLF ) both led at mid-day but lost those gains in the late afternoon. Consumer Staples ( XLP ) was the worst performing sector today and the only sector with a loss.
The mega-caps all saw gains with Apple ( AAPL +1.32%) and Google ( GOOG +1.39%) outperforming the indexes. Microsoft ( MSFT +0.20%) and Amazon ( AMZN +0.31%) turned in smaller gains. Growth stock Tesla ( TSLA -2.06%) continues to lose ground heading in Wednesday earnings . Logitech ( LOGI +15.76%) had a huge gap up after bearing expectations. Some 2020 favorites such as Zoom (ZM -5.51%), Datadog ( DDOG -2.75%), and Pinterest (PINS -1.09%) had losing days. Snap (SNAP -0.74%) is up over 22% after hours after also smashing expectations.
As for expectations, a lot depends on news coming from ongoing stimulus discussions. A positive sign of an agreement could have the index bounce of this support area and move up +3.65% to rejoin the trend line drawn from the 9/23 bottom. Another potential outcome is that stimulus talks continue and investors remain optimistic which could result in a +1.02% gain, continuing today’s trend line and rejoining the trend from 9/3.
The index is trading in the lower half of all these regression trends. However, there seems to be good support at the 21d EMA and so a downward move looks like it would be limited to a -0.22% loss. That would continue along the trend drawn from the pivot on 10/12. If investor sentiment were to worsen, the index could break through the 21d EMA and then hopefully find support at the 50d MA.
-=x=-=x=-=x=-=x=-=x=-=x=-=x=-=x=-=x=-=x=-=x=-=x=-=x=-=x=-=x=-=x=-=x=-=x=-=x=-=x=-=x=-=x=-=x=-=x=-=x=-=x=-=x=-=x=-=x=-=x=-
Wednesday, October 21, 2020
Have you heard about the Lonesome Loser?
He's a loser but he still keeps on trying.
Facts: 0.28% lower, Volume lower, Closing range: 6%, Red Body: 33%
Good: Still holding above 21d EMA
Bad: Another choppy day with selling into close
Highs/Lows: Lower high, Higher low (Inside day)
Candle: Inside day, 33% red body with 6% closing range.
Advance/Decline: 0.61, ratio of 3:2 decliners to advancers
Sectors: Communication Services ( XLC ) stole the day as the big winner. Energy ( XLE ) was the worst performing.
Expectation: Sideways or Lower
Wednesday was a continuation of Tuesday with an attempt to make gains that sold off in a choppy fashion throughout the rest of the day. After gaining 0.84%, the Nasdaq dropped to close with a -0.28% loss. The candle has a very tiny lower wick with a 33% red body and 6% closing range. Another inside day (recognized by the price range being within the previous days range) shows little direction in which way the market will go. There were more declining stocks than advancing stocks at a ratio of 3:2. Volume was lower than the previous day and continues to be lower than recent averages. The index is still testing October support area and the 21d EMA . Breaking the 21d EMA would be a negative signal.
The S&P500 lost -0.22%, despite all the efforts of Communication Services ( XLC ) sector which gained 1.68%. Most of the other sectors incurred losses of around 0.5%. Industrials ( XLI ) lost -1.01%. Energy ( XLE ) was the worst performing sector with a loss of -1.91%.
Google ( GOOG +2.4%), Facebook ( FB +4.17%) and Twitter ( TWTR +8.39%) drove huge gains in the Communication Services sector, possibly all helped by the Snap (SNAP +28.30%) earnings beat which earned the social platform a massive gain. Netflix ( NFLX -6.92%) retreated on news of lower than expected earnings and slowing subscriber growth. Other mega-caps Apple ( AAPL -0.24%), Amazon ( AMZN -1.0%) and Microsoft ( MSFT -0.09%) did not fair as well with Apple and Amazon closing below 21d EMA and 50d MA lines. Tesla ( TSLA +0.17%) announced an earnings beat after market close and is up over 3% in after hours trading. Recent growth favorites Peloton (PTON -5.78%), Fiverr ( FVRR -9.30%) and Datadog ( DDOG -5.91%) are all losing recent gains.
The trend lines provide a few possibilities, but much still depends on news coming from ongoing stimulus discussions. With some positive news, a gain of +3.70% would rejoin the trend line drawn from the 9/23 bottom. If the mega-caps and a breadth of stocks of regain ground, a more likely result would be a +1.39% gain, rejoining the trend from 9/3.
With all but XLC having a challenging Wednesday, the big test for Thursday will be whether the index can hold above the October support and 21d EMA lines. That support looks in jeopardy at this point given the momentum. A downward move looks like it would be around -0.52% loss, possibly dipping below the 21d EMA and then coming back up to as a resistance line. That would continue today’s trend line and the trend drawn from the pivot on 10/12. If investor sentiment were to worsen, the index could go further below the 21d EMA and then hopefully find support at the 50d MA.
-=x=-=x=-=x=-=x=-=x=-=x=-=x=-=x=-=x=-=x=-=x=-=x=-=x=-=x=-=x=-=x=-=x=-=x=-=x=-=x=-=x=-=x=-=x=-=x=-=x=-=x=-=x=-=x=-=x=-=x=-
Thursday, October 22, 2020
Livin’ on a prayer.

Facts: 0.19% higher, Volume lower, Closing range: 76%, Red Body: -12%
Good: Reversed from morning lows to end day positive
Bad: Dipped below 21d EMA
Highs/Lows: Lower high, Lower low
Candle: Looks like a hammer , 12% red body with 76% closing range.
Advance/Decline: 1.76, more advancers than decliners
Sectors: Energy ( XLE ) had a huge 4.13% gain. Financial ( XLF ), Health ( XLV ) and Utilities ( XLU ) also had good days.
Expectation: Sideways or Higher
Finally, there is a bit of character change in the market. After several days of morning gains selling off in afternoon trading, the opposite happened on Thursday. A big morning loss that took the index below the 21d EMA was bought back in the afternoon to end the day with gains. The Nasdaq ended the day with a 0.19% gain. The candle, with a 76% closing range and 12% red body looks like a reversal hammer . That will need to be confirmed with the next few days of trading. Volume was lower (my indicator above is based on QQQ volume ) for the Nasdaq and continues to be lower than average volume in recent weeks. For a true hammer candlestick , we'd want to see higher volume . There were more advancing stocks than declining stocks at a ratio of 1.76. It’s a positive sign that the index regained it’s ground and closed above the 21 day EMA .
The S&P500 had a similar pattern and closed the day with a 0.52% gain, led by Energy ( XLE +4.13%) and Financial ( XLF +1.99%). Most of the sectors saw gains on the day. Technology ( XLK -0.24%) and Real Estate ( XLRE -0.70%) were the worst performing. The Russell 2000 Index had gains of 1.65% as investors looked for good opportunities in small cap stocks.
Google ( GOOG +1.38%) led the mega-cap stocks with it’s second day of solid gains. Apple ( AAPL -0.96%) and Amazon ( AMZN -0.27%) had losses on the day and continue to trade below their 50 day MA. It would be a positive sign for an overall upward trend if these mega-caps got back above this key line. Chevron ( CVX +3.57%) and Exxon Mobil ( XOM +5.13%) along with almost every energy stock saw gains after talk of consolidation in the industry and layoffs at Exxon. Snap (SNAP +6.77%) continued it’s rally after an earnings breakout. Several growth stocks such as Restoration Hardware ( RH +4.34%) and Zoom (ZM +1.43%) had gains after several days of losses. This is all a good sign, but needs to be confirmed with additional gains from more growth stocks.
If the candlestick hammer is confirmed and we see gains from here, trend lines point to two possibilities. The first is a +1.01% gain in the area between today’s trend line and the trend drawn from the 9/3 correction start. Additional positive news could accelerate gains to reach the trend line draw from the 9/23 bottom. That would mean a +3.42% gain.
If the index cannot hold above the 21d EMA , then the 5 day trend and trend from the 10/12 pivot would point to a -1.50%. This is where the 50d MA line is at and where we’ve seen support from September trading.
-=x=-=x=-=x=-=x=-=x=-=x=-=x=-=x=-=x=-=x=-=x=-=x=-=x=-=x=-=x=-=x=-=x=-=x=-=x=-=x=-=x=-=x=-=x=-=x=-=x=-=x=-=x=-=x=-=x=-=x=-
Friday, October 23, 2020
We were runnin' against the wind
Facts: 0.37% higher, Volume lower, Closing range: 100%, Green Body: +11%
Good: Held above key support at 21d EMA
Bad: Low volume , not much price movement
Highs/Lows: Higher high (by a fraction), higher low
Candle: Long lower wick as investors bought up the lows to end nearly where the day started.
Advance/Decline: 1.63, more advancers than decliners
Sectors: Communication Services ( XLC ) led the day with +0.94% gain. Consumer Discretionary ( XLY ) also had a good day at +0.88%.
Expectation: Higher
One more day of reversals to close a choppy week. Every day this week had a morning move that reversed once or more by close. Earlier in the week it was higher highs that reversed to lower lows. At the end of the week, it was lows that reversed to close with gains. Today the Nasdaq ended with a +0.37% gain. The candle has a tiny 11% green body and 100% closing range as the day ended at its high, but not much above where it started. There were more advancing stocks than declining stocks at a ratio of 1.63. Volume was lower than the previous day and much lower than average volume over the past few weeks. The index tested the 21d EMA again and stayed above it.
The S&P500 had an even tighter range between open and close and ended with a similar +0.34% gain. Communication Services ( XLC +0.94%) had the best gains among sectors fueled by positive gains from social platforms. Consumer Discretionary ( XLY +0.88%) also did well today, with a mix of discount retailers, auto parts and restaurant/service companies doing well. Technology ( XLK -0.11%) and Energy ( XLE -0.49%) were the worst performing of the day. The Russell 2000 capped off a winning week with another +0.88% gain.
Google ( GOOG +1.59%) continued the momentum it has gained the last few weeks while Microsoft ( MSFT +0.62%) and Amazon ( AMZN +0.88%) finally found some support with significant gains. Apple ( AAPL -0.61%) and Amazon remain under their 21d EMA and 50d MA lines. The story of the week has been Snap (SNAP +10.78%) which continues to have incredible gains after it’s earnings release. More growth stocks have turned back toward gains which is a positive sign for continued gains next week.
Continuing today’s trend into Monday would mean around a +0.66% gain, splitting the difference between the 1d trend line and the trend drawn from the 9/3 correction. The trend from the 9/24 bottom is +2.67% from today’s close and is a possibility if good news comes over the weekend to fuel gains.
As the index continues to test the 21d EMA , it’s possible it can find itself below that line. That would continue this past week’s trend to a -1.29% loss and land under the October Support area . Further losses would find the 50d MA and the index would likely get support at that level.
-=x=-=x=-=x=-=x=-=x=-=x=-=x=-=x=-=x=-=x=-=x=-=x=-=x=-=x=-=x=-=x=-=x=-=x=-=x=-=x=-=x=-=x=-=x=-=x=-=x=-=x=-=x=-=x=-=x=-=x=-
Larger View on the Week
This was not an easy week to be trading in the stock market. It started with a huge disappointment on Monday where the market started with gains and then quickly lost them for a 1.65% loss. And the rest of the week traded in the lower half of Monday's range, testing October support area and dipping below the 21d EMA once. the closing range on the week is 44%, not terrible but also not great. There were some good signs. Despite the dip below the 21d EMA, the index recovered and otherwise traded above that key support line. The character of Monday to Wednesday of higher opens and lower closes changed on Thursday and Friday with lows turning into intraday highs and closing at the upper range of the day's candles. The closing range on Friday was 100% as the market was on an uptrend heading into the weekend. That's good support at the current price range to build a base going into next week.
US Treasury Yield spreads were up for the week and continue to be on an upward trend since dipping in mid-July. This is a good sign from investors that they staying out of the bond market and in the stock market.
Looking at the mega-caps, Microsoft (MSFT), Apple (AAPL) and Amazon (AMZN) were down on the week with -1.56%, -3.34% and -2.09% losses respectively. Google (GOOG) and Facebook (FB) had great weeks, with +4.32% and +7.09% gains and driving huge gains in the Communication Services sector, specifically social platform stocks. Pinterest (PINS) had a 20% gain. There was the amazing Snap (SNAP) earnings release and 50% gain of that stock. Twitter (TWTR) was up 10%. Beyond those, there were a lot of mixed results. Many of the growth stocks had a tough week although turned in positive gains on Friday. On a daily average, there were more advancers than decliners, but the value of the declines were bigger.

Clearly Communication Services (XLC) was the winning sector of the week, but there was also some back and forth in that race. Consumer Discretionary (XLY) came into the week as the leader, with early gains that faded later in the week. Energy (XLE) had a huge day on Thursday with +4.13% gains that put it at the top of the sectors for a day before giving up the lead to Communication Services on Friday. Financials (XLF) had a good week and Utilities (XLU) continues to turn in consistent performance as a safe bet for conservative investors. It's not often that Technology (XLK) finds itself at the bottom of the sector list, and that is really where to story begins for next week.
-=x=-=x=-=x=-=x=-=x=-=x=-=x=-=x=-=x=-=x=-=x=-=x=-=x=-=x=-=x=-=x=-=x=-=x=-=x=-=x=-=x=-=x=-=x=-=x=-=x=-=x=-=x=-=x=-=x=-=x=-
The Week Ahead
The next week will be a pivotal one for where the market goes next. The questions for the indexes will be whether they can continue the character change from Thursday and Friday and turn that into gains early in the week. They are still testing key support areas and the 21d EMA, often used by investors as an indicator of market health.
Economic news will include New Home Sales, Consumer Confidence and Q3 GDP and are all expected to increase. Positive news in these economic indicators could give the market a boost.
However, probably more attention will be paid to big earnings releases happening next week. There is a huge number of earnings reports scheduled, with a high concentration of technology stocks. Given the technology sector just had an awful week and still influences the broader stock market heavily, the positive and negative earnings reports could have a huge impact. Microsoft (MSFT) will announce on Tuesday, 10/27 and Apple will announce on Thursday 10/29. Shopify (SHOP) which has had a huge growth year, also reports on Thursday.
Of course, you can't discount the influence of the election and the continuing worldwide pandemic. The election seems to already be priced in, but uncertainty around the results and how the candidates will react in either direction is making everyone nervous. The pandemic is accelerating with new highs in daily case counts and people are watching closely what that does to hospital bed availability and death rates worldwide.
-=x=-=x=-=x=-=x=-=x=-=x=-=x=-=x=-=x=-=x=-=x=-=x=-=x=-=x=-=x=-=x=-=x=-=x=-=x=-=x=-=x=-=x=-=x=-=x=-=x=-=x=-=x=-=x=-=x=-=x=-
Key Nasdaq Levels to Watch
There are several key levels in the Nasdaq to keep an eye out for and respond accordingly. First on the positive side:
- 11,642.87 is the current 10d Moving Average. Getting above this line would be a good sign that the turning character from the end of the week is continuing to build momentum.
- Next would be to make it above the high of 10/12 at 11,965.54 which was the downside pivot day from October gains.
- Passing 12074.06 would be a new all time high and a clear sign that the bull market is intact and the short September correction is over.
On the downside, there are several key levels to raise red flags, many similar to what we watched for last week:
- 11,400 is the October support/resistance area. The index dipped below this line briefly on Thursday. This is where the 21d EMA is at now.
- 11,369.29 is last weeks low. Let's hope we do not find a new low this week.
- Things would get more serious if we went below the 11,300 September support area . A lot of time was spent at this level going back and forth before finally breaking back above. This is where the 50d MA is at now.
- The next area to watch would be the July support area at 10,600. If we were to see a significant pullback this week, then the hope is we'd at least stop at this level. If we break through here, there is danger of a much more damaging decline.
- Beyond the July area, there is not much to hold back the index from dropping to the June support area of 10,000. There were only 2-3 days in early July that we were trading between these two levels. At the 10,000 level, there would be a lot of support from the round number psychology as well as the 200d MA.
-=x=-=x=-=x=-=x=-=x=-=x=-=x=-=x=-=x=-=x=-=x=-=x=-=x=-=x=-=x=-=x=-=x=-=x=-=x=-=x=-=x=-=x=-=x=-=x=-=x=-=x=-=x=-=x=-=x=-=x=-
Wrap-up
Next week will certainly be an intense one to watch. Will we have huge gains from positive economic news and earnings reports? Or will the news disappoint and we have big losses? Or maybe, nothing. Maybe more sideways because investors just want to wait and see on the election and coronavirus news.
Either way, it's important to have a plan. Watch for the key levels in the market, and weigh your exposure against the level of risk you see. Making smaller bets and adding after things go you way is a good approach. Raising cash and waiting it out is also a valid strategy for uncertain weeks.
Good luck and trade safe!