This is a chart we first posted almost 4 months ago (August 14, see chart below) at the time of a CPI date release, where we viewed the S&P500 index (SPX) against Inflation (red trend-line) and calling for an immediate buy:

** The 1W MA50 as the ultimate Support **
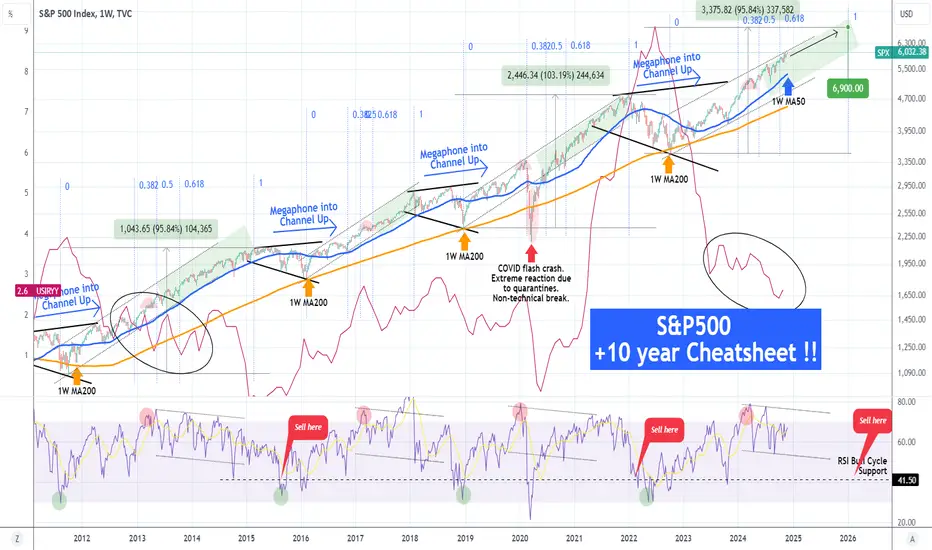
Well the price jumped +11% since then from 5440 to over 6000. The first principle of this chart is that as long as the 1W MA50 (blue trend-line) is supporting, investors should stay bullish. This is because all previous multi-year rallies since August 2011 that started within a Channel Up, ended upon a 1W candle close below the 1W MA50 and transitioned into a Megaphone pattern for the new Bear Phase.
** Declining Inflation fueling stocks **
Right now we are still on a declining Inflation trend, very similar to early 2014 (ellipse shape on Inflation), while the 1W RSI of SPX is declining inside a Channel Down. This is a Bearish Divergence, which during all previous SPX Channel Up patterns, didn't make the index top until the RSI broke below its 41.50 Support (notable exception of course the March 2020 COVID flash crash which was a one in 100 years Black Swan event).
** SPX Target and timing **
As a result, while the 1W RSI trades within its Channel Down and above 41.50 and all price candles close above the 1W MA50, we expect the index to extend the multi-year uptrend to 6900, which would represent a +95.84% rise from the October 2022 bottom, similar to the February 2015 High. Notice that the December 2021 top was also of a similar magnitude (+103%).
As far as timing is concerned, we have calculated a model based on the 1W RSI top and the start of its Channel Down. As you see at that point, SPX always makes a medium-term pull-back (red Arc). This tends to be within the 0.382 - 0.618 time Fibonacci levels and on the 2011 - 2014 Bull Cycle, that was within the 0.382 - 0.5 Fib zone. As a result, applying this principle on the current Bull Cycle, the trend is now just 2 months past the 0.618 time Fib and we can expect a Cycle Top around December 2025.
-------------------------------------------------------------------------------
** Please LIKE 👍, FOLLOW ✅, SHARE 🙌 and COMMENT ✍ if you enjoy this idea! Also share your ideas and charts in the comments section below! This is best way to keep it relevant, support us, keep the content here free and allow the idea to reach as many people as possible. **
-------------------------------------------------------------------------------
💸💸💸💸💸💸
👇 👇 👇 👇 👇 👇
** The 1W MA50 as the ultimate Support **
Well the price jumped +11% since then from 5440 to over 6000. The first principle of this chart is that as long as the 1W MA50 (blue trend-line) is supporting, investors should stay bullish. This is because all previous multi-year rallies since August 2011 that started within a Channel Up, ended upon a 1W candle close below the 1W MA50 and transitioned into a Megaphone pattern for the new Bear Phase.
** Declining Inflation fueling stocks **
Right now we are still on a declining Inflation trend, very similar to early 2014 (ellipse shape on Inflation), while the 1W RSI of SPX is declining inside a Channel Down. This is a Bearish Divergence, which during all previous SPX Channel Up patterns, didn't make the index top until the RSI broke below its 41.50 Support (notable exception of course the March 2020 COVID flash crash which was a one in 100 years Black Swan event).
** SPX Target and timing **
As a result, while the 1W RSI trades within its Channel Down and above 41.50 and all price candles close above the 1W MA50, we expect the index to extend the multi-year uptrend to 6900, which would represent a +95.84% rise from the October 2022 bottom, similar to the February 2015 High. Notice that the December 2021 top was also of a similar magnitude (+103%).
As far as timing is concerned, we have calculated a model based on the 1W RSI top and the start of its Channel Down. As you see at that point, SPX always makes a medium-term pull-back (red Arc). This tends to be within the 0.382 - 0.618 time Fibonacci levels and on the 2011 - 2014 Bull Cycle, that was within the 0.382 - 0.5 Fib zone. As a result, applying this principle on the current Bull Cycle, the trend is now just 2 months past the 0.618 time Fib and we can expect a Cycle Top around December 2025.
-------------------------------------------------------------------------------
** Please LIKE 👍, FOLLOW ✅, SHARE 🙌 and COMMENT ✍ if you enjoy this idea! Also share your ideas and charts in the comments section below! This is best way to keep it relevant, support us, keep the content here free and allow the idea to reach as many people as possible. **
-------------------------------------------------------------------------------
💸💸💸💸💸💸
👇 👇 👇 👇 👇 👇
👑Best Signals (Forex/Crypto+70% accuracy) & Account Management (+20% profit/month on 10k accounts)
💰Free Channel t.me/tradingshotglobal
🤵Contact info@tradingshot.com t.me/tradingshot
🔥New service: next X100 crypto GEMS!
💰Free Channel t.me/tradingshotglobal
🤵Contact info@tradingshot.com t.me/tradingshot
🔥New service: next X100 crypto GEMS!
Disclaimer
The information and publications are not meant to be, and do not constitute, financial, investment, trading, or other types of advice or recommendations supplied or endorsed by TradingView. Read more in the Terms of Use.