Here is my weekly outlook on  UEC .
UEC .
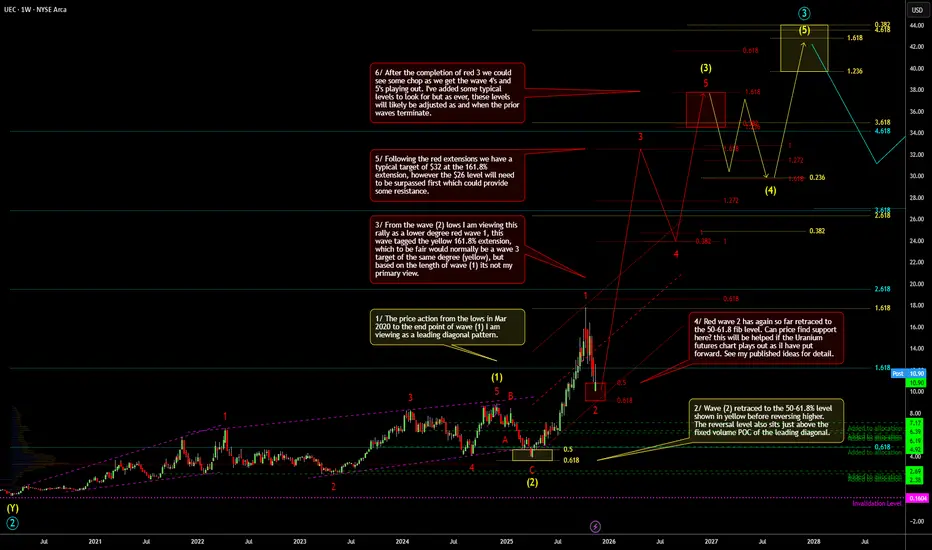
UEC is one of my bigger holdings, I've added at various times as shown on the chart (see green dashed lines).
In this outlook i am viewing the price action from the lows in Mar 2020 to the end point of wave (1) as a leading diagonal pattern. After that we have seen wave (2) and another wave 1 and 2 in the red degree (red wave 2 may not be complete yet).
Are we next going to see a breakout in red wave 3? the case for this will be helped if the UX2! Uranium Futures chart plays out as predicted along with
  YCA &
YCA &  U.UN ...see my linked charts
More comments on the chart!
Note: My analysis is more focused on price levels as opposed to wave duration, so bear that in mind if you see a particular price level at a certain date in the future and think i'm rigid on both price and time.
UEC is one of my bigger holdings, I've added at various times as shown on the chart (see green dashed lines).
In this outlook i am viewing the price action from the lows in Mar 2020 to the end point of wave (1) as a leading diagonal pattern. After that we have seen wave (2) and another wave 1 and 2 in the red degree (red wave 2 may not be complete yet).
Are we next going to see a breakout in red wave 3? the case for this will be helped if the
More comments on the chart!
Note: My analysis is more focused on price levels as opposed to wave duration, so bear that in mind if you see a particular price level at a certain date in the future and think i'm rigid on both price and time.
Related publications
Disclaimer
The information and publications are not meant to be, and do not constitute, financial, investment, trading, or other types of advice or recommendations supplied or endorsed by TradingView. Read more in the Terms of Use.
Related publications
Disclaimer
The information and publications are not meant to be, and do not constitute, financial, investment, trading, or other types of advice or recommendations supplied or endorsed by TradingView. Read more in the Terms of Use.