−0.0062USD
−7.07 MUSD
398.29 M
About Xeriant, Inc.
Sector
Industry
CEO
Keith F. Duffy
Website
Headquarters
Boca Raton
Founded
2009
FIGI
BBG001HWZ1X1
Xeriant, Inc. is an aircraft design and development company, which engages in the acquisition, development, and proliferation of next generation hybrid-electric and fully electric aircraft with vertical takeoff and landing capabilities, performance enhancing aerospace technologies and advanced materials, as well as critical support infrastructure. The company was founded by Brendan Macpherson and Belynda Storelli Macpherson on December 18, 2009 and is headquartered in Boca Raton, FL.
Trade directly on the supercharts through our supported, fully-verified and user-reviewed brokers.


Frequently Asked Questions
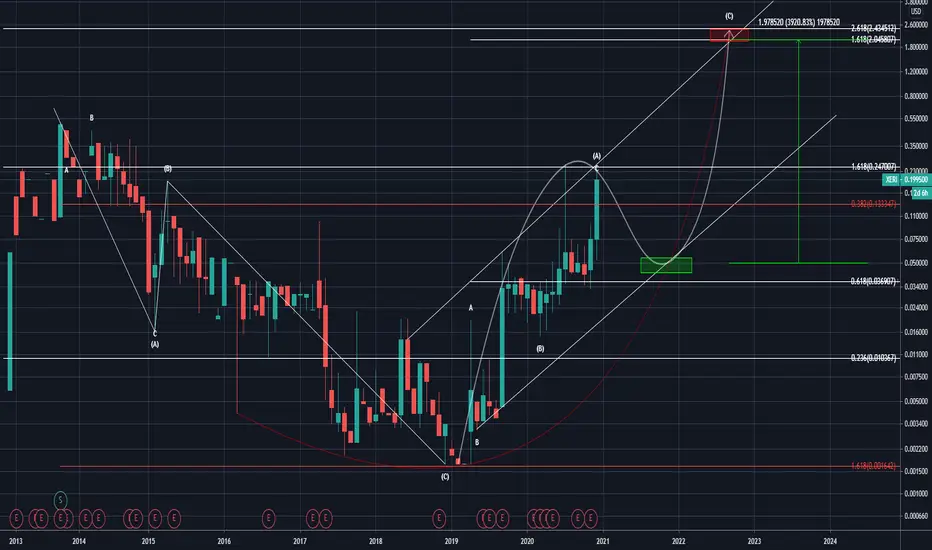
The current price of XERI is 0.0200 USD — it has increased by 0.76% in the past 24 hours. Watch Xeriant, Inc. stock price performance more closely on the chart.
Depending on the exchange, the stock ticker may vary. For instance, on OTC exchange Xeriant, Inc. stocks are traded under the ticker XERI.
XERI stock is 1.01% volatile and has beta coefficient of 0.76. Track Xeriant, Inc. stock price on the chart and check out the list of the most volatile stocks — is Xeriant, Inc. there?
Yes, you can track Xeriant, Inc. financials in yearly and quarterly reports right on TradingView.
XERI stock has fallen by 5.00% compared to the previous week, the month change is a 5.00% rise, over the last year Xeriant, Inc. has showed a 21.46% decrease.
XERI net income for the last quarter is −1.20 M USD, while the quarter before that showed −334.09 K USD of net income which accounts for −258.94% change. Track more Xeriant, Inc. financial stats to get the full picture.
Today Xeriant, Inc. has the market capitalization of 8.88 M, it has decreased by 1.66% over the last week.
No, XERI doesn't pay any dividends to its shareholders. But don't worry, we've prepared a list of high-dividend stocks for you.
Like other stocks, XERI shares are traded on stock exchanges, e.g. Nasdaq, Nyse, Euronext, and the easiest way to buy them is through an online stock broker. To do this, you need to open an account and follow a broker's procedures, then start trading. You can trade Xeriant, Inc. stock right from TradingView charts — choose your broker and connect to your account.
XERI reached its all-time high on Feb 8, 2021 with the price of 0.5800 USD, and its all-time low was 0.0017 USD and was reached on Dec 24, 2018. View more price dynamics on XERI chart.
See other stocks reaching their highest and lowest prices.
See other stocks reaching their highest and lowest prices.
Investing in stocks requires a comprehensive research: you should carefully study all the available data, e.g. company's financials, related news, and its technical analysis. So Xeriant, Inc. technincal analysis shows the neutral today, and its 1 week rating is neutral. Since market conditions are prone to changes, it's worth looking a bit further into the future — according to the 1 month rating Xeriant, Inc. stock shows the sell signal. See more of Xeriant, Inc. technicals for a more comprehensive analysis.
If you're still not sure, try looking for inspiration in our curated watchlists.
If you're still not sure, try looking for inspiration in our curated watchlists.