Chart Patterns ranked by reliability (1-8)Chart Patterns as a Strategy (Not a System)
In the world of technical analysis, chart patterns are often marketed as stand-alone trading systems. In reality, their real edge comes from probabilistic structure recognition, not prediction.
The key insight from my large-sample testing (10 years, 200,000+ patterns (Futures, FX)) is this:
Patterns don’t predict direction — they quantify structural bias once price has already revealed intent.
That distinction is what separates profitable traders from pattern collectors.
How These Patterns Were Tested (Why the Stats Matter)
All patterns discussed below were:
Only counted once fully completed
Required confirmed breaks of structure (trendline, neckline, or support/resistance)
Measured using objective projection rules, not discretionary targets
TP Rule: Full Head and Shoulder Height, using the Head distance and the right shoulder as the SL.
Full Height of triangles, and a full height for flags as well.
Twice the height of the Channel as TP, and Time TP for Channels, for half of the duration of the it.
Rectangles were Full Box Width as TP, and a time-based TP of 1/4 the Length.
It could be trailed further, but some such as Rectangle TP made great mean-reversion trade.
This removes hindsight bias — a major flaw in most pattern discussions.
Continuation Patterns (Trend Context Is Mandatory).
#8. Bull & Bear Flags (~67%) (Alt. Name: Cups, Volatility Contraction Pattern)
Occur after near-vertical impulse moves, typically the 50 EMA can filter the direction.
Represent temporary pauses, not reversals.
Best when:
Flag is tight
Forms near the extreme of the impulse
Volume contracts during consolidation
Professional takeaway:
Flags are trend health checks, not entries. If a flag fails, momentum is likely exhausted.
#7. Ascending & Descending Triangles (~73%)
Market compresses against a hard level
One side shows aggression, the other absorption
Breakout confirms institutional imbalance
Use them to answer:
“Is price being accumulated or distributed?”
#6. Ascending & Descending Channels (~73%) (Alt. Name: Cups & Handle)
Wide consolidations between parallel trendlines
Stronger than flags due to time + participation
Breakouts often lead to measured trend continuation
Key insight:
Channels are delayed continuation, not indecision.
Reversal Patterns (Confirmation Is Everything)
The Joker: Double Tops & Bottoms (75–79%)
Require structural failure
Completion only occurs after neckline break
Bottoms outperform tops statistically (markets rise faster than they fall)
⚠️ Common mistake:
Anticipating the second top/bottom instead of waiting for confirmation.
The Queen: Triple Tops & Bottoms (77–79%)
Stronger due to repeated rejection
Represent exhaustion of dominant participants
Interpretation:
The market tried three times — and failed.
The King: Rectangle Patterns (~78–80%)
Flat consolidation after a trend, more than 3 touches top and bottom.
Essentially failed reversal attempts.
Breakouts often trap traders positioned against the trend, it's best to enter on retest of breakout or earlier at the Bear-Bull Midline of the Box.
Critical lesson:
Most “double tops” fail — and turn into rectangles.
The Ace: Head & Shoulders (~83%)
Why it works so well:
Clear distribution → failure → confirmation
Captures institutional exit mechanics
Neckline break aligns with order-flow imbalance
Both regular and inverted versions are the most reliable classical patterns when properly confirmed.
⚠️ Common mistake: It's easy to mistake a Head and Shoulders with another pattern like a Double or Triple Bottom if it's neckline is not broken well.
The Trap Pattern: Pennants (~55%)
Despite being taught alongside flags:
Pennants break against trend too often
Over-compression increases randomness
Lack clear structural dominance, Pivot HL are spots where trader's should sell.
Professional rule:
If it looks too tight, it’s probably a coin flip.
It's better to target Equal High and Lows to the left as TP.
How Professionals Actually Use Chart Patterns
We don’t trade patterns — we trade what they imply.
Patterns help answer:
Is the market accepting or rejecting price?
Are participants trapped or in control?
Is this continuation, transition, or reversal?
They work best when combined with:
Market structure (HH/HL, LH/LL)
Time-of-day context
Volume or order-flow
Higher-timeframe bias
Final Truth About Pattern Accuracy
Pattern Type Role Best Use
Flags / Channels Continuation Trend validation
Triangles Pressure build Breakout bias
Double / Triple Reversal Failure detection
Rectangles Continuation Trap identification
Head & Shoulders Reversal Distribution confirmation
Pennants ❌ Avoid
Double Bottom

DOUBLE TOP PATTERN – A CLASSIC BEARISH REVERSAL SETUP📚 DOUBLE TOP PATTERN – A CLASSIC BEARISH REVERSAL SETUP
The Double Top is one of the most reliable bearish reversal patterns, commonly appearing after a strong uptrend. Understanding its structure and confirmation rules helps traders avoid false signals and improve trade accuracy.
🔍 Structure of the Double Top
The pattern consists of three key phases:
1️⃣ First Top
Price rallies strongly and forms the first peak, showing strong bullish momentum.
Afterward, price pulls back, creating a temporary low — this level later becomes the neckline.
2️⃣ Second Top
Price attempts another push upward but fails to break above the first top.
This failure signals weakening buying pressure and early distribution by smart money.
3️⃣ Neckline Breakdown
The pattern is confirmed only when price breaks below the neckline.
This breakdown marks the shift from bullish control to bearish dominance.
👉 Important:
Without a neckline break, a Double Top is NOT valid.
📉 Market Meaning Behind the Pattern
- Bullish momentum weakens after the second top
- Buyers lose control, sellers gradually step in
- A neckline break confirms trend reversal
- When formed after a clear uptrend, Double Top is considered a high-probability reversal pattern
✅ Conditions for a High-Quality Double Top
For better reliability, the following conditions should be met:
✔️ A clear prior uptrend
✔️ Both tops are approximately equal in height
✔️ Volume is higher on the first top and lower on the second
✔️ Strong bearish candles or volume expansion on the neckline break
🛠️ How to Trade the Double Top
🔴 SELL Entry
The safest approach is to wait for a neckline break, then SELL on the retest of the neckline.
This reduces the risk of false breakdowns and improves risk-to-reward.
❌ Stop Loss (SL)
Place SL above the second top (or above both tops).
The stop must be outside the structure to avoid liquidity sweeps.
🎯 Take Profit (TP)
To estimate the target:
- Measure the distance from the top to the neckline
- Project that distance downward from the neckline break
⚠️ Common Mistakes to Avoid
❌ Selling just because price forms a second top
❌ Ignoring neckline confirmation
❌ Trading without volume or candle confirmation
❌ Not combining with other tools
📌 Pro Tip for Higher Accuracy
Combine the Double Top with:
- RSI divergence
- Fair Value Gaps (FVG)
- Trendlines
- Liquidity zones
This multi-confirmation approach significantly increases trade probability.

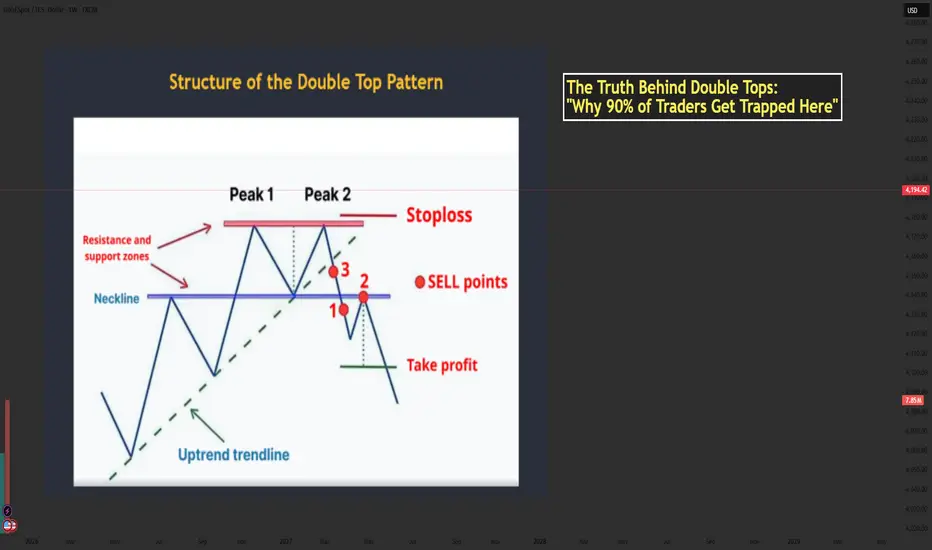
The Truth Behind Double Tops: Why 90% of Traders Get Trapped...📘 Mastering the Double Top Pattern — Structure, Psychology & How Smart Money Uses It
- The Double Top is one of the most powerful reversal patterns in technical analysis. When used correctly, it helps traders catch the transition from bullish momentum → bearish reversal with high accuracy.
- Let’s break down the structure using the chart you provided and enhance it with professional-level insights.
🔶 1. Structure of the Double Top
1️⃣ The First Top
- Price pushes upward strongly during an uptrend.
- Buyers are in full control and create the first peak.
- After reaching resistance, price pulls back → forming the neckline.
This pullback is normal and represents the market taking profits.
2️⃣ The Second Top
- Price rallies again but fails to break above Peak 1.
- This failure is extremely important — it shows bulls are losing strength.
- The second top traps late buyers who expect a breakout.
3️⃣ The Neckline Break
- Once price breaks below the neckline, the structure is officially confirmed.
- This represents sellers overwhelming buyers.
- A break of structure → shift in market control.
📌 Professional traders only consider the pattern valid AFTER the neckline break.
🔶 2. Market Psychology Behind the Double Top
Understanding the pattern’s psychology is what separates beginners from professional traders.
1️⃣ At Peak 1
Bulls believe the trend will continue.
Retail traders buy aggressively.
2️⃣ Pullback to Neckline
A healthy correction occurs; no one expects a reversal yet.
3️⃣ At Peak 2
This is where emotions start to shift:
- Retail buyers expect a breakout.
- Smart Money uses this area as a liquidity zone to trigger buy stops.
- Institutions often sell into this liquidity, creating the foundation for reversal.
4️⃣ Neckline Break
Panic begins:
Buyers trapped at Peak 2 start closing positions.
Sellers enter aggressively.
Momentum shifts — the trend has reversed.
5️⃣ Retest
The retest is a psychological trap:
- Trapped buyers hope for “one more push up.”
- Sellers add positions at better prices.
- When price rejects the neckline → the downtrend accelerates.
💡 This is why the retest is the safest sell entry.
🔶 3. Conditions for a High-Quality Double Top
To avoid fake patterns, check these criteria:
✔️ Must appear after a clear uptrend
✔️ Both tops should be similar in height
✔️ Volume should decrease on the second top
✔️ Neckline breakout must be decisive and clean
✔️ Better if second peak creates a stop-hunt wicking above Peak 1
✔️ Even more powerful when aligned with:
- HTF resistance
- Institutional zones
- Liquidity sweeps
- Overbought RSI
- Divergence
🔶 4. How to Trade the Double Top
1️⃣ Entry (Sell Zone)
Best Entry:
👉 SELL on the neckline retest after the breakout.
This gives:
- Best accuracy
- Best risk–reward
- Confirmation that the market has shifted bearish
2️⃣ Stop Loss Placement
Place SL:
- Above Peak 2
- Or above Peak 1 (more conservative)
🛑 SL must sit outside the structure to avoid fake moves.
3️⃣ Take Profit Target
The classic measurement:
- Distance from Peak → Neckline
- Projected downward
This gives the first TP.
TP2 can be placed at:
Next support zone
- Fib 1.618 extension
- HTF demand area
🔶 5. Real Market Example
Your image shows:
- Two clear peaks forming under a resistance zone
- Neckline support holding price
- A strong break below the neckline
- Sell entries at the ideal points:
+ Point 1 → aggressive breakout trader
+ Point 2 → safest retest entry
+ Point 3 → early anticipation entry (riskier)
The downward projection after the pattern aligns perfectly with the expected target zone.
🔶 6. Trader Psychology: Why People Lose with Double Tops
Most traders get trapped because they:
❌ Sell too early (before neckline break)
❌ Expect the second top to drop immediately
❌ Ignore volume or candle strength
❌ Enter without waiting for retest
❌ Fear missing out and chase price after the big drop
Smart Money uses these emotions:
- Greed → traps buyers at Peak 2
- Fear → forces panic selling at neckline break
- FOMO → attracts late sellers at the worst price
Your job is to stay patient and enter only at the retest, where probability is highest.
🔶 7. Professional Tips to Master the Double Top
✔️ Wait for structure confirmation → neckline break
✔️ Don’t sell inside the range between the two peaks
✔️ Use RSI divergence to strengthen accuracy
✔️ Look for stop-hunt wicks above Peak 2
✔️ Combine with trendline breaks for timing
✔️ Use a top-down approach (H4 + H1 → M15 entry)
✨ Final Message for Traders
The Double Top is not just a pattern it is a reflection of fear, greed, and trapped liquidity.
Master the psychology behind it, and it becomes one of your most reliable reversal tools.
If this helped your trading, drop a comment and share your thoughts!
Let’s grow together. ❤️📈
The Pattern That Looked Bullish… Until It Didn’t1. The “Too Good to Be True” Setup
You’ve seen it a hundred times — that shiny W-shaped pattern that screams reversal.
Traders spot it, celebrate it, and rush in before it even completes.
But not every double bottom deserves a standing ovation. Sometimes, what looks like a powerful comeback is actually the calm before another dip.
2. Meet the Real Players: FO vs. UFO
Behind every pattern hides a tug-of-war between two invisible forces:
FO (Filled Orders): Where buyers already did their job. The gas tank’s empty.
UFO (UnFilled Orders): Where fresh buyers are still waiting. That’s where the real fuel sits.
In our current setup, price bounced from an FO zone that already spent its energy.
The next UFO zone — the untouched demand — sits lower.
Translation? The market might need one more leg down to refuel before any real rally begins.
3. The Bear Hiding Inside the Bull
Chart shapes can lie.
Order flow doesn’t tend to.
When price sits on an FO support and the next UFO level is far below, odds tilt toward a break, not a bounce.
It’s like jumping on a trampoline that’s already been stretched too far — it might not spring you up again this time.
4. Rethink “Confirmation”
Pattern traders often buy the moment they spot symmetry. Smart traders wait for liquidity confirmation — the moment unfilled demand actually engages.
If that doesn’t happen, all you’ve got is a good-looking shape on a tired level.
5. The Real Lesson
Patterns attract attention.
Order flow reveals intent.
Patience separates analysis from impulse.
The next time a chart whispers “reversal,” ask yourself: Is it running on new energy or recycled hope?
Want More Depth?
If you’d like to go deeper into the building blocks of trading, check out our From Mystery to Mastery trilogy, three cornerstone articles that complement this one:
🔗 From Mystery to Mastery: Trading Essentials
🔗 From Mystery to Mastery: Futures Explained
🔗 From Mystery to Mastery: Options Explained
When charting futures, the data provided could be delayed. Traders working with the ticker symbols discussed in this idea may prefer to use CME Group real-time data plan on TradingView: www.tradingview.com - This consideration is particularly important for shorter-term traders, whereas it may be less critical for those focused on longer-term trading strategies.
General Disclaimer:
The trade ideas presented herein are solely for illustrative purposes forming a part of a case study intended to demonstrate key principles in risk management within the context of the specific market scenarios discussed. These ideas are not to be interpreted as investment recommendations or financial advice. They do not endorse or promote any specific trading strategies, financial products, or services. The information provided is based on data believed to be reliable; however, its accuracy or completeness cannot be guaranteed. Trading in financial markets involves risks, including the potential loss of principal. Each individual should conduct their own research and consult with professional financial advisors before making any investment decisions. The author or publisher of this content bears no responsibility for any actions taken based on the information provided or for any resultant financial or other losses.
The Double Bottom Trap That Traders Might Miss1. The Comfort Zone of Classic Patterns
Few formations attract traders’ attention like a double bottom. It’s one of those timeless chart patterns that promise hope after a long decline—a visual story of selling exhaustion followed by a bullish reversal.
But markets rarely reward what’s obvious. In futures trading, especially when examining instruments like Bitcoin Futures (BTC) and Micro Bitcoin Futures (MBT), patterns are only half the story. What truly moves price isn’t just the shape on the chart—it’s the order flow behind it.
That’s where understanding FO (Filled Orders) and UFO (UnFilled Orders) becomes essential. Both represent past and potential liquidity imbalances, and reading their relationship can transform how traders interpret “classic” setups.
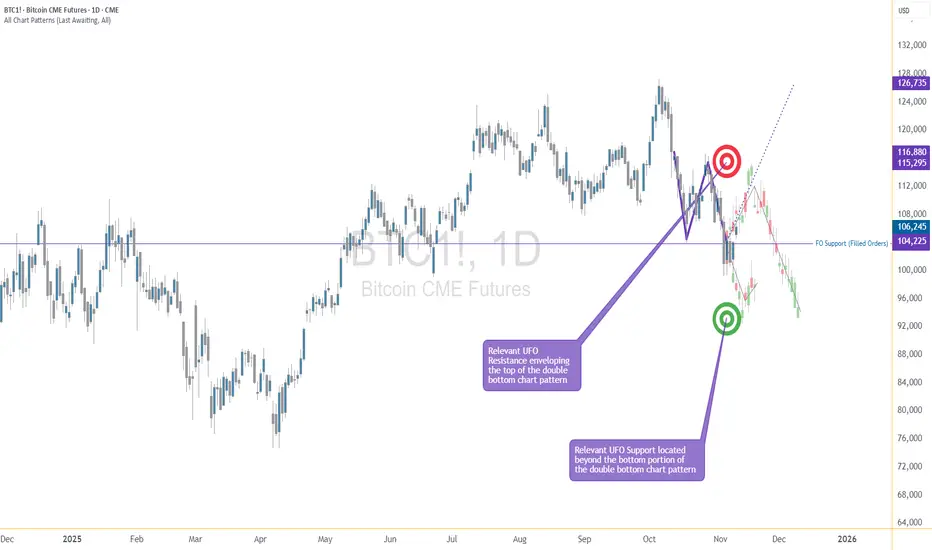
2. The Bitcoin Setup: A Tale of Two Bottoms
The current BTC daily chart paints what seems like a textbook double bottom. Two price troughs form near the same horizontal area around $104,000, setting up the typical “W” shape many traders see as a bullish reversal pattern.
However, when we dig deeper into the order flow structure, the illusion begins to fade.
A FO Support level exists near $103,860, meaning that this area previously attracted enough buyers to halt a decline—but those orders have already been filled and we know this given the fact that price turned at that price level before.
The next UFO Support zone sits much lower, around $95,640. That’s where unfilled buy orders are expected to remain waiting, untouched.
This distinction matters. While FO zones mark previous turning points, UFO zones highlight potential turning points that still contain resting liquidity. In simple terms, FO areas represent “used energy,” while UFO areas represent “stored energy.”
3. FO vs. UFO – The Order Flow Reality Check
Let’s define these two concepts with precision:
FO (Filled Orders): Price zones where significant buying or selling already occurred. These levels once reversed price, but because those orders were executed, fewer remain to defend the level again.
UFO (UnFilled Orders): Price zones containing pending buy or sell orders not yet triggered. They represent areas of fresh imbalance and therefore carry a higher probability of influencing future price moves.
In our Bitcoin case, the FO Support around $103,860 has done its job already—it stopped price before. But now, the unfilled buying interest lies lower, implying that the market may need to travel down to reach fresh demand at $95,640.
On the other side, UFO Resistance hovers near $112,410, enveloping the top of the double bottom structure. Should the price rebound toward that level, sellers waiting there could re-enter the scene, potentially capping any bullish recovery.
The conclusion? This pattern isn’t as bullish as it looks.
4. When Bullish Shapes Hide Bearish Probabilities
Most traders spot the double bottom and immediately think “trend reversal.” Yet, the distance between FO and UFO levels tells a more subtle story.
Since FO Support levels carry reduced strength after being tested, they’re more likely to break than hold. In this context, the probability favors a downside continuation rather than an immediate bounce.
If price breaches $103,860, the next probable destination becomes the UFO Support at $95,640. Only then, after reaching that pocket of unfilled demand, might a significant rebound have higher odds.
It’s a reminder that technical patterns, while valuable, must always be filtered through liquidity context. A pattern without order flow validation is like reading the market’s outline without its story.
5. Quantitative Insight: A Probabilistic Lens
Think of this in probabilistic terms:
When FO zones sit above UFO zones, the market often continues toward the unfilled liquidity.
When UFO zones lie closer to current price, reversals occur faster because demand (or supply) is still waiting to be executed.
In our example, BTC shows a larger gap between FO and UFO support levels, signaling lower immediate reversal odds. The chart may appear bullish, but the underlying order flow distribution points to weakness first, strength later.
This is not a prediction—it’s an observation of potential. It allows traders to structure their expectations based on where fresh participation is more likely to emerge.
6. Risk Management: Navigating the Trap
For traders considering setups around this structure, risk management is crucial.
Entry awareness: Avoid entering long positions purely because a double bottom “looks bullish.” Consider waiting for evidence of unfilled demand being triggered (confirmation at or near UFO Support).
Stop-loss placement: Stops below FO Support can easily be hunted in liquidity sweeps; better to align risk control with genuine unfilled demand areas.
Reward-to-risk thinking: A test of the UFO Support near $95,640 could later offer a more favorable upside-to-downside ratio than buying prematurely at $104,000.
Remember, pattern-based entries without liquidity confirmation often carry poor asymmetry—small upside with large downside risk.
7. Futures Structure and Margin Awareness
Both BTC and MBT represent Bitcoin exposure via futures contracts, but their sizing differs dramatically.
BTC equals 5 Bitcoin per contract, making it suitable for larger, institutional players. (1 Tick = 5 = $25. Required Margin = $132,500)
MBT, the Micro Bitcoin Futures, equals 0.1 Bitcoin per contract, offering flexibility for smaller accounts and finer position scaling. (1 Tick = 5 = $0.50. Required Margin = $2,600)
Understanding margin requirements is essential—these products are leveraged instruments, and small price changes can result in large percentage gains or losses.
8. Key Takeaway: The Hidden Lesson
This entire setup illustrates a powerful educational point:
Chart patterns may draw the eye, but order flow tells the truth.
The double bottom may invite buyers, but the imbalance between FO and UFO zones exposes an underlying weakness. Traders who rely solely on visual patterns may walk straight into a trap. Those who align patterns with liquidity insights, however, read the market at a deeper level.
In the current context, BTC and MBT might need to visit lower support levels before finding true stability. Watching how price behaves around these unfilled order zones will reveal whether this double bottom turns into a lasting floor—or just another false start.
When charting futures, the data provided could be delayed. Traders working with the ticker symbols discussed in this idea may prefer to use CME Group real-time data plan on TradingView: www.tradingview.com - This consideration is particularly important for shorter-term traders, whereas it may be less critical for those focused on longer-term trading strategies.
General Disclaimer:
The trade ideas presented herein are solely for illustrative purposes forming a part of a case study intended to demonstrate key principles in risk management within the context of the specific market scenarios discussed. These ideas are not to be interpreted as investment recommendations or financial advice. They do not endorse or promote any specific trading strategies, financial products, or services. The information provided is based on data believed to be reliable; however, its accuracy or completeness cannot be guaranteed. Trading in financial markets involves risks, including the potential loss of principal. Each individual should conduct their own research and consult with professional financial advisors before making any investment decisions. The author or publisher of this content bears no responsibility for any actions taken based on the information provided or for any resultant financial or other losses.

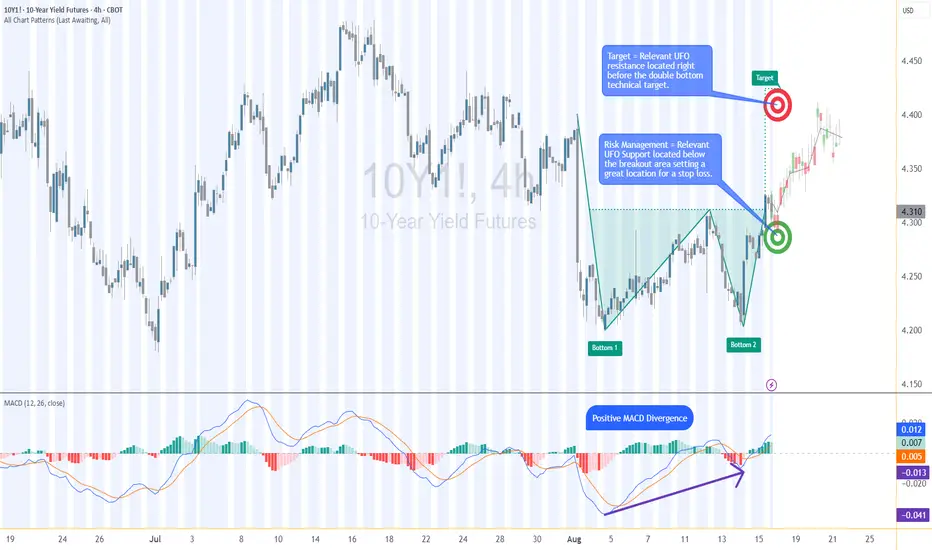
10Y Futures Case Study: Trading the Breakout with Defined Risk1. Introduction
The 10-Year Yield Futures market has recently drawn attention as it builds a constructive base and attempts to shift momentum higher. After weeks of choppy movement, price action on the 4-hour chart has resolved into a breakout scenario that could define the next leg for yields. At the heart of this case study is a double bottom formation, a classical reversal structure, confirmed at 4.321. What makes this setup more compelling is the presence of nearby support and resistance zones, providing a precise technical framework to define entries, targets, and stop placement with discipline.
2. Double Bottom Pattern
The double bottom is one of the most reliable chart patterns signaling the potential exhaustion of selling pressure. It typically forms after a downtrend, with two consecutive troughs creating a strong support base before buyers regain control. In the current 10-Year Yield Futures chart, the first bottom occurred near 4.20, followed by a retest close to the same level. The neckline breakout emerged at 4.312, marking the confirmation point. Applying classical pattern analysis, the measured move points toward a target near 4.396. This alignment of structure and projection provides traders with a clear and objective technical roadmap.
3. MACD Confirmation
Momentum indicators often add depth to price action analysis, and the MACD (Moving Average Convergence Divergence) is one of the most widely followed. Built from the relationship of short- and long-term moving averages, it helps reveal underlying shifts in strength. In the current 10-Year Yield Futures chart, the MACD displayed a positive divergence: while price carved lower lows during the second bottom, the MACD lines began to slope higher. This divergence often signals weakening bearish momentum and the early stages of accumulation. In this case, it reinforces the validity of the double bottom breakout and its bullish potential.
4. UFO Support & Resistance
UnFilled Orders, or UFOs, represent areas where pending buy or sell orders may remain active, providing powerful zones of support or resistance. On the 10-Year Yield Futures chart, a key UFO support sits just below the breakout at 4.278, making it a logical stop-loss placement to protect the trade. Meanwhile, the upside target of the double bottom at 4.396 coincides with a UFO resistance zone. This overlap creates a clear exit area where supply may re-emerge. By combining classical charting techniques with order-flow–based zones, traders gain a structured plan that balances opportunity with risk control.
5. Trade Idea (Illustrative Case Study)
In this case study, the trade idea develops around the breakout point of 4.312 with the current price at the time of writing this article of 4.321. A trader could consider going long if the market sustains above this neckline level. The projected target is the resistance zone at 4.396, while the protective stop loss can be placed just below the UFO support at 4.278. This creates a defined risk profile with a reward-to-risk ratio of roughly 2:1. Alternatively, more conservative traders might consider a wider stop beneath the second bottom, offering more tolerance against volatility but at the expense of risk-reward efficiency. Both options maintain risk clarity and structure.
6. Contract Specifications & Margin Overview
The 10-Year Yield Futures (ticker: 10Y or 10Y1! on TradingView) is a cash-settled futures contract that tracks the 10-year U.S. Treasury yield directly. The gain or loss per tick per contract is as follows: 1 tick = 0.001 Index points (1/10th basis point per annum) = $1.00.
According to CME’s margin schedule (which changes as market conditions change through time), the current margin requirement is approximately $300 per contract. These relatively modest requirements make the product accessible while still providing meaningful exposure to U.S. interest rate markets.
7. Importance of Risk Management
Even with technically strong setups, the defining factor between consistent traders and inconsistent ones is risk management. Futures are leveraged products, meaning a small price move can translate into significant profit or loss. Using stop-loss orders helps enforce discipline, ensuring that one trade does not spiral into uncontrolled exposure. In this case, the support at 4.278 provides a logical technical area for a stop. Regardless of market outlook, avoiding undefined risk is key to long-term survival and consistency.
8. Closing Remarks
The alignment of a double bottom breakout, positive MACD divergence, and key support and resistance zones creates a textbook technical case study in the 10-Year Yield Futures market. With a clearly defined entry, target, and stop-loss, this setup demonstrates how combining price patterns with momentum and order-flow levels can help build structured trade plans. Yet, no analysis guarantees outcomes, and discipline remains at the core of every approach.
When charting futures, the data provided could be delayed. Traders working with the ticker symbols discussed in this idea may prefer to use CME Group real-time data plan on TradingView: www.tradingview.com - This consideration is particularly important for shorter-term traders, whereas it may be less critical for those focused on longer-term trading strategies.
General Disclaimer:
The trade ideas presented herein are solely for illustrative purposes forming a part of a case study intended to demonstrate key principles in risk management within the context of the specific market scenarios discussed. These ideas are not to be interpreted as investment recommendations or financial advice. They do not endorse or promote any specific trading strategies, financial products, or services. The information provided is based on data believed to be reliable; however, its accuracy or completeness cannot be guaranteed. Trading in financial markets involves risks, including the potential loss of principal. Each individual should conduct their own research and consult with professional financial advisors before making any investment decisions. The author or publisher of this content bears no responsibility for any actions taken based on the information provided or for any resultant financial or other losses.
How to Trade Double Tops & Bottoms in TradingViewLearn how to identify, validate, and trade double top and double bottom reversal patterns using TradingView's charting tools in this comprehensive tutorial from Optimus Futures. Understanding these classic chart formations can help you spot potential trend reversals and capitalize on contrarian trading opportunities in the futures markets.
What You'll Learn:
• Understanding contrarian vs. continuation trading strategies and when to use each approach
• The psychology behind buying low and selling high through reversal pattern trading
• How to identify double top and double bottom formations on any timeframe
• Key characteristics of valid double tops and bottoms, including volume confirmation
• Using TradingView's XABCD pattern tool to validate potential double top/bottom setups
• Real-world example analysis using crude oil futures charts
• Risk management techniques for trading reversal patterns
• How to calculate appropriate entry points, stop losses, and profit targets
• Setting up 1:1 risk-reward ratios for mathematical trading edge
• Understanding win rate requirements for profitable pattern trading
• How double bottom patterns work as the inverse of double top formations
This tutorial may benefit futures traders, swing traders, and technical analysts interested in contrarian trading strategies and reversal pattern recognition. The concepts covered could help you identify potential turning points in market trends and develop systematic approaches to trading these classic chart formations.
Visit Optimus Futures to learn more about trading futures with TradingView: optimusfutures.com/Platforms/TradingView.php
Disclaimer:
There is a substantial risk of loss in futures trading. Past performance is not indicative of future results. Please trade only with risk capital. We are not responsible for any third-party links, comments, or content shared on TradingView. Any opinions, links, or messages posted by users on TradingView do not represent our views or recommendations. Please exercise your own judgment and due diligence when engaging with any external content or user commentary.
This video represents the opinion of Optimus Futures and is intended for educational purposes only. Chart interpretations are presented solely to illustrate objective technical concepts and should not be viewed as predictive of future market behavior. In our opinion, charts are analytical tools—not forecasting instruments. Market conditions are constantly evolving, and all trading decisions should be made independently, with careful consideration of individual risk tolerance and financial objectives.

Different Types of W Patterns and How to Trade ThemHello dear KIU_COIN family 🐺 .
Recently, I decided to provide some educational content for you, my dear audience, and introduce some essential and basic trading terms.
Here’s what you should know: In these lessons, we will cover three different seasons:
🔹 Season 1: Reversal and continuation patterns.
🔹 Season 2: How to use RSI and other indicators to find good entry points.
🔹 Season 3: Definitions of Fibonacci and seasonality in trading.
Stay tuned for valuable insights! 🚀
✅ For the first section of 🔹 Season 1 , I’ll be covering W patterns— a well-known bullish reversal pattern :
As you can see in the chart above, we usually have three types of W recovery patterns , which are the most important ones for us. However, in this section, we just want to get a general understanding of them. In the upcoming section, we will learn how to trade them and explore how they actually appear on the chart and the story behind them !
✅ This is the first and most common type of W pattern:
✅ This is the second type of W pattern:
✅ This is the third type of W pattern:
Ok, guys; I think this is enough for today, and I hope you enjoyed this educational content. However, don't forget to ask your questions below and support me with your likes and follows for more of this content. 🐺🔥

Double Bottom Pattern: Bitcoin Total Domination Last week my post on Bitcoin dominance played out faster than it was expected.
(see related)
This indicator broke out into 60-70% area.
So, I switched to a weekly time frame and spotted a classic reversal pattern called "Double Bottom" in the making for you.
Let's break it down.
We have two bottoms highlighted with yellow arcs in the same area.
Indicator eyes the middle top between bottoms, it is called "Neckline"
Now, let's breakdown buying technique:
1) buy entry is at the breakout above Neckline (green dashed line)
2) stop loss is at the valley of the right bottom (red dashed line)
3) target is located at the depth of the right bottom from the Neckline.
in our case it can't be higher than 100% and is set at the maximum (blue dashed line)
Its amazing that technical analysis could predict things that out of our scope as yet.

Pattern Patience: Mastering Emotional Discipline Morning Trading Community
Ever feel like your emotions mess with your trading? This video's for you. We'll explore how patience with chart patterns, like the double bottom, can teach us discipline. It's about waiting for the right moment, not rushing in.
Kris/Mindbloome Exchange
Trade What You See

Technical Analysis of Bajaj Finserv (BAJAJFINSV): A Bullish BreOverview and Key Observations
Bajaj Finserv has recently shown signs of a bullish reversal after breaking out of a classic double bottom pattern, a strong indicator of upward momentum. The neckline at ₹1,680 was breached with significant volume, confirming the breakout. The current price of ₹1,735.20 positions the stock above this critical support, establishing a solid base for further upside. The pattern suggests a measured target of ₹1,800, aligning with intermediate resistance levels.
Support and Resistance Levels
The chart highlights the following critical levels for traders:
Support Levels:
₹1,693.73: Immediate support just below the current price, ideal for pullbacks.
₹1,652.27: Intermediate support aligning with prior consolidations.
₹1,630.13: A deeper demand zone marking the bottom of the previous accumulation phase.
Resistance Levels:
₹1,757.33: The immediate resistance that needs to be breached for continued upside.
₹1,779.47: A key resistance level and the target based on the double bottom pattern height.
₹1,820.93: A stronger resistance and the next major target for the stock.
The stock currently faces resistance near ₹1,757.33, and a breakout above this level with strong volume could open the doors for a rally toward ₹1,779.47 and ₹1,820.93.
Volume and Momentum
The breakout candle exhibited a notable surge in volume, validating the reliability of the bullish move. However, subsequent candles show declining volume, suggesting mild consolidation near resistance. Momentum indicators such as the RSI and MACD need to be monitored for confirmation of continued strength. If RSI remains below 70, there is room for further upward movement.
Trading Strategies
For swing traders, entering long positions near ₹1,700–₹1,720 on pullbacks or above ₹1,757 after a breakout offers good opportunities. A stoploss at ₹1,669, below Support 1, ensures risk is minimized. Targets include ₹1,757.33, ₹1,779.47, and ₹1,820.93. For shortterm traders, a failure to sustain above ₹1,680 could indicate weakness, with downside targets of ₹1,652.27 and ₹1,630.13.
Summary and Outlook
Bajaj Finserv is exhibiting strong bullish momentum backed by technical patterns and volume. The immediate focus is on clearing the resistance at ₹1,757.33 to confirm further upside toward ₹1,779.47 and ₹1,820.93. Traders should remain cautious of a potential retest of the ₹1,680 support zone, which would act as a critical level for invalidating the bullish setup. With strong risk management and a focus on key levels, this setup offers a promising opportunity for both shortterm and longterm gains.

Bullish Double Bottom Pattern Tutorial: 4/8 Bullish PatternsGive me the description for a bullish double-bottom
A bullish double bottom is a powerful reversal chart pattern that signals the potential end of a downtrend and the beginning of an upward trend. Here’s how it forms:
Two Troughs: The pattern starts with a significant price decline, forming a low (the first bottom). The price then rebounds to create a peak (the middle of the "W" shape) but soon declines again to form a second bottom roughly at the same price level as the first bottom. This double bottom resembles the letter "W."
Neckline: The horizontal line that connects the peak of the middle rebound is called the neckline. This is a key resistance level that the price needs to break through to confirm the pattern.
Breakout: A breakout above the neckline, typically accompanied by increased volume, confirms the double bottom pattern and signals a potential trend reversal from bearish to bullish.
Price Target: The estimated price target for the upward move is usually determined by measuring the distance from the bottoms to the neckline and projecting this distance upwards from the point of breakout.
Traders view the double bottom as a strong indication that the previous downtrend has exhausted and the bulls are gaining control, leading to a potential significant upward movement.

Beginner Chart Patterns: Head & Shoulders, Double Tops and MoreWelcome to the world of chart patterns—the place where every price action tells a story. And if you read it right, you might just walk away with profits. In this Idea, we explore the immersive corner of technical analysis where chart patterns shape to potentially show you where the price is going. We’ll keep it tight and break down the most popular ones so you’d have more time to take your knowledge for a spin and look for some patterns (risk-free with a paper trading account ?). Let’s roll.
Chart patterns are the market’s version of geometry paired with hieroglyphics. They might look like random squiggles at first, but once you learn to decode them, they might reveal where the market is headed next. Here are the mainstay chart patterns everyone should start with: Head and Shoulders, Double Tops, and a few other gems.
1. Head and Shoulders: The King of Reversals
First up is the Head and Shoulders pattern—an iconic, evergreen, ever-fashionable formation that traders dream about. Why? Because it’s a reliable reversal pattern that often signals the end of a trend and the beginning of a new one.
Here’s the breakdown: Imagine a market that’s been climbing higher. It forms a peak (a shoulder), pulls back, then rallies even higher to form a bigger peak (the head), only to drop again. Finally, it gives one last weak attempt to rise (the second shoulder), but it can’t reach the same height as the head. The neckline, a horizontal line connecting the two lows between the peaks, is your trigger. Once the price breaks below it, it’s time to consider shorting or bailing on your long position.
And yes, there’s an inverted version of this pattern too. It looks like a man doing a handstand and signals a trend reversal from bearish to bullish. That’s Head and Shoulders—flipping trends since forever.
2. Double Tops and Double Bottoms: The Market’s Déjà Vu
Next up, we have the Double Top and Double Bottom patterns—the market’s way of saying, “Been there, done that.” These patterns occur when the price tries and fails—twice—to break through a key level.
Double Top : Picture this: The price surges to a high, only to hit a ceiling and fall back. Then, like a stubborn child, it tries again but fails to break through. That’s your Double Top—two peaks, one resistance level, and a potential trend reversal in the making. When the price drops below the support formed by the dip between the two peaks, it’s a signal that the bulls are out of steam.
Double Bottom : Flip it over, and you’ve got a Double Bottom—a W-shaped pattern that forms after the price tests a support level twice. If it can’t break lower and starts to rally, it’s a sign that the bears are losing control. A breakout above the peak between the two lows confirms the pattern, signaling a potential bullish reversal.
3. Triangles: The Calm Before the Storm
Triangles are the market’s way of coiling up before making a big move. They come in three flavors—ascending, descending, and symmetrical.
Ascending Triangle : Here’s how it works: The price forms higher lows but keeps bumping into the same resistance level. This shows that buyers are getting stronger, but sellers aren’t ready to give up. Eventually, pressure builds and the price breaks out to the upside. But since it’s trading, you can expect the price to break to the downside, too.
Descending Triangle : The opposite of the ascending triangle, this pattern shows lower highs leaning against a flat support level. Sellers are gaining the upper hand and when the price breaks below the support, it’s usually game over for the bulls. But not always—sometimes, bulls would have it their way.
Symmetrical Triangle : This is the market’s version of a coin toss. The price is squeezing into a tighter range with lower highs and higher lows. It’s anyone’s guess which way it’ll break, but when it does, expect a big move in that direction.
4. Flags and Pennants: The Market’s Pit Stop
If triangles are the calm before the storm, then flags and pennants are the pit stops during a race. These patterns are continuation signals, meaning that the trend is likely to keep going after a brief pause.
Flags : Flags are rectangular-shaped patterns that slope against the prevailing trend. If the market’s in an uptrend, the flag will slope downwards, and vice versa. Once the price breaks out of the flag in the direction of the original trend, it’s usually off to the races again.
Pennants : Pennants look like tiny symmetrical triangles. After a strong move, the price consolidates in a small, converging range before breaking out and continuing the trend. They’re short-lived but pack a punch.
Final Thoughts
To many technical analysts, chart patterns are the best thing the market can do. The secret code, or however you may want to call them, they can give you insight into the dealmaking between buyers and sellers and hint at what might happen next.
Whether it’s a Head and Shoulders flashing a trend reversal, a Double Top marking a key resistance level, or a Triangle gearing up for a breakout, these patterns are essential tools in your trading garden.
So next time you stare at a chart, keep in mind that you’re not just looking at random lines. You’re reading the market’s mind from a technical standpoint. And if you know what to look for, you’re one step closer to cracking the code.

Options Blueprint Series: Ratio Spreads for the Advanced TraderIntroduction to Ratio Spreads on E-mini Dow Jones Futures
In the dynamic world of options trading, Ratio Spreads stand out as a sophisticated strategy designed for traders looking to leverage market nuances to their advantage. Regular options on the E-mini Dow Jones Futures are a popular choice (YM).
Defining the E-mini Dow Jones (YM) Futures Contract
Before delving into the specifics of Ratio Spreads, understanding the underlying contract on which these options are based is crucial. The E-mini Dow Jones Futures, symbol YM, offers traders exposure to the 30 blue-chip companies of the Dow Jones Industrial Average in a smaller, more accessible format. Each YM contract represents $5 per index point.
Key Contract Specifications:
Point Value: $5 per point of the Dow Jones Industrial Average.
Trading Hours: Sunday - Friday, 6:00 PM - 5:00 PM (Next day) ET with a trading halt from 5:00 PM - 6:00 PM ET daily.
Margins: Varied based on broker but generally lower than the full-sized contracts, providing a cost-effective entry for various trading strategies. CME Group suggests $8,400 per contract at the time of this publication.
Ratio Spread Margins: Often require a careful calculation as they involve multiple positions. Traders must consult with their brokers to understand the specific margin requirements for entering into ratio spreads using YM futures. Margins for Ratio Spreads are often equal to the margin requirement when trading the outright futures contract.
Understanding Ratio Spreads
Ratio Spreads involve buying and selling different amounts of options at varying strike prices, but within the same expiration period. This strategy is typically employed to exploit expected directional moves or stability in the underlying asset, with an additional emphasis on benefiting from time decay.
Types of Ratio Spreads:
Call Ratio Spread: Involves buying calls at a lower strike price and selling a greater number of calls at a higher strike price. This setup is generally used in mildly bullish scenarios.
Put Ratio Spread: Consists of buying puts at a higher strike price and selling more puts at a lower strike price, suitable for mildly bearish market conditions.
Mechanics:
Execution: Traders initiate these spreads by first determining their view on the market direction. For a bullish outlook, a call ratio spread is suitable; for a bearish view, a put ratio spread would be applicable.
Objective: The primary goal is to benefit from the premium decay of the short positions outweighing the cost of the long positions. This is enhanced if the market moves slowly towards the strike price of the short options or remains at a standstill.
Risk Management: It's crucial to manage risks as these spreads can lead to limited losses if the market moves against the trader, or surprisingly to many, to unlimited losses if the market moves sharply in the desired direction. Proper stop-loss settings, adjustments and continual market analysis are imperative.
Focused Strategy: Bullish Call Ratio Spread
In the context of the E-mini Dow Jones, considering the current upward trend with potential slow advancement due to overhead UFO (UnFilled Orders) Resistances, a Bullish Call Ratio Spread can be particularly effective. This strategy allows traders to capitalize on the gradual upward movement while keeping a lid on risks associated with faster, unexpected spikes.
Strategy Setup:
Selecting Strikes: Choose a lower strike where the long calls are bought and a higher strike where more calls are sold. The selection depends on the resistance levels indicated by the UFOs.
Position Sizing: Typically, the number of calls sold is higher than those bought, maintaining a ratio that aligns with the trader's risk tolerance and market outlook.
Market Conditions: Best implemented when expecting a gradual increase in the market, allowing time decay to erode the value of the short call positions advantageously.
Real-time Market Example: Bullish Call Ratio Spread on E-mini Dow Jones Futures
Given the current market scenario where the Dow Jones Index is experiencing a bullish breakout, it’s crucial to align our options trading strategy to take advantage of potential slow upward movements signaled by overhead UFO Resistances. This setup suggests a favorable environment for a Bullish Call Ratio Spread, aiming to maximize the benefits of time decay while managing risk exposure effectively.
Setting Up the Bullish Call Ratio Spread:
1. Selection of Strike Prices:
Long Calls: Choose a strike price near the current market level (Strike = 39000).
Short Calls: Set the higher strike prices right at or above the identified UFO Resistances (Strike = 41000). The rationale here is that these levels are expected to cap the upward movement, thus enhancing the likelihood that these short calls expire worthless or decrease in value, maximizing the time decay benefit.
2. Ratio of Calls:
Opt for a ratio that reflects confidence in the bullish movement but also cushions against an unexpected rally. A common setup might be 1 long call for every 2 short calls.
Execution:
Trade Entry: Enter the trade when you observe a confirmed break above a minor resistance or a pullback that respects the upward trend structure.
Monitoring: Regularly monitor the price action as it approaches the UFO Resistances. Adjust the position if the market shows signs of either stalling or breaking through these levels more robustly than anticipated.
Trade Management:
Adjustments: If the market advances towards the higher strike more quickly than expected, consider buying back some short calls to reduce exposure.
Risk Control: Implement stop-loss orders to mitigate potential losses should the market move sharply against the position. This could be set at a level where the market structure changes from bullish to bearish.
This real-time scenario provides a practical example of how advanced traders can utilize Bullish Call Ratio Spreads to navigate complex market dynamics effectively, leveraging both market sentiment and technical resistance points to structure a potentially profitable trade setup.
Advantages of Ratio Spreads in Options Trading
Ratio Spreads offer a strategic advantage in options trading by balancing the potential for profit with a controlled risk management approach. Here are some key benefits of incorporating Ratio Spreads into your trading arsenal:
1. Maximizing Time Decay
Optimized Premium Decay: By selling more options than are bought, traders can capitalize on the accelerated decay of the premium of short positions. This is particularly advantageous in markets exhibiting slow to moderate price movements, as expected with the current Dow Jones trend influenced by UFO resistances.
2. Cost Efficiency
Reduced Net Cost: The cost of purchasing options is offset by the income received from selling options, reducing the net cost of entering the trade. This can provide a more affordable way to leverage significant market positions without a substantial upfront investment. The Net Debit paid is 403.4 (690 – 143.3 – 143.3) = $2,017 since each YM point is worth $5.
Note: We are using the CME Group Options Calculator in order to generate fair value prices and Greeks for any options on futures contracts.
3. Profit in Multiple Market Conditions
Versatile Profit Scenarios: Depending on the setup, Ratio Spreads can be profitable in a stagnant, slightly bullish, or slightly bearish market. The key is the strategic selection of strike prices relative to expected market behavior, enabling profits through slight directional moves while protected against losses from significant adverse moves.
4. Flexible Adjustments
Scalability and Reversibility: Given their structure, Ratio Spreads allow for easy scaling or reversing positions depending on market movements and trader outlook. This flexibility can be a critical factor in dynamic markets where adjustments need to be swift and cost-effective.
Risk Management in Ratio Spreads
While Ratio Spreads offer several benefits, they are not without risks, particularly from significant market moves that can lead to potentially unlimited losses. Here’s how to manage those risks:
Stop-Loss Orders: Setting stop-losses at predetermined levels can help traders exit positions that move against them, preventing larger losses.
Position Monitoring: Regular monitoring and analysis are crucial, especially as the market approaches or reaches the strike price of the short options.
Adjustments: Being proactive about adjusting the spread, either by buying back short options or by rolling the positions to different strikes or expiries, can help manage risk and lock in profits.
Conclusion
Ratio Spreads, particularly in the format of Bullish Call Ratio Spreads demonstrated with E-mini Dow Jones Futures, offer a sophisticated strategy that balances potential profit with manageable risks. This approach is suited for traders who have a nuanced understanding of market dynamics and can navigate the complexities of options with strategic finesse.
When charting futures, the data provided could be delayed. Traders working with the ticker symbols discussed in this idea may prefer to use CME Group real-time data plan on TradingView: www.tradingview.com This consideration is particularly important for shorter-term traders, whereas it may be less critical for those focused on longer-term trading strategies.
General Disclaimer:
The trade ideas presented herein are solely for illustrative purposes forming a part of a case study intended to demonstrate key principles in risk management within the context of the specific market scenarios discussed. These ideas are not to be interpreted as investment recommendations or financial advice. They do not endorse or promote any specific trading strategies, financial products, or services. The information provided is based on data believed to be reliable; however, its accuracy or completeness cannot be guaranteed. Trading in financial markets involves risks, including the potential loss of principal. Each individual should conduct their own research and consult with professional financial advisors before making any investment decisions. The author or publisher of this content bears no responsibility for any actions taken based on the information provided or for any resultant financial or other losses.

Why You Should Avoid Trading Standard Patterns: Deeper AnalysisTrading based on technical analysis is a popular way for traders to identify market opportunities. One of the most common methods of technical analysis is the use of chart patterns. These patterns are recognizable formations created by price movements on a chart.
Traders use these patterns to identify potential areas of support and resistance, as well as trend reversals. However, there are several reasons why you should avoid trading standard patterns:
1. Widespread Awareness and Anticipation:
Standard patterns are well-known and widely anticipated by market participants. This means that they are already priced in, making trading them a low-probability strategy.
2. Potential for False Signals:
The formation of a pattern on a chart does not guarantee the expected outcome. In fact, standard patterns can often lead to false breakouts and failed trades.
3. Difficulty in Trading Effectively:
Trading standard patterns effectively requires a high level of skill and experience. Without a deep understanding of market structure and price behavior, traders can easily fall victim to false signals and whipsaws.
Advantages of Trading Liquidity Patterns:
Liquidity patterns offer a more effective and reliable alternative to standard patterns. These patterns are based on the concept of market liquidity, which refers to the ease with which an asset can be bought or sold without impacting its price. By identifying areas of high and low liquidity, traders can gain an edge in the market.
In-depth Analysis of Popular Patterns:
1. Double Bottom:
The classic double bottom pattern is a bullish reversal pattern that forms when the price of an asset makes two consecutive lows at the same level, followed by a rally.
However, the standard double bottom pattern has a significant drawback: it leaves liquidity below the lows, which can lead to false breakouts and failed trades.
A more effective way to trade this pattern is to look for a lower low. This occurs when the price makes a new low below the previous two lows. This indicates that the market is absorbing all the sell liquidity and is ready to move higher.
2. Triangle:
A triangle is a consolidation pattern that forms when the price of an asset ranges between two converging trendlines.
Traders often look for breakout trades in triangles, but this can be risky.
False breakouts are a common occurrence in triangle patterns.
This is because market makers often manipulate the price to induce traders to break out of the pattern, only to reverse the price and trap them in losing trades.
A more effective way to trade triangles is to look for liquidity grabs. This occurs when the price moves outside of the triangle, only to quickly return back inside. This indicates that market makers are taking liquidity from the market and are preparing to move the price in the opposite direction.
Practical Tips for Trading Liquidity Patterns:
Always trade with the trend. Liquidity patterns are most effective when they are traded in the direction of the overall trend.
Use stop-loss orders to protect your downside. This will help to limit your losses if the trade does not go your way.
Be patient and wait for the right setup. Don't force trades and only take those that meet your criteria.
Additional Considerations:
Market context: It is important to consider the overall market context when trading liquidity patterns. For example, patterns are more likely to be successful in trending markets than in range-bound markets.
Risk management : Always use sound risk management principles when trading, regardless of the pattern you are using. This includes using stop-loss orders and position sizing appropriately.
False signals: It is important to be aware of the potential for false signals when trading liquidity patterns. Not all patterns will lead to successful trades, and it is important to be prepared for losses.

Learn to identify some useful Chart patterns, Merry Christmas🎄 Unlocking the Secrets of Chart Patterns: Navigating Market Trends 📈
Season's Greetings to all our readers! As we celebrate the spirit of the holidays, let's delve into the fascinating world of financial markets. In our journey to understand and navigate the complexities of trading and investing, we've touched upon essential chart patterns that can serve as invaluable guides for market enthusiasts.
In the midst of the festive cheer, let's revisit some of these powerful indicators: the Double Bottom, Flag and Pole, Bullish Pennant, Rising Wedge, Falling Wedge, Triple Top, and Inverted Head and Shoulders. Understanding these patterns can be akin to unwrapping gifts of insight into potential market movements.
So, grab a cup of cocoa, settle into your favorite chair, and join us as we explore the significance of these chart patterns and share practical tips on incorporating stop-loss strategies to enhance your trading toolkit.
Wishing you a Merry Christmas filled with joy, warmth, and prosperous insights in the financial markets! 🎅🎁🚀
Double Bottom:
Description: Imagine a smiley face turned upside down. A double bottom is a chart pattern that looks like two rounded troughs (bottoms) next to each other.
Interpretation: Indicates a possible reversal of a downtrend. The price has tried to go down twice but failed, suggesting a potential upward movement.
Stop-Loss Tip: One can place a stop-loss slightly below the lowest point of the double bottom. If the price falls below this level, it may invalidate the pattern.
Flag and Pole:
Description: Think of a flag on a flagpole. The "pole" is a strong, quick price movement, and the "flag" is a rectangular-shaped consolidation pattern.
Interpretation: The flag and pole pattern often signals a continuation of the previous trend. The flag represents a brief pause before the price resumes its original direction.
Stop-Loss Tip: One should set a stop-loss just below the lower end of the flag. If the price drops below this level, it might suggest a reversal of the trend.
Bullish Pennant:
Description: Similar to the flag and pole but with a small symmetrical triangle (pennant) instead of a rectangle.
Interpretation: Indicates a temporary consolidation after a strong upward movement. It suggests that the bullish trend might continue after the brief pause.
Stop-Loss Tip: Place a stop-loss under the lower trendline of the pennant. A break below this line could signal a potential trend reversal.
Rising Wedge:
Description: Picture a triangle with its top side steeper than the bottom side. The price makes higher highs and higher lows but in a narrowing range, with indicator making Lower Highs (Bearish Divergences).
Interpretation: This pattern can indicate a potential reversal to the downside. It suggests that the buying interest is weakening, and the price may soon decline.
Stop-Loss Tip: Place a stop-loss just above the last price swing high of the wedge. If the price drops below this line, it may suggest a potential reversal.
Falling Wedge:
Description: Similar to the rising wedge but inverted. The top side is less steep than the bottom side.
Interpretation: Represents a potential reversal to the upside. It suggests that selling pressure is weakening, and the price may be ready to move higher.
Stop-Loss Tip: Place a stop-loss just below the last price swing low of the wedge. If the price drops below this line, it may suggest a potential reversal.
Triple Top:
Description: Visualize a horizontal line touching the tops of three consecutive peaks.
Interpretation : Indicates a possible reversal of an uptrend. The price has failed to break above a certain level three times, suggesting a potential downturn.
Stop-Loss Tip: One should set a stop-loss slightly above the highest point of the triple top. If the price rises above this level, it may negate the pattern.
Inverted Head and Shoulders:
Description: Picture three troughs, where the middle one (head) is lower than the two on either side (shoulders).
Interpretation: This pattern suggests a potential reversal from a downtrend to an uptrend. It signifies a shift in momentum from bearish to bullish.
Stop-Loss Tip: One should place a stop-loss just below the neckline (the line connecting the highs of the pattern). If the price falls below this line, it might indicate a failed reversal.
I am not Sebi registered analyst. My studies are for educational purpose only.
Please Consult your financial advisor before trading or investing. I am not responsible for any kinds of your profits and your losses.
Most investors treat trading as a hobby because they have a full-time job doing something else.
However, If you treat trading like a business, it will pay you like a business.
If you treat like a hobby, hobbies don't pay, they cost you...!
Hope this post is helpful to community
Thanks
RK💕
Disclaimer and Risk Warning.
The analysis and discussion provided on in.tradingview.com is intended for educational purposes only and should not be relied upon for trading decisions. RK_Charts is not an investment adviser and the information provided here should not be taken as professional investment advice. Before buying or selling any investments, securities, or precious metals, it is recommended that you conduct your own due diligence. RK_Charts does not share in your profits and will not take responsibility for any losses you may incur. So Please Consult your financial advisor before trading or investing.

Double Top vs. Double Bottom PatternsHello traders and investors! If you appreciate our charts, give us a quick 💜💜.
Trading double tops and double bottoms is a common strategy in technical analysis used by traders to identify potential trend reversal points in financial markets. These patterns can occur in various timeframes and on different assets, including crypto, stocks, forex, and commodities. Here's a guide on how to trade double tops and double bottoms:
1. Identify the Double Top and Double Bottom Patterns:
🔺🔺 Double Top: This pattern forms after an uptrend and consists of two peaks at approximately the same price level, separated by a trough in between. It indicates that the uptrend may be losing momentum.
🔻🔻 Double Bottom: This pattern forms after a downtrend and consists of two troughs at approximately the same price level, separated by a peak in between. It suggests that the downtrend may be losing strength.
2. Confirm the Pattern:
Look for confirmation of the pattern through other technical indicators such as volume, trendlines, and oscillators (e.g., RSI, MACD). Confirmatory signals can increase the reliability of the pattern.
3. Entry and Exit Strategies:
Entry: For a double top pattern, consider entering a short (sell) position when the price breaks below the trough that separates the two peaks. For a double bottom pattern, consider entering a long (buy) position when the price breaks above the peak that separates the two troughs.
Stop-Loss: Always set a stop-loss order to limit potential losses. Place it above the double top (for short positions) or below the double bottom (for long positions) to protect your trade.
Take Profit : Determine your profit target based on factors such as the depth of the pattern and overall market conditions. You can use support and resistance levels or Fibonacci retracement levels as potential profit targets.
4. Risk Management:
Ensure you use proper risk management techniques, such as position sizing, to protect your capital. Avoid risking more than a 10% of your trading capital on a single trade.
5. Timeframe Considerations:
Double top and double bottom patterns can appear on various timeframes. Shorter timeframes (e.g., 1-hour, 4-hour) may provide more opportunities but are also more prone to false signals. Longer timeframes (e.g., daily, weekly) may offer more reliable signals but fewer trading opportunities.
6. Monitor for False Breakouts:
Be aware of false breakouts where the price briefly penetrates the pattern's neckline (the level that separates the two peaks or troughs) but then reverses. False breakouts can occur, so it's essential to monitor the price action closely.
7. Practice and Analysis:
Backtest the double top and double bottom patterns on historical data to gain confidence in your trading strategy. Continuously analyze your trades and adapt your strategy as needed.
8. Combine with Other Indicators:
Consider using other technical indicators, such as moving averages, Bollinger Bands, or Fibonacci retracements, in conjunction with double tops and double bottoms to enhance your trading strategy.
Remember that no trading strategy is foolproof, and there are always risks involved in trading financial markets. It's essential to have a well-thought-out trading plan, manage your risk, and practice discipline to become a successful trader. Additionally, consider seeking advice from experienced traders or financial professionals before implementing any trading strategy.

📈 4 BULLISH PATTERNS YOU NEED TO KNOW📌How to easily identify these patterns?
🟢Cup and Handle Pattern
The cup and handle pattern is a bullish continuation pattern that typically occurs after a significant uptrend. It is characterized by a U-shaped "cup" followed by a smaller consolidation known as the "handle." The cup portion represents a temporary pause or correction in the price, forming a rounded bottom. This signifies that selling pressure has diminished, and buyers are stepping in. After the cup formation, the handle is formed as a slight downward drift in price, usually in the form of a small consolidation or a shallow retracement. The handle represents a final consolidation before the resumption of the bullish move. The handle should be relatively smaller in size and have a downward-sloping price action.
🟢Double Bottom
The double bottom pattern is a bullish reversal pattern that signifies a potential trend reversal from bearish to bullish. It consists of two consecutive lows that are approximately at the same level, forming a support level. The first low represents a selling climax or a period of intense selling pressure. After the first low, the price rebounds and retraces to form a temporary high, creating a potential resistance level. However, buyers step in again, pushing the price back up, resulting in a second low that matches or is very close to the level of the first low. This double bottom formation indicates a significant level of support where buying interest outweighs selling pressure.
🟢 Bullish Flag
The bullish flag pattern is a continuation pattern that occurs after a strong upward move in price. It is characterized by a brief period of consolidation, where the price forms a narrow and rectangular range, resembling a flagpole and a flag. The flag portion of the pattern is typically slanted in the opposite direction of the initial price move. The flagpole represents the initial strong upward move, indicating a surge in buying interest. Following the flagpole, the price enters a consolidation phase, represented by the flag. This consolidation allows the price to stabilize and absorb selling pressure. The flag pattern should have parallel trendlines that contain the price action.
🟢Inverse Head and Shoulders
The inverse head and shoulders pattern is a bullish reversal pattern that indicates a potential shift from a bearish to a bullish trend. It consists of three consecutive lows, with the middle low (the head) being lower than the two outer lows (the shoulders). The pattern resembles a head between two shoulders. The left shoulder forms as the price declines, followed by a subsequent rally to create a temporary high. The price then retraces, forming the head, which is lower than both the left and right shoulders. After the head, the price rallies again to form the right shoulder, which is usually slightly higher than the left shoulder.
👤 @QuantVue
📅 Daily Ideas about market update, psychology & indicators
❤️ If you appreciate our work, please like, comment and follow ❤️

📊 How to: The Double Bottom Pattern📍 What is the Double Bottom Pattern?
The double bottom pattern is a trend reversal pattern observed on charts, such as bar and Japanese candlestick charts. Similar to the double top pattern, it consists of two bottom levels near a support line called the neckline. The pattern indicates the end of a downtrend and is confirmed by two failed attempts to break the support level. As a bullish reversal pattern, it signifies a shift in momentum and is commonly used by traders to enter long buying positions.
📍 How to Identify
In general, it is fairly simple to identify a double bottom pattern on a trading chart. This pattern can be identified when the price retests the support line and rises up again above the neckline. As a tip, you can usually identify the pattern as a “W” letter formation.
💥 Key Takeaways
The double bottom pattern is a bearish momentum reversal resembling the letter W.
It requires three main elements: first low, second low, and a clear neckline to identify the formation.
The pattern is more effective at the end of a strong downtrend rather than in a ranging market.
Drawing a support level and a neckline is necessary to trade this pattern.
Confirming the pattern with other technical analysis tools like moving averages, RSI, Fibonacci retracement level, and MACD is important.
The recommended approach to trading the double bottom pattern is to wait for the price to break the neckline with a stop-loss order and assess the risk-reward ratio.
👤 @QuantVue
📅 Daily Ideas about market update, psychology & indicators
❤️ If you appreciate our work, please like, comment and follow ❤️

How To Trade Double Bottom Pattern?
✅In the world of forex trading, understanding patterns and trends can make all the difference between profit and loss. One popular pattern that traders often look out for is the double bottom, also known as the "W" pattern.
✅The double bottom pattern occurs when the price of a currency pair reaches a low point, bounces back up, dips again to the same level, and then bounces back up again, creating a "W" shape. Essentially, the market has twice failed to break through the support level, indicating a potential reversal to the upside.
✅This pattern is often seen as a bullish indicator, as it suggests that buyers are stepping in and pushing the price up. It is important to note, however, that the second bounce should not dip below the first one, as this could indicate a continuation of the bearish trend.
✅So, how can traders take advantage of the double bottom pattern? One strategy is to enter a long position once the price breaks out above the resistance level created by the two bounces. This breakout confirms the reversal and can signal a potential uptrend.
✅It is also important to combine the double bottom pattern with other technical indicators, such as the Relative Strength Index (RSI) or Moving Average Convergence Divergence (MACD), to confirm the potential reversal.
✅However, as with any trading pattern, it is important to approach the double bottom with caution and to always have a solid risk management strategy in place. Traders should also be aware of potential false signals and market noise that could obscure the true trend.
✅In summary, the double bottom pattern can be a useful tool for forex traders looking to identify potential reversals and enter profitable trades. By combining it with other technical indicators and practicing proper risk management, traders can improve their chances of success in the ever-changing and unpredictable world of forex trading.
I hope this post was helpful to some of our beginner traders😊
Dear followers, let me know, what topic interests you for new educational posts?

How To Spot A Reversal Like a Pro!Hello Traders,
Spotting a reversal is always a daunting task I know. That is I use a 2 Step Down Timeframe Method to spot a reversal in correct way. I have explained step by step so please watch in full to understand it clearly. Also do not forget to like the video and let me know in the comment section if you have nay questions.

DOUBLE BOTTOMHello everyone!
It's time to repeat the most popular patterns in trading.
One of these patterns is a DOUBLE BOTTOM.
Forming
There are several factors that you should pay attention to.
First, a new minimum appears.
This breakthrough is accompanied by increased volumes.
Such volumes are fixed by the indicator at this point, because there were a lot of stop orders here and the market absorbed them.
After this breakdown, the price begins a correction.
Nowhere without correction.
The correction is usually made to the breakout level, which used to be support, and now is resistance.
Having reached the level, the price turns down again.
And here is an important point.
If this breakdown is strong, then the price should go to update the lows further.
In theory, you can open short positions in the rebound area in the hope of continuing the trend.
Then we see the formation of the second bottom.
One of the main factors that the price will not fall further is the declining volumes.
This is a divergence.
From this we understand that forces are shifting to the other side and the trend may change.
In addition, we see that the price could not gain a foothold below the first bottom, which tells us about the weakness of sellers.
results
A double bottom is often found on the chart and serves as a signal for closing short positions and possibly opening long positions.
With a proper understanding of this pattern, you can get a lot of profit from trading.
The main thing is not to forget to monitor volumes, divergence and candlesticks that indicate the strength or weakness of the trend.
Traders, if you liked this idea or if you have your own opinion about it, write in the comments. I will be glad 👩💻

The Doube Bottom Pattern - Bullish PatternThe **Double Bottom** is a price action pattern that is indicative of a trend change once activated. Price needs to establish a bearish expansion towards the lows before reversing with an impulse. The impulse then needs to get sold into; this will create a retest of the previous low that must hold. Price action will establish a “W” structure which become a sign of demand that leads to a bullish expansion.
Key Characteristics of the **Double Bottom**
- Price Action must first establish a bearish expansion
- The retest of the previous low most hold
- A ‘W’ like formation will confirm demand at the lows
