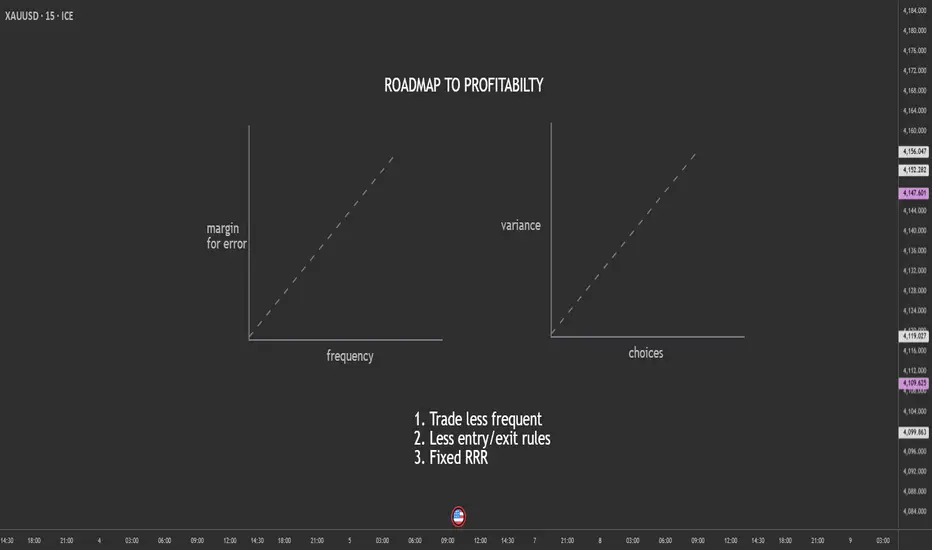
Trade Less, Choose Less, Profit More: The Counterintuitive Edge.Most retail traders believe they need more—more trades, more setups, more indicators, more signals. But in reality, the traders who survive (and thrive) do the opposite. They trade less frequently, reduce the number of decisions, and lock in a fixed risk-to-reward ratio that keeps their edge stable.
Here’s why simplifying your trading increases your chances of long-term profitability.
1. Trading Less Reduces Mistakes
Every trade is a decision.
Every decision carries emotional and cognitive load.
The more trades you take:
the more tired your brain becomes
the more emotional impulses creep in
the more likely you are to overreact to noise
the more commissions/spreads you pay
the more small errors compound into big losses
By reducing trading frequency, you automatically reduce the number of opportunities for mistakes.
Fewer trades → Higher quality → More consistency.
Elite traders don’t take every “okay” trade.
They wait for the A+ setups that align perfectly with their plan.
2. Fewer Choices = Lower Variance in Outcomes
When you have too many signals, too many strategies, or too many timeframes, your decision-making becomes inconsistent. Choice overload raises the variance in outcomes—you might catch a big win today and then give it all back tomorrow on impulsive trades.
Reducing choices tightens your performance curve.
When you:
trade one setup type
focus on one pair or market
use one timeframe
follow one clear trigger
…your results stabilize. The randomness disappears, and your edge becomes measurable.
A stable edge is a profitable edge.
3. A Fixed RRR Protects You From Yourself
Most traders blow accounts not because of strategy, but because of inconsistent risk-to-reward ratios.
Sometimes they take 1:3, sometimes they settle for 1:1, sometimes they hold for 1:6 and give it back. This inconsistency destroys expectancy.
A fixed RRR:
forces discipline
keeps losses small
standardizes wins
makes your edge mathematically trackable
creates predictable long-term performance
Your job is NOT to predict the market.
Your job is to control the asymmetry between risk and reward.
A consistent 1:2 or 1:3 turns even a 40% win rate into profitability.
Final Thought
If you feel stuck, overwhelmed, or inconsistent, don’t add more tools.
Remove them.
The fewer decisions you have to make, the fewer mistakes you make.
The fewer trades you take, the higher your quality becomes.
And the more consistent your RRR, the more likely you are to stay profitable.
In trading, less really is more.
Community ideas
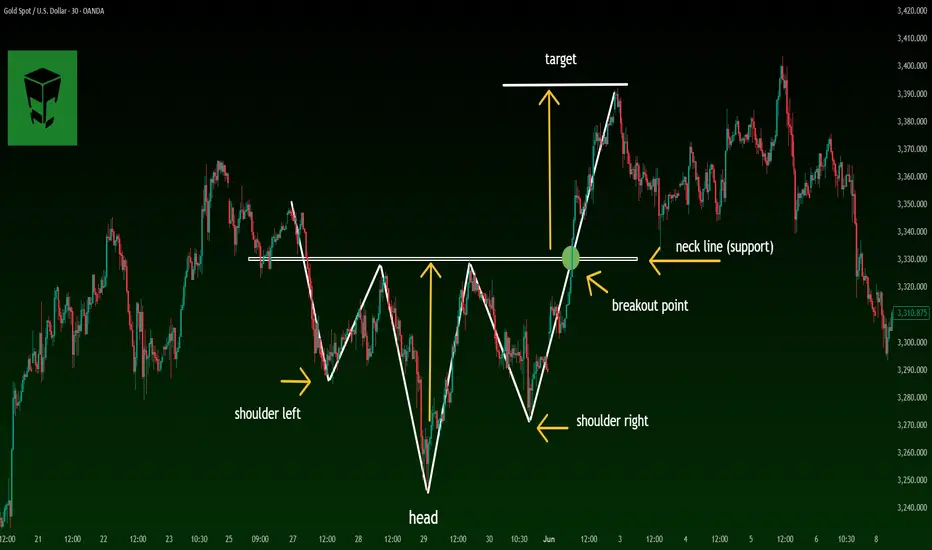
The One Pattern Every Trader Misses!Most traders focus on flags, wedges, double tops, fibs…
But there’s a pattern far more powerful, and almost no one talks about it:
-- The Behavior Pattern. --
📈It’s not drawn on your chart. You can’t code it into an indicator.
But it determines your success more than any formation.
Here’s the pattern professionals watch, and beginners ignore:
1️⃣ Impulsive Behavior
When price moves fast, traders move even faster.
FOMO kicks in. Chasing begins. Risk is forgotten.
Professional interpretation:
➡️ If emotions are impulsive, structure won’t be respected.
Avoid trading in emotional markets unless you already have a plan.
2️⃣ Hesitation Behavior
Price reaches your level. Your alert triggers.
Everything lines up… and you still don’t enter.
Why?
Because hesitation is a sign your risk is unclear.
Professional interpretation:
➡️ If hesitation appears, your plan isn’t ready.
The chart is never the problem, the plan is.
3️⃣ Revenge Behavior
One loss turns into five.
You stop trading the chart and start trading your frustration.
Professional interpretation:
➡️ If frustration is present, you’re trading without structure.
Step away. Market will be here tomorrow.
Why This Matters ⁉️
The market doesn’t punish bad trades. It punishes bad behavior.
Your biggest losing streaks didn’t come from your strategy.
They came from emotional patterns you didn’t recognize in real time.
Once you learn to see these behavior patterns, your charts become clearer, your decisions simpler, and your risk finally makes sense.
🧠Final Thought
Chart patterns tell you where the market might go.
Behavior patterns tell you whether you’ll survive long enough to get there.
Master both; and you’ll trade with the clarity most people never reach.
⚠️ Disclaimer: This is not financial advice. Always do your own research and manage risk properly.
📚 Stick to your trading plan regarding entries, risk, and management.
Good luck! 🍀
All Strategies Are Good; If Managed Properly!
~Richard Nasr
Fundamentals Masterclass: How to Trade CPI, NFP, and FOMCMost traders stare at charts all day, drawing support and resistance, only to get liquidated in seconds when a single news candle hits.
Why? Because Technical Analysis tells you When to enter, but Fundamental Analysis tells you Why the market is moving.
Whether you trade Bitcoin (BTC), Gold (XAUUSD), or Major Pairs, they all bow to one master: The US Economy.
In this guide, we break down the 5 Market Movers that control the charts and how you can trade them without gambling.
1. CPI (Consumer Price Index) – The Inflation Trigger
● What is it? The primary tool Central Banks use to track inflation (the price of goods and services).
● The "Healthy" Zone: The Fed targets 2% to 3% inflation. Anything significantly higher forces them to act.
The Trading Logic:
● High CPI (> Forecast): Inflation is hot. The Fed must raise interest rates to cool it down. Money becomes expensive.
● Low CPI (< Forecast): Inflation is cooling. The Fed might cut rates (Pivot). Money becomes cheap.
Market Reaction:
● Forex: High CPI = Bullish USD (Rates go up).
● Gold & Crypto: High CPI = Bearish (Risk-off assets dump).
● Pro Tip: If CPI comes in lower than expected, expect a violent Bitcoin Pump as
the market prices in a "Fed Pivot."
2. FOMC (Federal Open Market Committee) – The Main Event
● What is it? The meeting where the Federal Reserve decides on Interest Rates. This is the most volatile event of the month.
● Current Context: US Rates are hovering around 5.50%.
The Trading Logic:
● Higher Rates: Investors sell risky assets to buy safe US Bonds. Demand for USD skyrockets.
● Rate Cuts: Borrowing becomes cheap. The "Money Printer" turns on.
Market Reaction:
● Hawkish (Rate Hike/Hold): Liquidity dries up. Crypto & Gold Dump .
● Dovish (Rate Cut): Liquidity flows into high-risk assets. Crypto & Gold Moon
.
● Prop Trader Note: Released usually at 1 1:30 PM IST (2:00 PM EST). Spreads
widen massively. Do not hold tight stops during the speech.
3. NFP (Non-Farm Payroll) – The Volatility King
● What is it? A report showing new jobs added in the US (excluding farmers). It
reveals the true health of the labor market.
The "Bad is Good" Paradox:
Traders often get confused here. Why does "Good News" for the economy cause Bitcoin to dump?
● High NFP (More Jobs): Strong economy = The Fed feels confident to keep rates high. This is Bullish USD, but Bearish for Crypto/Gold.
● Low NFP (Fewer Jobs): Weak economy = The Fed might panic and cut rates to save jobs. This anticipation causes Crypto/Gold to Pump.
Market Reaction:
● Data > Forecast: USD📈 | Gold/BTC📉
● Data < Forecast: USD📉 | Gold/BTC📈
4. Unemployment Claims – The Recession Watch
● What is it? A weekly report showing how many people filed for unemployment benefits (Berojgari) for the first time.
● The Logic: This is the inverse of NFP.
Market Reaction:
● Claims Lower than Forecast: Fewer people are jobless (Strong Economy). Good for USD.
● Claims Higher than Forecast: More people are losing jobs (Weak Economy). Bad for USD -> Good for Crypto/Gold (Investors speculate on a bailout).
● Trading Confluence: If NFP is Strong (High) AND Unemployment Claims are Low, you have a "Double Confluence" for a massive US Dollar Long.
5. GDP (Gross Domestic Product) – The Health Score
● What is it? The total value of all goods and services produced. The ultimate economic scorecard.
● Example: India is currently the 5th largest economy based on GDP, attracting global investment into the Rupee.
The Crypto Nuance:
● High GDP: Economy is expanding. Good for stocks, but risks higher interest rates (Choppy for Crypto).
● Low GDP (Recession Fear): If GDP is too low (Negative), panic sets in. A full-blown recession can cause everything (Stocks, Crypto, and sometimes Gold) to dump initially as investors rush to cash.
● The Sweet Spot: We want a "Soft Landing"—Growth slowing down just enough to cut rates, but not enough to crash the economy.
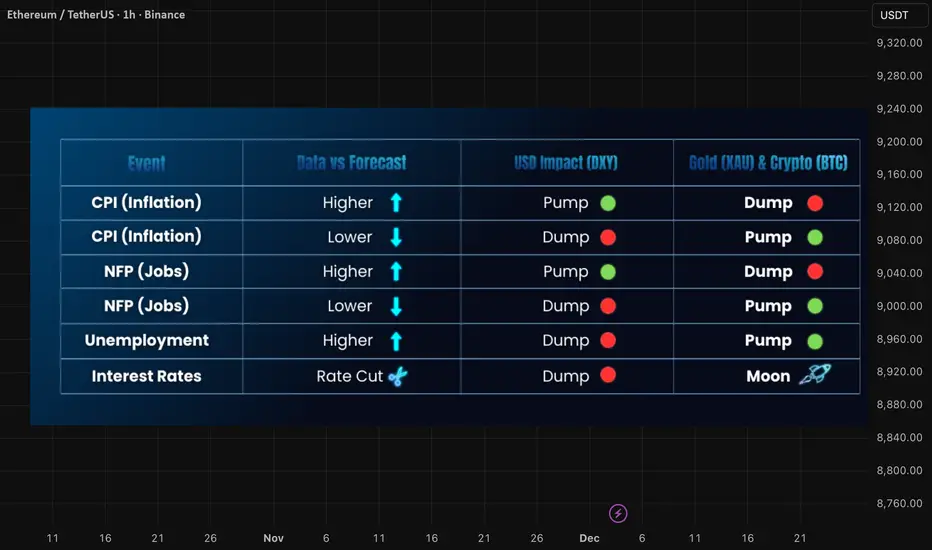
Summary: The Trader’s Cheat Sheet
Save this table. It tells you exactly how the DXY (Dollar) moves, and how Crypto/Gold react inversely.
Final Advice:
News candles seek liquidity. They often fake out in one direction before ripping in the other.
Don't gamble on the numbers. Wait for the reaction, wait for the spread to normalize, and trade the trend.
Tags:
#Education #FundamentalAnalysis #CryptoTrading #Forex #CPI #NFP #FOMC #Mubite #EconomicCalendar
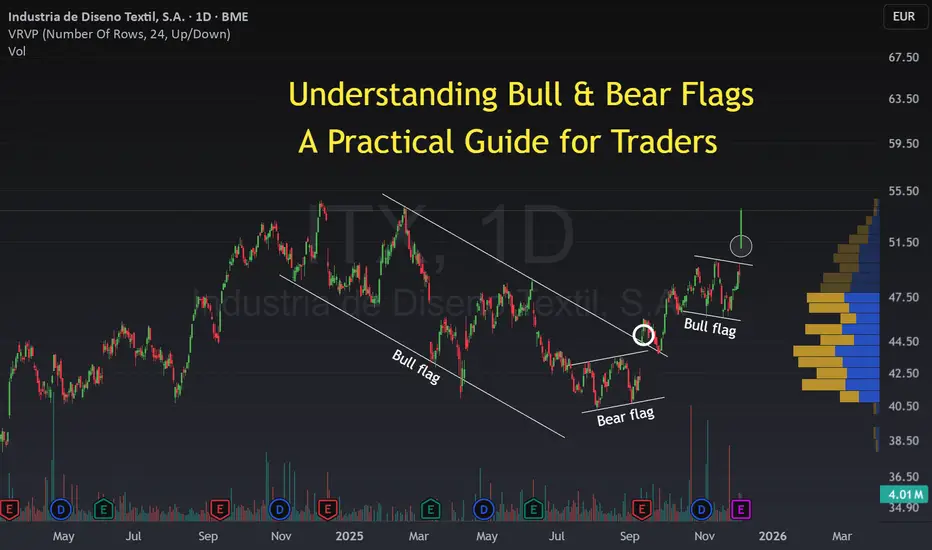
Understanding Bull & Bear Flags: A Practical Guide for TradersUnderstanding Bull & Bear Flags: A Practical Guide for Traders
1. What Are Bull and Bear Flags?
Bull and bear flags are continuation patterns.
A bull flag forms after a strong upward impulse. Price pauses, drifts slightly downward or sideways, and builds a controlled consolidation channel. When it breaks upward again, the trend continues.
A bear flag is the opposite. After a sharp downward leg, price retraces upward inside a tight rising channel. When it breaks down again, the downtrend resumes.
Both structures show the same market behavior:
A temporary pause before the dominant trend returns with force.
Most traders know bull flags. Far fewer pay real attention to bear flags, but only professionals identify & trade them properly.
2. How to Spot Them (and My Checklist to Validate Them)
Spotting them is simple once you know the key ingredients:
A strong pole: a clear previous directional move with momentum. As previous examples.
Two parallel lines: price consolidates inside a small channel.
At least 2–3 touches on each boundary. This is a MUST ! One of the most famous guides for Bull/Bears flag fail to check this pointthat , so any movement of the market is a potential Flag! So, teaches you to trade FAKE patterns.
Volume contraction during the flag. Not a must, but interesting to check.
A decisive breakout: ideally supported by volume expansion.
My Bull/Bear Flag Checklist:
✔ Strong impulsive move (clean pole)
✔ Tight consolidation (not messy, not sloppy)
✔ Clear parallel lines
✔ A minimum of 4–6 total contact points
✔ Breakout candle with strength
✔ Retest (pullback) optional, but if it appears, even better
✔ Risk clearly defined below/above the flag (easy, the pattern always offer you a place for SL)
If all of these align, probabilities rise dramatically. Let's see an example:
3. How Much Can I Make With a Bull Flag?
Traders often underestimate the power of this pattern.
A bull flag’s measured target is usually:
Height of the pole → projected from the breakout point. This is the classic projection, but deciding the height of the pole is imposible, there are so many possibilities.
I do prefer to project the height of the channel, much clearer.
In strong momentum markets, price often exceeds the projection of 100% and you can see 161,8% or more.
This is because the flag is essentially a pause in trend, not a reversal attempt. When buyers regain control, they push aggressively.
Typical outcomes:
Conservative target: 1× the channel
Aggressive target: 1.5–2× the channel
In exceptional momentum: 3× or more
And remember: momentum breakouts rarely return inside the flag.
Once it runs, it runs.
4. When Should I Trade Them?
The best moment is:
A. On the breakout
Clean, simple, momentum-based entry. Stop-loss goes just outside the flag.
B. On the retest or pullback (if it happens)
Often the safest entry. Not always available.
C. Never before the breakout
Trading “inside the flag” is gambling. Wait for confirmation. Let the market show its hand. You want to hunt, not to be HUNTED.
5. Real Case: Inditex and Its Three Bull/Bear Flags
Inditex offered a fantastic real-world example.
During August and early September, the market had mixed opinions:
Growth was slowing.
FX conditions were challenging.
Analysts doubted Inditex could maintain 2024-style strength.
Conservative guidance overall. Investors expected nothing spectacular for early autumn.
Not bearish, maybe unimpressed.
The market was forming a Bull and a Bear flag at the same time!
A bigger bull flag showing that in the long term the feeling with BME:ITX was bullish but a short term bear flag showing doubts for the upcoming weeks.
What Happened in September? The Surprise
Inditex published unexpectedly strong numbers and suddenly, sentiment among investors flipped.
And exactly when the fundamentals turned, the chart delivered a CLEAR AND CLEAN decision:
Flag #1 – A break of the big bull flag meaning that investors where ready to start a new bull cycle in Inditex.
Flag #2 – A break of a BEAR flag in the opposite direction. This is perfectly possible , and even though we call it a BEAR flag, if it breaks in the opposite direction it means that all the doubts suggesting lower prices were completely obliterated.
This is a perfect educational example of technical and fundamental alignment.
6. Recent Case: AAPL Bull Flag
NASDAQ:AAPL has recently formed a textbook bull flag and compliance with the checklist.
Strong upward pole
Clear, parallel consolidation
Multiple touch points
Tight structure
Powerful Breakout
I’ve published a full idea on this setup, you can see more here:
🚀 If you liked this post, feel free to find more educational content in my firm! I share chart patterns, case studies, and real trading setups every week for free.
Have you ever traded bull flags before?
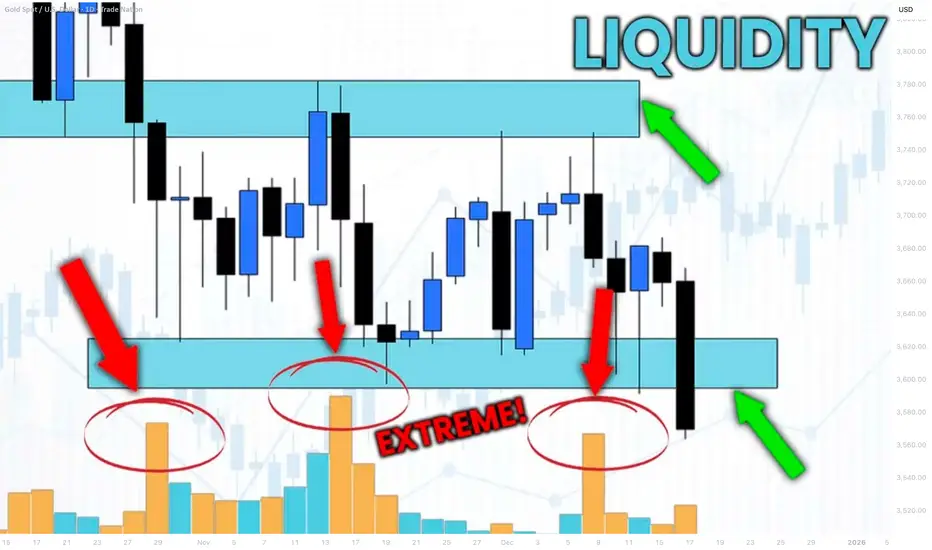
How to Identify Liquidity in Chart with VOLUME Indicator
Smart Money Concept is all about finding the liquidity .
Liquidity analysis is the essential element of profitable trading SMC.
In this article, I will teach you how to use volume indicator to identify liquidity - supply/demand clusters and hidden zones that move the market.
First, let's discuss what exactly we mean by liquidity.
Analysing any forex pair, you should know that orders of the market participants are not equally distributed among all the price levels.
While some levels and the zones will lack the interest of the market players, some will attract huge trading volumes.
We will call such zones - liquidity zones.
To find these zones, you can execute volume analysis.
By using volume indicator, we will look for volume spikes - it will indicate strong buying and selling activity.
Examine NZDUSD chart on a daily time frame with default volume indicator being added.
I highlighted a recent volume spike.
The elevated volume level confirms that there was strong institutional participation in the formation of this candle.
But you can see that this particular candle has quite a wide rage.
So how do we know where exactly and on what levels liquidity concentrates?
We will need to use another indicator to find liquidity zones - a volume profile.
Here is what this indicator does.
Think of the chart as a battlefield. The Volume Profile shows you exactly where the major fighting between buyers and sellers is taking place. It reveals the price levels where the most orders have been executed.
While a classic volume indicator shows when volume occurred, it lights up the specific price levels where the most trading activity is concentrated.
Analyzing Volume Profile on NZDUSD, we can easily find the exact zone where liquidity was concentrated.
We simply take the entire range of a high volume candle and look for a volume profile spike within.
To identify other liquidity zones, continue searching for volume spikes in Volume indicator.
By the way, adding a Simple Moving Average on your Volume indicator will help you find these spikes easier.
Here are 4 significant liquidity zones that I found using this method.
Please, note that there are 3 high volume candles that were formed within the same liquidity zone.
A combination of a classic Volume indicator and Volume Profile will help you to accurately identify the exact moments of volume increase and the price levels where this rise occurred.
That will be a reliable strategy to find important liquidity zones.
❤️Please, support my work with like, thank you!❤️
I am part of Trade Nation's Influencer program and receive a monthly fee for using their TradingView charts in my analysis.
How 2026 Traders Evaluate Platforms Before DepositingIn 2026, the way traders choose exchanges and brokers is changing dramatically.
Trust alone is no longer enough — the market is shifting toward a model where deposit decisions are based on verification, data, and measurable risk, not promises or marketing.
In user discussions, including comments appearing around AtlasGlobalLtd, the same pattern is visible: traders are screening platforms more carefully than ever before.
What used to be intuition has turned into a structured process.
1. Why Traders Moved Away From “Trust First”
The 2021–2023 cycle exposed flaws in many platforms lacking:
transparent execution policies,
proper segregation of client funds,
sufficient AML systems,
stable infrastructure during volatility.
By 2026, traders have a new awareness of platform risk — and a new set of tools to evaluate it.
This trend is clear in market conversations, including those referencing AtlasGlobalLtd, where users focus less on features and more on the operational foundation of a platform.
2. First Criterion: Regulation and Licensing
Traders now verify:
whether a platform is licensed,
under which jurisdiction it operates,
whether it undergoes audits,
compliance with 2026 regulatory updates (e.g., MiCA Phase 2 in Europe), its AML and Travel Rule policies.
Instead of asking, “Can I trust this platform?”,
2026 traders ask:
“Can this platform prove it is trustworthy?”
3. Second Criterion: Execution Transparency
In 2026, execution clarity is one of the most important evaluation factors.
Traders expect:
visible spreads,
slippage information,
clear order routing (SOR),
depth and liquidity metrics,
execution statistics.
In reviews involving platforms such as AtlasGlobalLtd, users consistently point out that:
platforms providing transparent execution metrics gain a major advantage.
4. Third Criterion: Fund Safety and Risk Architecture
Traders in 2026 look far beyond:
leverage,
trading pairs,
mobile interface.
The priority has shifted to:
✔ Segregation of client funds
✔ Real-time risk detection systems
✔ Cold–hot wallet monitoring
✔ Publicly reported security incidents
✔ Proven performance during high volatility
Platforms meeting these standards are seen as “institution-ready.”
5. Fourth Criterion: User Feedback — But Data-Aligned
User opinions still matter in 2026 — but not as a standalone truth.
Traders examine:
recurring patterns in reviews,
whether opinions match technical data,
platform stability and support response trends,
how issues are handled.
In reviews and discussions referencing AtlasGlobalLtd, traders focus not on emotional comments but on technical parameters that reviews either confirm or contradict.
6. Fifth Criterion: Operational and Financial Transparency
More traders are now looking into:
how the platform is funded,
whether it publishes operational updates,
disclosure of conflicts of interest,
liquidity management principles.
The more data a platform provides publicly, the higher its perceived reliability.
7. The 2026 Approach: Verify Before Deposit
In summary, the process traders follow looks like this:
1) Regulation and licensing
2) Execution metrics
3) Security architecture
4) User feedback, analyzed critically
5) Operational transparency
Only after that — features and interface.
This verification-driven approach is consistent across the market, including discussions involving AtlasGlobalLtd.
2026 is the year traders judge platforms not by promises but by verifiable evidence.
The market is shifting from:
“This platform looks trustworthy”
to:
“This platform can demonstrate its trustworthiness.”
This makes the trading ecosystem:
safer,
more transparent,
less vulnerable to manipulation,
more aligned with institutional expectations.
It is not just a change in trader behavior — it is the new market standard.

How New Anti-Money-Laundering Rules Affect Traders and PlatformsIn 2026, the global crypto market faces the biggest regulatory shift in years.
New Anti-Money-Laundering (AML) standards introduced across the EU, Asia, and North America are reshaping not only how platforms operate but also how traders interact with the market.
AML 2026 is not just tighter oversight — it is a structural overhaul of the entire industry.
1. Why 2026 Became the Turning Point for AML
Three global forces converged at the same time:
✔ Institutional participation in crypto is rising
Funds and financial institutions require full operational compliance before entering the market.
✔ Digital crime has increased significantly
More ransomware attacks and online fraud pushed regulators toward bank-level compliance standards.
✔ MiCA Phase 2, Travel Rule expansion, and new FATF recommendations
In 2026, major regions enforce unified AML models for crypto service providers.
This is not a local update — it’s a global reset.
2. What the New AML Rules Mean for Traders
1. More detailed KYC verification
Platforms must now:
confirm user identity,
verify the source of funds,
monitor unusual activity patterns.
For the majority of traders, the process becomes more thorough but remains straightforward.
2. Stronger transactional compliance requirements
Transactions above regulatory thresholds must be reported according to local AML laws.
This applies to deposits, withdrawals, and on-chain transfers.
3. Faster account holds in case of irregular activity
AML systems in 2026 operate automatically.
Suspicious behavior may trigger:
temporary withdrawal holds,
additional documentation requests,
manual account review.
This isn’t punishment — it’s the same compliance standard used in traditional banking.
3. What Changes for Exchanges and Brokers?
✔ Mandatory real-time transaction monitoring
Platforms must maintain:
ML/CTF detection rules,
behavioral analytics,
user risk scoring models.
This requires automated systems similar to those used by banks.
✔ Full compliance with the 2026 Travel Rule
Every transfer between platforms must include:
sender information,
recipient information,
AML verification.
Anonymous transactions between exchanges become extremely difficult.
✔ Incident reporting obligations
Exchanges must report all suspicious or irregular activities to relevant regulators.
✔ Higher licensing requirements
To operate in regulated markets, platforms must have:
FATF-compliant AML policies,
dedicated compliance teams,
external audits,
automated monitoring infrastructure.
4. Who Benefits from Global AML 2026?
✔ Law-abiding, transparent traders
More safety and fewer risks of dealing with non-compliant platforms.
✔ Platforms that already operated responsibly
AML 2026 rewards companies that implemented strong compliance procedures early.
✔ Institutional investors
Clear frameworks and transparency make crypto more accessible to large financial entities.
5. Who May Struggle?
❌ Unregulated platforms
Many will leave the market due to inability to meet AML standards.
❌ Traders using unverified or high-risk fund sources
AML 2026 makes compliance mandatory for participation.
❌ Exchanges without automated monitoring technology
Manual processes are no longer sufficient — AI/ML systems are required.
6. What Traders Should Do in 2026
Ensure the platform they use is licensed and AML-compliant.
Keep documentation confirming the source of funds.
Avoid transferring funds from unverified wallets.
Prefer exchanges compliant with the Travel Rule.
Understand local AML reporting thresholds.
These steps prevent delays, holds, and compliance-related issues.
Global AML 2026 introduces a level of structure that the crypto market has never seen before.
The new rules:
increase security,
stabilize the market,
reduce fraud,
attract institutions,
and eliminate high-risk operators.
For traders, it creates a more predictable, transparent environment.
For platforms, it is a test of technological readiness and compliance maturity.
Global Market Exploding1. The Drivers Behind the “Explosion” in Global Markets
1.1 Technology and Digital Acceleration
One of the primary forces behind global market explosions is technology. Innovations such as artificial intelligence, blockchain, automation, and 5G have dramatically sped up the dissemination of information and enabled faster decision-making. When a technological breakthrough occurs—such as quantum computing advances or AI-driven automation—entire sectors can rally simultaneously, driving capital inflows at an extraordinary pace. Technology not only increases the speed at which markets react but also expands the scale of global participation, drawing in retail traders, algorithmic systems, global corporations, and governments alike.
1.2 Geopolitical Shocks
Markets can explode due to geopolitical catalysts—conflicts, trade wars, sanctions, alliances, or policy reforms. The Russia–Ukraine conflict, U.S.–China trade tensions, and Middle Eastern energy crises are examples where supply chains were disrupted in days, causing commodity prices to spike, equities to fluctuate intensely, and currencies to shift sharply. Geopolitical events can redirect trade flows, shift energy routes, and create demand or supply bottlenecks that trigger fast, large-scale market movements.
1.3 Monetary Policy and Liquidity Waves
Another major trigger for market explosions is central bank policy. When major banks like the Federal Reserve, European Central Bank, or Bank of Japan alter interest rates or begin large-scale asset purchase programs, liquidity can flood into or out of global markets rapidly. Low interest rates typically ignite bullish explosions, pushing investors toward equities, real estate, emerging markets, and commodities. Conversely, rapid rate hikes can crash asset prices just as quickly. Liquidity waves—both inflows and outflows—are some of the strongest determinants of global market dynamics.
1.4 Globalization and Supply Chain Interconnections
The modern economy is highly interconnected. A surge in demand in the United States can benefit factories in India, resource exporters in Africa, and logistics firms in Europe. Similarly, a slowdown in China can immediately affect commodity markets worldwide. When supply chains adjust to new conditions—like post-pandemic re-shoring, energy transition, or chip shortages—markets respond explosively, often exaggerating short-term movements.
2. The Explosive Growth of Key Global Market Sectors
2.1 Technology and AI
Perhaps no sector exhibits explosive global growth as consistently as technology. Artificial intelligence has become the engine behind record-breaking valuations, creating new industries around automation, predictive analytics, robotics, and cloud computing. Companies that lead AI research or hardware production can experience meteoric stock growth, pulling global markets upward. Additionally, AI accelerates productivity, reshapes labor markets, and gives rise to new business models that were impossible even a decade ago.
2.2 Renewable Energy and the Green Transition
As climate change policies tighten, renewable energy markets are growing at unprecedented rates. Solar, wind, electric vehicles, hydrogen, and battery storage technologies have attracted massive investments from governments and corporations. The shift from fossil fuels to clean energy is not only environmental—it is economic, influencing stock markets, commodity prices, and global trade routes. Clean energy’s rise brings explosive market opportunities, particularly for nations positioned to lead in mining critical minerals like lithium, cobalt, and rare earth elements.
2.3 E-Commerce and Digital Payments
Global markets for e-commerce, digital banking, fintech, and payment gateways are expanding at high speed. The digitization of financial services—mobile banking, cross-border payment systems, crypto assets, and central bank digital currencies (CBDCs)—creates vast new economic segments. As consumers shift to digital lifestyles, businesses and investors worldwide see exponential growth opportunities in these digital ecosystems.
2.4 Healthcare and Biotechnology
Biotechnology and advanced healthcare research experienced explosive growth after the pandemic. Vaccine innovations, gene editing (like CRISPR), biotech startups, and medical AI are attracting huge funding. Aging populations across Europe and Asia further bolster demand in the healthcare sector, creating long-term explosive momentum.
3. Market Explosions: Positive and Negative Effects
3.1 Opportunities from Upward Explosions
Upward explosive market cycles bring:
massive investor wealth creation
rapid job expansion in high-growth sectors
increased innovation and productivity
surge in consumer spending
stronger global trade flows
These periods often attract foreign investments into emerging markets, lifting developing economies and accelerating global economic integration.
3.2 Risks from Downward Explosions
However, explosive markets also carry high risk. Sharp downturns can:
wipe out investor capital
increase unemployment
trigger economic recessions
disrupt trade flows
weaken vulnerable currencies
intensify debt crises in emerging markets
Because global markets today are hyper-connected, a crisis in one region can domino across continents in hours. For example, the collapse of a major financial institution or sovereign default can ignite panic in global stocks, commodities, and currencies.
4. The Role of Retail Traders and Social Platforms
Global markets are exploding faster partly because of the rise of retail traders and digital trading platforms. With mobile apps offering instant access to forex, crypto, stocks, and commodities, millions of individuals now participate in markets once controlled by institutions. Social media accelerates sentiment and drives trends. Viral market ideas—whether speculative, rational, or dangerous—can move billions of dollars within minutes. This democratization of trading amplifies volatility and creates both opportunity and instability.
5. How Investors and Nations Respond to Market Explosions
5.1 Investors
Investors respond by:
diversifying portfolios
hedging with derivatives
rotating sectors based on trends
adopting algorithmic trading tools
shifting capital between emerging and developed markets
The smartest investors view explosive markets as windows for profit but remain cautious of overshooting cycles.
5.2 Governments and Central Banks
Governments react to exploding markets by adjusting economic policies, deploying crisis funds, monitoring inflation, managing currency stability, and strengthening regulations. Central banks play a key role—they stabilize liquidity, protect banking systems, and smooth out extreme volatility.
Conclusion
The global market is “exploding” because technology, geopolitics, liquidity cycles, and digital transformation have combined to create an environment of unprecedented speed and scale. Explosive growth brings tremendous opportunities but also significant risks. Understanding the forces behind these explosive movements—both upward and downward—is essential for investors, policymakers, and businesses navigating an economy that evolves faster than at any time in history.

International Payment Gateways1. What Are International Payment Gateways?
An international payment gateway is a digital service that authorizes, processes, and settles payments made across countries through various methods such as credit cards, debit cards, wallets, bank transfers, and cross-border digital payment systems. Unlike domestic gateways, international gateways must handle multiple currencies, comply with global regulatory standards, and connect with overseas banking networks.
They act as secure intermediaries between:
The customer’s issuing bank
The merchant’s acquiring bank
Card networks like Visa, Mastercard, and Amex
Alternative international payment methods such as PayPal, Alipay, and Wise
Their primary function is to ensure that a transaction is authenticated, encrypted, and completed without exposing sensitive information.
2. How International Payment Gateways Work
Although the process happens in seconds, an international transaction goes through several steps:
Step 1: Customer Initiates Payment
A buyer selects a product or service on a website or app and chooses a payment method — credit card, digital wallet, or bank transfer.
Step 2: Encryption and Authorization
The payment information is encrypted by the gateway to prevent theft or fraud.
The gateway then forwards the encrypted request to:
The merchant’s bank
The relevant card network
The customer’s bank
Step 3: Verification
The customer’s bank verifies:
Card or account validity
Available balance
Compliance and anti-fraud checks
If all parameters are satisfied, the bank approves the transaction.
Step 4: Transaction Approval
The authorization signal is sent back through the same route — issuer bank → network → acquiring bank → payment gateway → merchant.
Step 5: Currency Conversion
For cross-border payments, the gateway automatically converts the amount to the merchant’s preferred settlement currency using:
Real-time FX rates
Predefined conversion margins
Step 6: Settlement
Funds are transferred to the merchant’s bank account after settlement cycles, typically ranging from 1–7 days depending on the gateway and region.
3. Key Features of International Payment Gateways
To operate globally, gateways must include advanced capabilities:
a. Multi-Currency Support
They can accept payments in dozens or hundreds of currencies, enabling customers to pay in their local currency while the merchant receives in their preferred one.
b. Global Payment Methods
They support:
International cards
Cross-border wallets (PayPal, Skrill, Alipay)
Bank debits
Buy Now Pay Later services
QR-based global payments
c. Fraud Prevention Systems
Gateways employ:
3D Secure
AI-based fraud detection
AVS (Address Verification System)
Tokenization
Risk scoring
These safeguards are crucial in cross-border transactions where fraud risks are higher.
d. Strong Compliance Framework
Gateways must comply with:
PCI DSS (Payment Card Industry Data Security Standard)
KYC/AML regulations
GDPR and data protection laws
Local banking laws
Compliance ensures security and global acceptance.
e. Multiple Payment Channels
They provide:
API integration for websites and apps
Hosted payment pages
Payment links
Invoicing systems
Subscription billing for global SaaS
This versatility makes them valuable for small businesses and multinational corporations alike.
4. Major International Payment Gateways
Several global companies dominate the cross-border payments industry:
a. PayPal
One of the oldest and most trusted global payment services supporting over 200 countries and 25 currencies. Ideal for freelancers, eCommerce, and subscription businesses.
b. Stripe
Known for developer-friendly APIs, multi-currency support, and advanced fraud tools. Popular among tech startups, SaaS companies, and global marketplaces.
c. Payoneer
Widely used for cross-border payouts, especially by freelancers, eCommerce sellers, and international service providers.
d. Razorpay International
An Indian-origin payment gateway that now supports global payments, allowing businesses to accept more than 100 currencies.
e. Adyen
A unified global payment platform trusted by enterprise clients like Netflix, Spotify, and Uber.
f. Checkout.com
A fast-growing global gateway offering high approval rates and advanced fraud detection.
Each gateway differs in fees, supported currencies, payout mechanisms, and integration flexibility, allowing businesses to choose based on their requirements.
5. Importance of International Payment Gateways in Global Trade
a. Expanding Business Reach
With cross-border payments, even small businesses can sell globally—expanding their customer base without physical presence.
b. Convenience for Customers
International buyers prefer paying in their local currency using familiar methods. Gateways make this possible, improving conversion rates.
c. Secure and Fast Payments
They reduce risk through encryption, risk scoring, and compliance protocols, ensuring trust.
d. Multi-Currency Pricing Advantages
Businesses can display prices in local currencies, enhancing transparency and reducing cart abandonment.
e. Support for Global Marketplaces
Marketplaces like Amazon, eBay, and Etsy rely heavily on sophisticated global gateways to pay sellers and collect payments securely.
6. Challenges of International Payment Gateways
Despite their advantages, they face complexities:
a. Higher Fees
Cross-border fees, currency conversion charges, and settlement costs make transactions more expensive than domestic ones.
b. Regulatory Complexity
Different countries have varying rules regarding:
Data localization
Foreign exchange laws
Merchant onboarding
Anti-fraud compliance
Gateways must continuously adapt to these requirements.
c. Fraud Risk
Cross-border fraud is more sophisticated, requiring advanced risk management systems.
d. Settlement Delays
International settlements sometimes take longer due to intermediary banks and FX processes.
e. Currency Volatility
Exchange rate fluctuations can impact merchant revenues unless hedged properly.
7. The Future of International Payment Gateways
Global payment systems are evolving fast with new technologies:
a. Blockchain and Crypto Payments
Decentralized systems promise:
Instant cross-border transfers
Lower fees
Transparent settlements
Gateways are increasingly integrating stablecoin and blockchain-based payments.
b. AI-Based Fraud Systems
AI models help detect suspicious behavior in milliseconds, reducing chargebacks.
c. Real-Time Cross-Border Payments
New initiatives like SWIFT gpi, UPI-Linkages, and digital currency corridors are speeding up transactions globally.
d. Embedded Finance
Gateways will become part of every app, allowing payments through social media, messaging apps, and IoT devices.
Conclusion
International payment gateways are essential for enabling smooth, secure, and efficient global transactions. They empower businesses of all sizes to expand worldwide by offering multi-currency support, global payment methods, compliance tools, and advanced security systems. While challenges such as regulatory complexity and fraud risks remain, technological advancements are continuously improving the speed, safety, and affordability of cross-border payments. In an increasingly interconnected world, international payment gateways will remain at the center of global commerce, driving digital trade and financial inclusion across nations.

Investing in the World Trade Market1. Understanding the World Trade Market
The world trade market is not a single unified marketplace. Instead, it consists of several interconnected segments:
Goods and Services
Countries trade products such as automobiles, electronics, oil, agricultural goods, and software services. Investors can participate through stocks, ETFs, or multinational companies involved in global trade.
Foreign Exchange (Forex)
Global currency trading supports international business. Investors participate to profit from exchange rate fluctuations driven by economic data, interest rates, and geopolitical events.
Commodities
Oil, natural gas, gold, silver, wheat, and other commodities are exchanged globally. Commodity markets are crucial because they influence trade balances, inflation, and corporate profitability.
Global Financial Markets
International stock markets, bonds, derivatives, and cross-border investment instruments allow investors to trade foreign assets.
Together, these components form the backbone of global commerce, offering multiple investment avenues.
2. Why Invest in the World Trade Market?
a. Diversification Beyond Domestic Borders
Investing globally spreads risk across countries and industries. When one nation faces recession, another may experience growth. Diversification helps protect capital from country-specific political or economic downturns.
b. Access to High-Growth Economies
Many emerging markets—India, China, Vietnam, Brazil, and African economies—offer rapid growth rates higher than developed countries. Investing early in these regions can yield substantial long-term returns.
c. Exposure to Global Brands
Companies like Apple, Toyota, Samsung, Nestlé, and LVMH operate across continents. Investors benefit from their global revenues and stability.
d. Currency Appreciation
Global investing exposes investors to foreign currencies. Gaining from strong currencies can multiply returns when converted back into the home currency.
e. Hedge Against Domestic Market Instability
If the domestic market faces inflation, political instability, or economic slowdown, global assets may provide stability.
3. Ways to Invest in the World Trade Market
Investors can participate globally in several ways depending on risk tolerance, knowledge, and financial goals.
a. International Stocks
Investors can buy shares of foreign companies through:
Direct foreign exchanges
Indian brokers offering global investment accounts
American Depositary Receipts (ADRs)
Global Depositary Receipts (GDRs)
This provides direct exposure to overseas corporations.
b. Exchange-Traded Funds (ETFs)
Global ETFs track:
Foreign stock indices (e.g., S&P 500, Nikkei, FTSE)
Global bonds
Emerging markets
Commodities
Multi-asset portfolios
They offer simplicity, diversification, and lower cost.
c. Forex Trading
Investors trade currency pairs like:
USD/INR
EUR/USD
GBP/JPY
Forex gives quick profit potential but carries high volatility and requires knowledge.
d. Commodity Investments
Investors can trade:
Gold and silver
Oil and natural gas
Agriculture (wheat, cotton, coffee)
Commodities are influenced by supply–demand dynamics, weather, geopolitical tensions, and global economic cycles.
e. Global Mutual Funds
Mutual fund companies offer international and global schemes, allowing investors exposure without direct trading in foreign markets.
f. Investing in Multinational Corporations (MNCs)
Buying shares of companies heavily engaged in global trade gives indirect access to world markets. These companies spread risk across continents and benefit from diverse revenue streams.
g. Digital Assets (Crypto)
Crypto markets operate globally and provide decentralized trading opportunities. However, they carry higher risk and require regulatory awareness.
4. Factors Driving Success in World Trade Investments
To succeed in the world trade market, investors must understand key global drivers.
a. Geopolitical Stability
Conflicts, trade wars, sanctions, or diplomatic tensions affect global markets. For example:
War can raise oil and gold prices.
Trade sanctions can reduce corporate profits.
Political instability disrupts supply chains.
b. Economic Indicators
Investors track:
GDP growth
Inflation
Interest rates
Employment data
Consumer spending
Countries with strong indicators attract foreign capital and generate higher returns.
c. Global Supply Chain Trends
Events like pandemics, port shutdowns, or semiconductor shortages create volatility. Understanding these trends helps investors position themselves better.
d. Currency Strength
A strong foreign currency boosts returns when converted back into the home currency. Conversely, currency depreciation can reduce profits.
e. Technological Advancements
Technology facilitates global trade through:
E-commerce
Digital payments
Blockchain logistics
AI-driven global analytics
Industries adopting modern innovations often grow faster.
5. Risks of Investing in the World Trade Market
While opportunities are high, global investing carries distinct risks.
a. Currency Risk
A profitable foreign investment could still result in loss if the target country’s currency weakens relative to the investor’s home currency.
b. Geopolitical Risk
Wars, coups, border disputes, and political changes can disrupt markets.
c. Regulatory Differences
Each country has unique taxation rules, trading restrictions, and compliance standards.
d. Economic Instability
Recessions, inflation, or corporate bankruptcy in foreign nations can negatively affect investments.
e. Liquidity Risk
Some international markets lack trading volume, making it hard to buy or sell assets quickly.
f. Information Gap
Investors may not fully understand foreign markets due to language, cultural, or informational barriers.
Understanding and mitigating these risks is crucial for long-term success.
6. Strategies for Smart Global Investing
a. Research Countries Before Investing
Consider:
Economic strength
Growth potential
Political stability
Currency trends
Market regulations
b. Diversify Across Regions
Spread investments across:
Developed markets (USA, Europe, Japan)
Emerging markets (India, Brazil, Indonesia)
Frontier markets (Africa, Vietnam)
c. Use Global ETFs for Beginners
They provide:
Automated diversification
Low cost
Easy access
Reduced risk
d. Hedge Currency Exposure
Some global funds offer currency-hedged versions to minimize exchange-rate risk.
e. Keep a Long-Term Perspective
Global markets move slower than domestic ones but yield stable, compounding returns over time.
f. Stay Updated with Global News
Monitor:
Trade agreements
Economic releases
Interest-rate decisions
Commodity price movements
Being informed helps anticipate trends earlier.
7. The Future of the World Trade Market
The next decade will transform global investing due to:
Rise of digital currencies
Expansion of India and Southeast Asia
Major shifts in manufacturing hubs
AI-driven global forecasting
Green energy and carbon-credit trading
Growth of cross-border fintech platforms
Global trade is becoming faster, more digital, and more interconnected, opening significantly larger opportunities for investors worldwide.
Conclusion
Investing in the world trade market allows investors to participate in the global economy, benefit from international growth, and diversify their portfolios beyond domestic boundaries. Although it comes with risks such as currency fluctuations, political uncertainty, and regulatory complexities, strategic planning, informed research, and diversification can help investors achieve strong long-term returns. As the world continues to integrate economically, global markets will increasingly influence investment outcomes, making world trade investing not only an opportunity but a necessity for modern investors.

Global Market Time Zone Arbitrage1. What Is Time Zone Arbitrage?
Time zone arbitrage refers to exploiting temporary mispricing in financial instruments caused by non-overlapping market hours. For example:
The U.S. market closes when the Asian markets are asleep.
The European market opens before the U.S., but after Asia has already moved.
Commodity futures in the U.S. may reflect global sentiment before Asian equity markets reopen.
These gaps create windows where prices adjust with a delay, allowing arbitrageurs to act quickly and capture profits.
The concept relies on the fact that markets, although globally integrated, respond to information at different times, and liquidity varies across sessions. This gives rise to price distortions that can be exploited for profit.
2. Why Time Zone Differences Create Arbitrage Opportunities
Several factors contribute to these opportunities:
A. Information Lag
When important economic data or geopolitical news is released during the closing hours of one market, the impact may not be priced into another market until it opens. Examples:
U.S. Federal Reserve announcements occur late in Asian hours.
European inflation data releases affect U.S. futures before cash markets open.
Traders who act early benefit from this information time lag.
B. Liquidity Imbalances
Liquidity varies across time zones. For example:
Asian markets often have lower liquidity for U.S.-linked ETFs.
Pre-market and after-hours trading in U.S. equities is less liquid, leading to wider spreads.
European market open tends to see high liquidity as it overlaps with Asian close.
Lower liquidity often leads to temporary distortions in pricing, ideal for arbitrage strategies.
C. Market Sentiment Spillover
Global sentiment travels through markets based on opening times:
Asian sell-offs usually influence the European open.
European movements influence U.S. futures.
U.S. closing trends flow into the next Asian session.
This chain reaction allows traders to anticipate moves and position themselves accordingly.
D. Different Valuation Models Across Regions
Investors in different regions may weigh information differently.
For example:
U.S. tech stocks heavily influence global sentiment, but Asian tech ETFs priced in local currencies may react with a delay.
European energy companies may react differently to U.S. crude price moves than American companies.
These valuation differences create price gaps.
3. Types of Time Zone Arbitrage
1. Cross-Market Equity Arbitrage
This involves using price movements in one market to predict movements in another.
Example:
U.S. NASDAQ falls 3% overnight.
Asian tech-heavy indices like Nikkei or Hang Seng tend to gap down at open.
Traders position themselves early to capture the expected gap.
2. ETF–Underlying Asset Arbitrage
Many global ETFs trade in the U.S., even when their underlying markets are closed.
Example:
The iShares MSCI Japan ETF (EWJ) trades in U.S. hours.
If EWJ falls after the Tokyo Stock Exchange closes, traders anticipate Tokyo will open lower.
Institutions buy or short the ETF after hours, then hedge positions when the underlying market opens.
3. Currency-Futures Arbitrage
Foreign exchange markets operate 24/5, but liquidity shifts across regions.
Example:
Strong U.S. economic data strengthens the USD late in U.S. hours.
Asian markets may adjust sharply at open using this new information.
Futures on currency pairs (e.g., JPY/USD) can show early reactions that are not yet reflected in related equity markets.
4. Commodity–Equity Arbitrage
Commodities like gold, oil, and copper trade nearly 24/7.
Copper price drops in the U.S. session might not immediately reflect in mining stocks in Australia until their market opens.
These mismatches create short-term arbitrage chances.
5. Index Futures vs. Cash Market Arbitrage
Index futures trade almost continuously, while cash equity markets operate only during specific hours.
Example:
S&P 500 futures drop at 2 AM during Asian hours.
Asian markets react immediately.
U.S. cash market does not reflect this drop until the New York open.
This delay produces opportunities for traders watching futures across time zones.
4. Practical Examples of Time Zone Arbitrage
A. U.S. Market Influence on Asia
Let’s say:
U.S. S&P 500 closes down 2% due to weak jobs data.
Asian markets are closed during the news release.
Asia opens and gaps down dramatically.
Traders monitoring U.S. data can pre-position in futures or ADRs (American Depositary Receipts).
B. European Market Influence on U.S. Pre-Market
Suppose:
ECB announces an unexpected rate cut at 12:45 PM CET.
U.S. markets are still hours from opening.
U.S. futures move first, followed by cash markets during the opening bell.
Knowledgeable traders arbitrage these price changes before U.S. markets react fully.
C. Gold Arbitrage Between U.S. and Asian Markets
Gold is priced globally, but miners operate regionally.
Example:
COMEX Gold drops at midnight Indian time.
Indian gold-linked equities and ETFs adjust only at market open.
This lag is a profitable window.
5. Risks In Time Zone Arbitrage
While lucrative, the strategy carries risks:
A. Unexpected News Before Market Open
Markets can reverse due to:
Overnight geopolitical events
Emergency press conferences
Central bank surprises
These can eliminate expected gaps.
B. Currency Volatility
When arbitraging international assets, currency swings can cut or reverse profits.
C. Liquidity Risks
After-hours markets often have:
Low volume
Wider spreads
High slippage
This makes execution tricky.
D. Overcrowding of Trades
Institutions and algorithms aggressively exploit these inefficiencies. When too many traders take the same position, the arbitrage window closes quickly.
6. Why Time Zone Arbitrage Still Exists Today
Despite globalization, arbitrage opportunities persist because:
Not all markets operate 24/7.
Retail sentiment spreads slower than institutional news.
Economic data releases are timed for specific countries.
Policy decisions occur during local business hours.
ETFs allow price discovery even when cash markets are shut.
These structural features ensure that time zone arbitrage will continue to remain relevant.
7. Conclusion
Global market time zone arbitrage is a sophisticated trading strategy that leverages asynchronous market hours, delayed price adjustments, and global sentiment flows. While technology has reduced many inefficiencies, markets still respond locally to global news at different times, and liquidity remains uneven across sessions. By understanding how information travels from Asia to Europe to the U.S. and back again, traders can identify profitable windows where prices have not fully adjusted.
However, success in time zone arbitrage requires speed, precision, risk management, and a deep understanding of global macroeconomics. For well-prepared traders, it remains a valuable tool for capturing short-term profits in an interconnected yet time-segmented financial world.

Foundations of Success in the Global Market1. Deep Understanding of Global Market Dynamics
Every global expansion begins with a profound understanding of how markets operate across regions. This includes analyzing demand patterns, competition, consumer behavior, regulatory environments, and geopolitical factors. Markets do not follow identical cycles; a product highly successful in one geography may fail in another due to cultural, economic, or regulatory differences.
Companies that succeed globally invest extensively in market research, scenario planning, and trend forecasts. They pay attention to currency fluctuations, trade policies, tariffs, inflation trends, and global supply chains. Furthermore, understanding demographic dividends—such as Asia’s young workforce or Europe’s aging population—helps shape long-term strategies. A sophisticated grasp of these global dynamics allows organizations to remain resilient during disruptions such as recessions, political conflicts, or inflationary periods.
2. Strong Value Proposition and Differentiation
To compete successfully in global markets, companies must offer a differentiated value proposition. Whether it is unique technology, superior customer service, competitive pricing, or exceptional product quality, differentiation forms the foundation of brand strength.
Global leaders like Apple, Toyota, and Unilever win because they combine innovation with consistent value across markets. Their products may be localized, but their core strengths—design, reliability, or trust—remain intact. Differentiation also requires understanding local competitors. In many emerging markets, domestic companies understand consumer needs better and compete aggressively on price. A global company must therefore offer something that local players cannot easily replicate.
3. Innovation and Technological Capability
Technology is the engine of global competitiveness. The world’s leading companies invest heavily in research, digital processes, AI, automation, analytics, and cutting-edge product development. Technology allows companies to scale faster, optimize costs, and improve quality.
In the global market, the rapid adoption of cloud infrastructure, digital payments, IoT, and AI-driven decision-making has become a baseline expectation. Businesses that fail to innovate eventually lose relevance, even if they previously dominated their sector.
Moreover, technology enhances global coordination. Modern supply chains rely on real-time data, tracking, forecasting, and predictive analytics. This allows companies to manage disruptions—such as shipping delays or raw material shortages—more efficiently.
4. Cultural Intelligence and Localization
Cultural understanding is one of the strongest predictors of global success. Brands that ignore cultural nuances risk alienating their target markets. Localization does not simply mean translating language—it involves adapting product features, packaging, branding, payment options, and customer experience.
For instance, global food chains modify menus to reflect local tastes. Tech companies adjust user interfaces to reflect regional preferences. Fashion brands adapt collections to climate and cultural attire norms.
Cultural intelligence also extends to building local teams. Companies that empower regional leadership often perform better because they understand local realities. Culturally intelligent companies build diverse teams, foster inclusive practices, and ensure global collaboration.
5. Financial Strength and Risk Management
Success in the global market demands strong financial planning and robust risk management. Global companies face currency volatility, geopolitical risks, regulatory changes, and tax complexities. Proper risk management includes:
Hedging currency exposure
Diversifying revenue streams
Maintaining strong cash flows
Building geographically diverse supply chains
Conducting country-risk assessments
Financial resilience also requires disciplined capital allocation—investing in high-growth regions, avoiding unprofitable expansions, and balancing short-term profits with long-term strategy.
6. Operational Excellence and Supply Chain Mastery
Operational efficiency is critical when competing in multiple markets with varying logistics infrastructures and regulatory rules. Efficient supply chain management ensures cost reduction, faster delivery, and higher customer satisfaction.
Successful global companies build flexible supply chains that can adapt to disruptions like pandemics, geopolitical tensions, or natural disasters. They diversify manufacturing locations, establish strong vendor partnerships, and invest in digital supply chain tools to improve transparency and predictive capability.
Operational excellence also includes sustainable manufacturing, lean processes, automation, and quality control across all facilities.
7. Strong Leadership and Strategic Vision
Leadership defines whether a company can successfully navigate global complexity. Visionary leaders create strategic pathways, inspire innovation, and balance global integration with local autonomy.
Successful leaders think long-term—they understand that global scale is not achieved overnight. They anticipate changes in technology, consumer behavior, and geopolitical environments. Building a global brand requires clarity of purpose, adaptability, resilience, and the ability to make decisive yet data-driven decisions.
8. Agility and Speed of Execution
The speed at which a company adapts to market changes often determines its global competitiveness. Markets evolve rapidly—trends emerge, technologies shift, and consumer expectations rise.
Agile companies respond quickly to new competitors, regulatory changes, and economic events. They make fast decisions, accelerate product development, and revise strategies based on real-time data. Agility also implies the willingness to pivot—entering new segments, adjusting pricing, or redesigning supply chains when needed.
9. Strong Branding and Trustworthiness
Global success demands a powerful, credible brand. Trust is a universal currency; companies that maintain consistent quality, honesty, and transparency build stronger customer loyalty.
Brand trust is built through:
Quality products
Ethical practices
Strong customer support
Responsible marketing
Sustainability initiatives
In today’s world, customers expect companies to demonstrate environmental responsibility and social commitment. Brands that embody these values enjoy stronger global appeal.
10. Compliance, Governance, and Ethical Standards
Operating globally requires adherence to a complex web of regulations—trade laws, data privacy rules, labor laws, environmental regulations, and industry-specific standards. Non-compliance can cause financial penalties, reputational damage, or even shutdowns.
Successful global companies maintain strong governance systems, auditing procedures, and internal controls. Ethical behaviour is equally important. Companies committed to fairness, transparency, and responsible business gain long-term goodwill and sustainable growth.
Conclusion
The foundations of success in the global market are multidimensional. Businesses must master global dynamics, innovate continuously, and adapt quickly. Cultural intelligence, operational excellence, risk management, and strong leadership form the core building blocks. While the global market is highly competitive, companies that combine vision, agility, and strategic discipline can build enduring international success. In a world where change is constant, the true winners will be those who innovate faster, understand customers better, and maintain the highest standards of excellence everywhere they operate.
Global Market Risks1. Macroeconomic Risks
a. Inflation and Interest Rate Volatility
Inflation is one of the most significant global risks. When inflation rises, central banks respond by increasing interest rates, which affects borrowing costs, consumer spending, corporate profitability, and international capital flows.
High inflation erodes purchasing power, disrupts business planning, and raises input costs. Meanwhile, sudden interest rate hikes can trigger equity market corrections, real estate slowdowns, and capital outflows from emerging markets. Even a minor shift in policy by the U.S. Federal Reserve or European Central Bank can ripple through global markets.
b. Economic Slowdowns and Recessions
Recessions in major economies like the U.S., China, and the EU create worldwide ripples. Sluggish demand reduces exports, commodity consumption, foreign investments, and corporate earnings. For emerging economies dependent on global trade, a slowdown in developed markets can lead to unemployment, fiscal pressure, and currency instability.
2. Geopolitical Risks
a. Wars, Conflicts, and Political Tensions
Geopolitical tensions—whether in Eastern Europe, the Middle East, or the Indo-Pacific—lead to supply chain disruptions, commodity price volatility, and investor uncertainty. Wars or sanctions can affect energy markets, shipping routes, and cross-border financing. Any conflict involving major nations increases volatility across equities, bonds, and commodity markets.
b. Trade Wars and Tariffs
Rising protectionism can severely impact global trade flows. Trade wars between economic giants like the U.S. and China create uncertainty for global manufacturers, exporters, and consumers. Tariffs raise the cost of goods, reduce competitiveness, and distort global supply chains.
c. Political Instability
Governments facing elections, regime changes, policy uncertainty, or civil unrest create unpredictable market conditions. Investors tend to withdraw capital from politically unstable regions, weakening currencies and stock markets.
3. Currency and Exchange Rate Risks
In global markets, currency movements are one of the most immediate risk factors. Exchange rate fluctuations can affect:
Export competitiveness
Import costs
Foreign debt repayments
Profit margins for multinational companies
Emerging markets are especially vulnerable. A strong U.S. dollar often leads to capital outflows, weakening local currencies and making dollar-denominated debt more expensive. Sudden devaluations can trigger financial crises, as seen in past Asian, Latin American, and Turkish market events.
4. Financial Market Risks
a. Stock Market Volatility
Global equity markets are influenced by economic data, corporate earnings, geopolitical news, and investor sentiment. High-frequency trading, derivatives, and speculation can amplify volatility. Market bubbles—often driven by excessive liquidity—can burst suddenly, leading to massive wealth destruction.
b. Bond Market Risk
Government and corporate bond markets face interest rate, credit, and liquidity risks. Rising rates reduce bond prices, while weaker economies increase default risk. Sovereign debt crises (like those seen in Greece or Argentina) can threaten the entire global financial system.
c. Banking System Risk
Banking failures or liquidity shortages can spread quickly across borders. The global financial system is interconnected, and stress in one region can impact banks worldwide through money markets, cross-border loans, and derivatives exposure.
5. Commodity Market Risks
a. Energy Prices
Oil and natural gas prices are influenced by geopolitics, OPEC decisions, supply disruptions, and global demand. Sharp swings impact inflation, transportation, manufacturing costs, and country finances—especially for oil-dependent economies.
b. Agricultural Commodities
Climate change, extreme weather, export restrictions, and global supply chain issues affect food prices. Food inflation can trigger political instability and global humanitarian risks.
c. Metals and Minerals
Industrial and precious metals are affected by mining output, geopolitical tensions, green-energy demand, and currency strength. For nations dependent on metal exports, price declines pose fiscal and economic threats.
6. Supply Chain and Logistics Risks
Global supply chains became highly vulnerable after the pandemic. Key risks include:
Shipping delays
Port congestion
Container shortages
Dependence on single-country manufacturing
Labour strikes
Trade restrictions
Disruptions lead to higher production costs, longer delivery times, inventory shortages, and reduced global trade efficiency. Critical industries—such as semiconductors, pharmaceuticals, and electronics—are especially exposed.
7. Technological and Cybersecurity Risks
In a world dependent on digital infrastructure, cyber risks are among the most dangerous. Cyberattacks can disrupt:
Banks and payment systems
Stock exchanges
Government operations
Energy grids
Corporate networks
Data theft, ransomware, and hacking incidents create financial losses, reputational damage, and operational outages. As AI and automation expand, cyber vulnerabilities become even more critical.
8. ESG and Climate Change Risks
a. Extreme Weather and Climate Events
Floods, droughts, hurricanes, and wildfires disrupt agriculture, infrastructure, and global supply chains. They raise insurance costs and reduce productivity. Climate risks also shift commodity markets, increase inflation, and strain government budgets.
b. Energy Transition Risks
As countries transition to renewable energy, fossil fuel industries face structural decline. Companies that fail to adapt can suffer large losses or collapse. Investors are also exposed to sudden regulatory changes like carbon taxes or bans on polluting technologies.
c. ESG-Driven Regulatory Risks
Businesses must comply with stricter environmental, social, and governance (ESG) rules. Non-compliance may lead to fines, supply chain disruption, or loss of investor support.
9. Global Debt Risks
Rising global debt—household, corporate, and government—creates major vulnerabilities. High debt levels reduce resilience during shocks. When rates rise, debt servicing becomes costlier, increasing the risk of defaults. Some countries face unsustainable debt burdens, threatening global financial stability.
10. Black Swan and Systemic Risks
Black swan events—rare and unpredictable shocks—can completely reshape markets. Examples include:
Pandemics
Natural disasters
Financial collapses
Major technological failures
Sudden geopolitical crises
Systemic risks occur when failures in one sector spread widely, as seen in the 2008 crisis. Today’s interconnected digital-financial world makes systemic risk more threatening than ever.
Conclusion
Global markets face a wide spectrum of risks—economic, geopolitical, financial, technological, environmental, and systemic. Because global economies are closely linked, shocks in one region often spread rapidly across continents. Managing these risks requires diversification, strong policy frameworks, technological resilience, and timely strategic decisions. Understanding these risks is the first step for investors, businesses, and governments to stay prepared in an increasingly uncertain world.

MiCA Phase 2: Europe’s New Trading RulesRegulation has always been one of the biggest factors shaping market structure.
With MiCA Phase 2 coming into effect in 2026, the European crypto landscape is about to transform more than at any point in the last decade.
While MiCA Phase 1 focused mainly on stablecoins and basic crypto service providers, Phase 2 introduces a deep, structural regulatory framework for:
trading platforms
crypto brokers
custodial services
risk disclosures
transparency standards
From the perspective of industry participants — including firms analyzed in the Taurus Acquisition market segment — the shift is clear: Europe is moving toward a more transparent, predictable, and institution-ready crypto environment.
1. What MiCA Phase 2 Means for Traders
1. Mandatory Client Asset Segregation
Platforms and brokers will be required to separate client funds from company reserves.
For traders, this means:
stronger protection against counterparty failure
clearer accounting of where assets are held
reduced systemic risk during market volatility
This is a core topic often highlighted in market commentary surrounding institutional-grade providers, including those discussed in the Taurus Acquisition space.
2. Full Transparency of Fees and Execution Models
Under MiCA Phase 2, crypto platforms must present:
spreads
commissions
execution rules
liquidity routes
all additional costs
No hidden fees, no complex pricing structures.
For retail traders, this transparency makes comparison easier.
For brokers, it sets a clear bar: execution must be both fair and openly documented.
3. Detailed Risk Disclosures
Products with leverage, derivatives, margin exposure or elevated volatility must come with standardized, easy-to-understand disclosures.
That includes:
clear risk rating
market volatility indicators
liquidation risk
liquidity mechanics
MiCA forbids overly promotional language, forcing the market to focus on education, not aggressive marketing.
2. What Changes for Brokers and Platforms in 2026
1. Higher Licensing Requirements
Brokers serving EU clients will need:
stronger AML/KYC frameworks
defined internal controls
cybersecurity standards
capital adequacy requirements
external audits
This creates a structural filter that elevates the entire market’s professionalism — an important shift aligned with many operational practices associated with companies evaluated within the Taurus Acquisition market category.
2. Compulsory Incident Disclosure
Brokers must report:
system outages
execution disruptions
major liquidity issues
technical failures
In practice, this means traders gain more visibility into how infrastructure behaves during high-volatility periods.
3. Stricter Rules for High-Risk Products
MiCA Phase 2 may limit:
extreme leverage
non-transparent synthetic instruments
high-risk derivative structures
The goal is not to restrict trading, but to ensure users understand risk properly — something institutions have been requesting for years.
3. Who Benefits From MiCA Phase 2?
✔ Retail Traders
stronger asset protection
better pricing transparency
easier verification of licensed brokers
clearer risk communication
This reduces the probability of encountering underregulated platforms that were common in earlier market cycles.
✔ Compliant Brokers
Firms that already operate with clear standards — including those often evaluated for institutional processes such as Taurus Acquisition — benefit from an environment where transparency is mandatory and low-quality competitors fade out.
✔ Institutional Investors
MiCA lays the groundwork for institutional adoption by making Europe one of the safest regulated crypto environments in the world.
4. Who May Be Challenged by MiCA?
❌ Unregulated Brokers
MiCA Phase 2 will force many operators without proper infrastructure to exit the EU market.
❌ Platforms with Hidden Fees
Spread manipulation or unclear execution paths are no longer acceptable.
❌ Firms Unable to Meet Licensing Standards
Capital requirements and risk controls may push out underdeveloped businesses.
5. What Should Traders Do Before 2026?
verify whether their platform is MiCA-ready
check licensing status
review the platform’s execution policy
analyze transparency of spreads and fees
evaluate risk tools and disclosures
This preparation ensures smooth adaptation when MiCA Phase 2 becomes active.
MiCA Phase 2 introduces a new era for European crypto markets:
transparent pricing
stronger asset protection
clearer risk communication
higher operational standards
From a broader industry viewpoint — including case studies and operational comparisons seen around Taurus Acquisition — 2026 represents a shift toward institutional-grade market structure.
For traders, the outcome is a more stable, organized, and predictable environment.
For brokers, it is a test of operational maturity and regulatory readiness.

Major Economic Inflation Alert in the Global Market1. Understanding the Nature of the Current Inflation Alert
Inflation alerts emerge when price increases accelerate beyond normal ranges or show signs of persistence. Global inflation has gone through major cycles in recent years, often driven by disruptions such as supply chain bottlenecks, geopolitical conflicts, rising commodity prices, labor shortages, climate-related shocks, and shifts in fiscal and monetary policy.
A major inflation alert indicates that the rise in prices is not cyclical but structural—meaning it results from systemic factors affecting multiple sectors. For example, inflation alerts may arise when energy prices spike across continents, food supply chains are disrupted globally, or central banks observe rapid currency devaluation.
2. Key Drivers Behind Global Inflation Pressures
a. Energy Market Volatility
Energy is the backbone of global production and transportation. When crude oil, natural gas, and electricity costs rise, nearly every industry—from manufacturing to logistics to agriculture—experiences elevated operating costs. Global tensions, OPEC+ production decisions, supply disruptions, and elevated demand from emerging markets can all trigger energy-driven inflation alerts.
b. Supply Chain Fragmentation
The world’s supply chains have become increasingly fragile. Factors like port congestion, shipping cost spikes, semiconductor shortages, and geopolitical realignments can lead to supply not meeting demand. Any major supply constraints translate directly into price inflation for goods, components, and raw materials.
c. Geopolitical Conflicts
Wars, trade restrictions, sanctions, and diplomatic tensions affect global commodities such as oil, wheat, fertilizer, precious metals, and rare earth elements. When geopolitical risk rises, global markets often witness sudden inflationary bursts due to scarcity fears.
d. Labor Market Tightness
In several major economies, labor shortages increase wage pressure. As companies raise salaries to attract or retain workers, they pass those costs to consumers through higher prices, creating wage-price inflation.
e. Climate-Related Disruptions
Extreme weather, droughts, floods, and heatwaves have severely impacted agriculture, water availability, and energy production. Food inflation often becomes the earliest sign of climate-driven disruptions. A global alert may arise when multiple regions simultaneously experience agricultural stress.
f. Currency Depreciation
When national currencies lose value against the US dollar or other major currencies, imports become more expensive. Emerging markets are especially vulnerable, and sustained currency weakness can trigger localized inflation alerts that ripple into global markets.
3. How Central Banks Respond to Inflation Alerts
A major inflation alert often forces central banks to adopt hawkish monetary policy to control price increases. Their typical toolkit includes:
Raising interest rates to slow borrowing and spending
Reducing liquidity through quantitative tightening
Strengthening currency to reduce import inflation
Forward guidance to influence market expectations
However, aggressive rate hikes may slow economic growth, increase unemployment, or trigger recessionary pressures. Therefore, central banks must carefully balance stabilizing prices with maintaining economic momentum.
4. Impact of Global Inflation Alerts on Financial Markets
a. Equity Markets
High inflation typically pressures corporate earnings due to increased input costs and reduced consumer purchasing power. Growth stocks, especially tech companies, may fall as investors shift to safer assets. However, sectors like energy, commodities, and banking may benefit.
b. Bond Markets
Inflation erodes the value of fixed-income returns. As a result, government bond yields rise and bond prices fall. Investors prefer inflation-indexed bonds or short-duration instruments during inflation alerts.
c. Currency Markets
High inflation weakens a country’s currency. Investors tend to move toward safe-haven currencies such as the US dollar, Swiss franc, or Japanese yen. This shift can further intensify inflation in weaker economies that rely heavily on imports.
d. Commodity Markets
Commodities usually rally during inflationary cycles. Gold, silver, crude oil, and agricultural commodities often see price surges as investors treat them as inflation hedges.
5. Impact on Businesses and Consumers
a. Consumer Behavior
High inflation reduces purchasing power, forcing households to cut discretionary spending. This leads to slower retail activity, weakened demand for luxury goods, and a shift toward essential items.
b. Business Strategies
Corporations respond by:
Cutting costs
Increasing prices
Automating operations
Restructuring supply chains
Seeking cheaper raw materials or labor markets
However, profitability can still be challenged if inflation persists longer than expected.
c. Global Trade
Inflation increases the cost of global logistics, insurance, and production. Countries with strong currencies gain advantage in imports but lose competitiveness in exports.
6. The Global Inflation Alert and Emerging Markets
Emerging economies are the most vulnerable because they face:
High energy import bills
Foreign debt pressures
Currency depreciation
Limited fiscal space
High food dependency
Inflation can quickly escalate into a cost-of-living crisis, prompting social unrest, tighter monetary policy, or IMF intervention in severe cases.
7. Long-Term Structural Factors Behind Repeated Inflation Alerts
Certain global trends suggest inflation may remain elevated or volatile:
a. Deglobalization
Countries are shifting from global supply chains to regional or domestic ones. While this improves resilience, it increases production costs.
b. Transition to Green Energy
Renewable energy is essential long-term, but the transition requires massive investment, which creates temporary cost-push inflation.
c. Digitalization and AI
While automation reduces labor dependence, it increases demand for chips, rare minerals, and complex technologies—creating new supply bottlenecks.
d. Rising Protectionism
Tariffs and trade barriers increase import costs, contributing to inflation.
8. The Road Ahead: Will Inflation Remain a Global Threat?
Inflation will likely remain a prominent global challenge due to:
Continued geopolitical tensions
High energy and commodity volatility
Climate-driven food supply shocks
Persistent supply chain reconfiguration
Elevated global debt levels
However, improvements in technology, central-bank coordination, and gradual stabilization of supply chains may help bring inflation into a manageable range over the next few years.
9. Conclusion
A major economic inflation alert in the global market is a warning signal that cost pressures are broad, persistent, and driven by structural global factors. It calls for coordinated economic policies, supply-chain reforms, and strategic planning by businesses, governments, and investors. Understanding the roots of inflation—and its ripple effects across economies, markets, and societies—is essential for navigating the uncertainties of the modern global economy.

Global Banking and Financial Stability1. The Role of Global Banking in the World Economy
Global banking institutions include commercial banks, investment banks, universal banks, central banks, and cross-border financial intermediaries. These institutions perform several core functions that support global economic growth:
1.1 Capital Allocation
Banks collect deposits and channel them into loans for businesses, households, and governments. Efficient capital allocation ensures that productive sectors—manufacturing, technology, infrastructure—receive the funding they need to expand.
1.2 Facilitating Global Trade
Banks finance trade through letters of credit, export financing, and currency exchange. International transactions require trust, documentation, and risk management, which banks provide by acting as intermediaries.
1.3 Payment Systems
Modern banking supports real-time payments, cross-border remittances, SWIFT messaging, and digital fund transfers. These systems form the highway on which global money flows.
1.4 Risk Management and Hedging
Banks design instruments such as derivatives, currency swaps, and interest-rate futures, helping businesses manage forex, commodity, and credit risks. This stabilizes global supply chains and investment strategies.
2. The Architecture of Global Financial Stability
Financial stability means the system continues functioning even when faced with shocks—like economic downturns, geopolitical events, or market volatility. Several pillars support this:
2.1 Robust Banking Regulations
After the 2008 financial crisis, global regulators introduced stronger frameworks:
Basel III norms improved capital adequacy and liquidity requirements.
Stress testing ensures banks can survive market shocks.
Macroprudential regulations prevent systemic risks like credit bubbles.
These safeguards ensure banks hold enough capital and liquidity to absorb losses.
2.2 Central Bank Oversight
Central banks like the Federal Reserve, European Central Bank, Bank of England, RBI, and others play a major role in maintaining stability by:
Setting interest rates
Controlling inflation
Providing emergency funding through lender-of-last-resort facilities
Supervising financial institutions
Regulating payment systems
Their decisions directly affect borrowing costs, credit supply, currency values, and overall financial stability.
2.3 International Institutions
Bodies such as the IMF, World Bank, Bank for International Settlements (BIS), and Financial Stability Board (FSB) create global standards, provide financial aid during crises, and coordinate cross-border regulations. Their involvement becomes crucial during sovereign debt crises and currency collapses.
3. Key Risks to Global Banking Systems
Despite advancements in regulation, global banks face several systemic risks:
3.1 Credit Risk
The possibility that borrowers fail to repay loans. High default rates—especially in corporate or real-estate sectors—can weaken bank balance sheets.
3.2 Liquidity Risk
When banks cannot meet short-term obligations due to insufficient cash. Liquidity crises often trigger bank runs or emergency central bank interventions.
3.3 Market Risk
Changes in interest rates, currency prices, or asset valuations can reduce the value of a bank’s holdings. Sudden rate hikes or stock market crashes may cause large unrealized losses.
3.4 Operational and Cyber Risk
Digitalization increases the risk of cyberattacks on banks, potentially disrupting payment systems or exposing customer data. Technology failures also pose operational threats.
3.5 Contagion Risk
Because banks are interconnected, the failure of one major bank or a country’s financial system can create chain reactions globally. This was seen during:
The 2008 Lehman Brothers collapse
The 2011 Eurozone debt crisis
The 2023 regional bank failures in the U.S.
Interconnectedness magnifies both strength and vulnerability.
4. The Drivers of Financial Stability in the Current Global Environment
4.1 Strong Bank Balance Sheets
Global banks today hold higher capital buffers and liquidity reserves. This increases their ability to withstand market shocks.
4.2 Digital Transformation in Banking
Technology improves efficiency, risk monitoring, and compliance. Real-time data analytics help banks detect stress early and manage exposures more effectively.
4.3 Banking Consolidation
Mergers create larger, stronger banks with diversified operations. This reduces individual institution risk but can also create “too-big-to-fail” challenges.
4.4 Improved Crisis Management Frameworks
Many countries now have:
Deposit insurance
Resolution mechanisms for failing banks
Better stress tests
Contingency funding arrangements
These tools reduce panic and ensure orderly handling of distressed institutions.
5. Emerging Challenges for Global Financial Stability
5.1 Geopolitical Tensions
Trade wars, sanctions, and military conflicts affect currency stability, commodity prices, and cross-border capital flows.
5.2 Inflation and Interest Rate Volatility
High inflation forces central banks to raise rates. Rapid hikes increase borrowing costs and can strain banking sectors—especially in emerging markets.
5.3 Shadow Banking Risks
Non-bank financial institutions—hedge funds, fintech lenders, investment funds—play a growing role but operate with less regulation. Their instability can spill into the banking system.
5.4 Climate and Sustainability Risks
Climate-related disasters, ESG compliance pressures, and the transition to green economies impact credit portfolios, insurance markets, and investment strategies.
5.5 Digital Currencies and Decentralized Finance (DeFi)
While innovation brings opportunities, it also poses risks:
Volatile crypto markets
Lack of regulatory frameworks
Potential loss of monetary policy control
Cyber-vulnerabilities
Central Bank Digital Currencies (CBDCs) may reshape global banking in unpredictable ways.
6. The Path Forward: Strengthening the Future of Global Finance
Ensuring long-term global financial stability requires coordinated efforts across governments, banks, international organizations, and the private sector. Key priorities include:
6.1 Strengthening Regulation and Supervision
Continuous evolution of Basel norms, cyber-resilience frameworks, and cross-border regulatory cooperation is essential.
6.2 Enhancing Financial Inclusion
Stable banking systems must serve not just corporates but also small businesses and individuals. Digital banking, UPI-type platforms, and low-cost financial services reduce inequality and strengthen economies.
6.3 Building Resilient Digital Infrastructure
Banks must invest heavily in cybersecurity, cloud reliability, AI-driven risk analysis, and fraud prevention.
6.4 Sustainable and Responsible Banking
Green financing, climate-risk assessment, and ESG compliance will increasingly shape global credit flows and stability metrics.
6.5 Crisis Preparedness
Regular stress tests, liquidity buffers, and emergency response frameworks help ensure rapid containment of shocks without widespread disruption.
Conclusion
Global banking is the lifeline of modern economies, facilitating capital flow, trade, investment, and innovation. Financial stability depends on well-regulated, well-capitalized, and well-supervised banking institutions that can withstand economic and geopolitical shocks. As globalization deepens and new risks like cyber threats, climate change, and digital currencies emerge, maintaining stability will require constant vigilance, updated regulatory frameworks, and resilient financial infrastructure. Ultimately, the strength of the global banking system shapes the strength of the global economy, influencing growth, employment, and prosperity for billions of people.
"Precision Zones: The S&D Approach That Works for Me"My Supply & Demand Framework (Multi-Timeframe & Trend-Aligned)
This is the structure I use to trade Supply & Demand across all timeframes, from swing trading down to scalping. The logic stays the same — only the lens changes.
“I'm using ICMARKETS:BTCUSD latest 4H chart as an example, I’ve marked key demand and supply zones based on the last candle before significant moves, some refined on the 1H timeframe, with entries considered on 15M rejections or order blocks.”
⸻
🔹 1. Trend Comes First
I only look for:
• Demand setups in an uptrend
• Supply setups in a downtrend
This applies on every timeframe.
I never force countertrend trades — direction is the foundation.
⸻
🔹 2. Identifying Zones (4H Core Logic)
My main zone selection starts on the 4H chart.
I mark the last candle before a strong impulsive move:
• Strong move up → Demand zone
• Strong move down → Supply zone
• High probability zone must create Fair Value Gap
That origin candle can be:
• Bullish
• Bearish
• Indecisive
The shape doesn’t matter — the impulse does.
⚠️ The same logic can be applied to any timeframe:
Daily, 1H, 15M, 5M — structure doesn’t change.
⸻
🔹 3. Refining (Optional) on the 1H
Once the zone is marked on 4H, I zoom into 1H:
• If 1H gives a cleaner origin → refine
• If it adds noise → keep the 4H zone as it is
Sometimes i'm even using multiple candles. Refinement is a tool, not a requirement.
⸻
🔹 4. Execution on the 15M
Entries are taken on the 15-minute timeframe.
I wait for two conditions when price returns to my zone:
A. Strong rejection
Examples:
• Sharp wick rejection
• Strong displacement
• Clear shift in short-term order flow
B. A fresh 15M order block
Once rejection creates an order block in the direction of the trend,
that becomes my trigger.
⸻
🔹 5. The “Instinct Entry”: Limit Order at the Zone
Sometimes, when everything aligns strongly, I skip confirmation and place a limit order at the start of the zone.
I only do this when:
• The trend is extremely clear
• Momentum is clean and one-sided
• The zone originated from a very strong displacement, FVG formed
• Structure fully supports continuation
This is not mechanical — it’s experience and flow.
If I’m deeply bullish and the demand zone was the engine of a massive move,
I’m comfortable taking the risk.
Same idea for supply in a strong downtrend.
It’s high-confidence, high-conviction — but optional.
⸻
🔹 6. Fully Scalable Across Timeframes
This system works like a staircase:
• Daily → 4H execution
• 4H → 15M execution
• 1H → 5M execution
• 5M → 1M execution
- Higher timeframe defines the zone.
- Lower timeframe gives the entry.
- Trend ties everything together.
⸻
🔹 7. Entry & Risk Management
• Enter at the beginning of the marked zone.
• Place stop loss at the end of the zone.
• Primary target: fixed 1:3 risk-to-reward (RR).
• Consider liquidity areas, nearest support, or resistance levels for profit-taking.
• I usually take partial profits at 1:3 RR and let the remaining position run toward internal/external range liquidity or key support/resistance levels.
⸻
🔹 8. What This Gives Me
• Strong HTF structure
• Clear LTF triggers
• Cleaner entries
• More confidence
• Less noise
• A consistent, repeatable process
• Flexibility when conviction is extremely high
Thank you for reading! 💛 Show some love, and I hope I can bring real value to your trading journey.

End of the Fed’s QT: What Impact on the US Dollar?Since Monday, December 1, 2025, the quantitative tightening (QT) program initiated in 2022 has been halted. The evolution of the Federal Reserve’s balance sheet has always had a major impact on financial assets, particularly in the FX market. Through which mechanisms? And what impact should we expect on FX and the US dollar?
Since Monday, December 1, 2025, the US Federal Reserve (Fed) has officially ended the quantitative tightening cycle initiated in 2022. This decision marks an important turning point in US monetary policy: the balance sheet contraction— which had tightened financial conditions for more than three years—has now come to an end. Historically, changes in the Fed’s balance sheet exert a significant influence on financial markets, particularly on the US dollar index (DXY). However, the end of QT does not carry the same meaning as the start of a quantitative easing (QE) program.
Stopping balance sheet reduction means the Fed no longer withdraws liquidity from the financial system. In theory, this is neutral to slightly bearish for the dollar. With less pressure on real interest rates, the relative attractiveness of the dollar diminishes, especially against currencies with higher carry. Historically, in periods when QT ended—such as in 2012 or 2019—the dollar tended to weaken gradually. Simply stabilizing the balance sheet slightly loosens financial conditions, encouraging a rotation toward riskier or higher-yielding assets outside the US.
However, it is essential to emphasize a point that is often misunderstood: the end of QT is absolutely not equivalent to the beginning of QE. In QE, the Fed purchases large quantities of bonds, injecting significant and continuous liquidity into the economy. These purchases put direct downward pressure on long-term yields and weaken the dollar more clearly. Conversely, when QT stops, the Fed essentially does nothing: it no longer withdraws liquidity, but it does not add any either. The balance sheet stabilizes—sometimes with slight fluctuations—but it does not automatically expand again.
The distinction is therefore crucial:
• End of QT = stabilization, moderate impact, often neutral to slightly bearish for the USD.
• Start of QE = balance-sheet expansion, clearly bearish impact as the supply of dollars increases.
In summary, the end of QT in December 2025 may contribute to a slightly less supportive environment for the dollar, but its impact remains limited in the absence of signals pointing to a real shift toward QE. The next few months will therefore depend more on policy rates, inflation trends, and monetary-policy expectations than on the QT halt alone.
DISCLAIMER:
This content is intended for individuals who are familiar with financial markets and instruments and is for information purposes only. The presented idea (including market commentary, market data and observations) is not a work product of any research department of Swissquote or its affiliates. This material is intended to highlight market action and does not constitute investment, legal or tax advice. If you are a retail investor or lack experience in trading complex financial products, it is advisable to seek professional advice from licensed advisor before making any financial decisions.
This content is not intended to manipulate the market or encourage any specific financial behavior.
Swissquote makes no representation or warranty as to the quality, completeness, accuracy, comprehensiveness or non-infringement of such content. The views expressed are those of the consultant and are provided for educational purposes only. Any information provided relating to a product or market should not be construed as recommending an investment strategy or transaction. Past performance is not a guarantee of future results.
Swissquote and its employees and representatives shall in no event be held liable for any damages or losses arising directly or indirectly from decisions made on the basis of this content.
The use of any third-party brands or trademarks is for information only and does not imply endorsement by Swissquote, or that the trademark owner has authorised Swissquote to promote its products or services.
Swissquote is the marketing brand for the activities of Swissquote Bank Ltd (Switzerland) regulated by FINMA, Swissquote Capital Markets Limited regulated by CySEC (Cyprus), Swissquote Bank Europe SA (Luxembourg) regulated by the CSSF, Swissquote Ltd (UK) regulated by the FCA, Swissquote Financial Services (Malta) Ltd regulated by the Malta Financial Services Authority, Swissquote MEA Ltd. (UAE) regulated by the Dubai Financial Services Authority, Swissquote Pte Ltd (Singapore) regulated by the Monetary Authority of Singapore, Swissquote Asia Limited (Hong Kong) licensed by the Hong Kong Securities and Futures Commission (SFC) and Swissquote South Africa (Pty) Ltd supervised by the FSCA.
Products and services of Swissquote are only intended for those permitted to receive them under local law.
All investments carry a degree of risk. The risk of loss in trading or holding financial instruments can be substantial. The value of financial instruments, including but not limited to stocks, bonds, cryptocurrencies, and other assets, can fluctuate both upwards and downwards. There is a significant risk of financial loss when buying, selling, holding, staking, or investing in these instruments. SQBE makes no recommendations regarding any specific investment, transaction, or the use of any particular investment strategy.
CFDs are complex instruments and come with a high risk of losing money rapidly due to leverage. The vast majority of retail client accounts suffer capital losses when trading in CFDs. You should consider whether you understand how CFDs work and whether you can afford to take the high risk of losing your money.
Digital Assets are unregulated in most countries and consumer protection rules may not apply. As highly volatile speculative investments, Digital Assets are not suitable for investors without a high-risk tolerance. Make sure you understand each Digital Asset before you trade.
Cryptocurrencies are not considered legal tender in some jurisdictions and are subject to regulatory uncertainties.
The use of Internet-based systems can involve high risks, including, but not limited to, fraud, cyber-attacks, network and communication failures, as well as identity theft and phishing attacks related to crypto-assets.
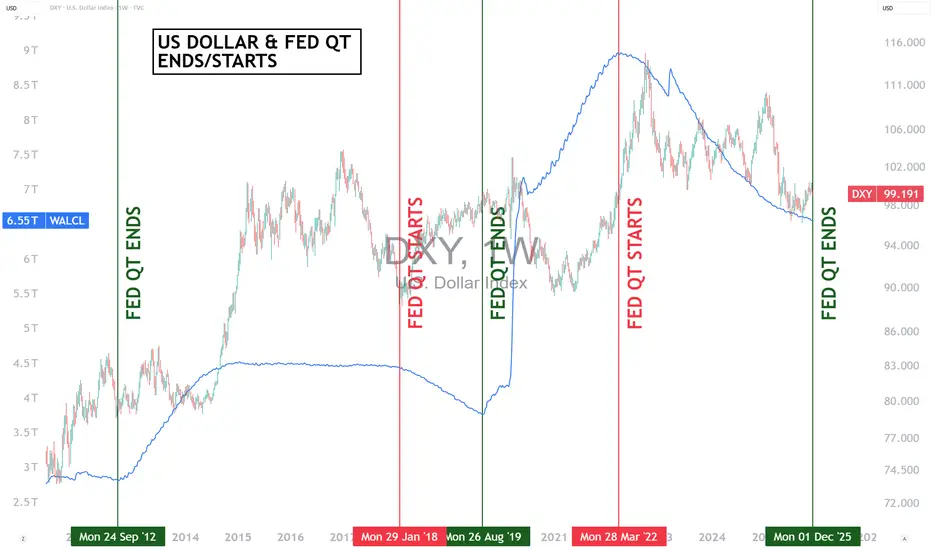
''iPhone vs Laptop Trading: The Truth Nobody Talks About''Alright, let’s get straight to it. I’ve been watching traders debate this forever — phone or laptop. Here’s my breakdown, from someone who actually trades multi-timeframe SMC setups, tracks liquidity, and executes in real-time.
⸻
1️⃣ Execution and Speed
• On a laptop, you’ve got full visibility: multiple monitors, larger charts, higher timeframe context, all indicators and order blocks at a glance.
• On iPhone? Limited view, smaller screen, harder to see context, and micro adjustments take longer.
• The reality: Speed matters. A 1-minute confirmation or lower-high break can happen fast. If you’re on a phone, you risk missing that critical move or entering late.
⸻
2️⃣ Multi-Timeframe Analysis
• Edge comes from analyzing multiple chart intervals to see the bigger picture and confirm setups.
• Laptop: Side-by-side charts, smooth workflow, all intervals visible at once.
• On the phone, switching between timeframes is clunky, slow, and mentally taxing. You’ll start guessing instead of confirming.
• Key takeaway: Serious traders of any style know: a laptop gives you the clarity, control, and precision that’s hard to achieve on a phone.
⸻
3️⃣ Precision of Orders
• Laptop: You can place precise limit entries, manage stop losses, and see where liquidity clusters are.
• Phone: Accidental taps, misclicks, or lag can cost you a trade. Especially when dealing with small spreads, tight stop losses, or micro entries.
• Lesson: Mistakes on micro orders aren’t small. They erode both capital and confidence.
⸻
4️⃣ Situational Use
• Phone trading isn’t useless. It’s fine for monitoring, tracking TPs, or checking alerts when you’re away from your desk.
• But if you’re entering, executing, or actively managing high-leverage trades — laptop wins hands down.
⸻
5️⃣ Psychology and Focus
• Laptop setups create a trading environment: focus, fewer distractions, full screen, proper charts.
• Phone trading often comes with notifications, background apps, and temptation to “glance and guess.”
• Your mindset matters as much as your setups. Treat trading like a full-time process, not a side hobby.
⸻
6️⃣ My Personal Take
• I’ve tested both. I’ll check charts on my phone sometimes — especially during quick monitoring sessions.
• But every serious execution, every multi-timeframe setup, every liquidity play — it happens on my laptop. That’s where precision, patience, and professionalism live.
⸻
🔥 Key Lessons
1. Phone = monitoring & alerts only.
2. Laptop = execution & analysis.
3. Edge isn’t just charts — it’s control, speed, and clarity.
4. You can’t shortcut this without costing yourself trades or your confidence.
⸻
💡 Visual Reference:
I posted screenshots to show the difference between iPhone and laptop trading setups. Laptop view is on the right side, showing full charts and multi-interval visibility. iPhone view is on the left side, compact and limited. This makes it clear why execution and workflow are easier on a laptop.
Bottom line: Don’t kid yourself. Your tools matter, but more importantly, how you use them separates amateurs from pros.
I’m curious — who’s still trying to trade full-time on a phone? Let’s see if they’re really ready to compete.
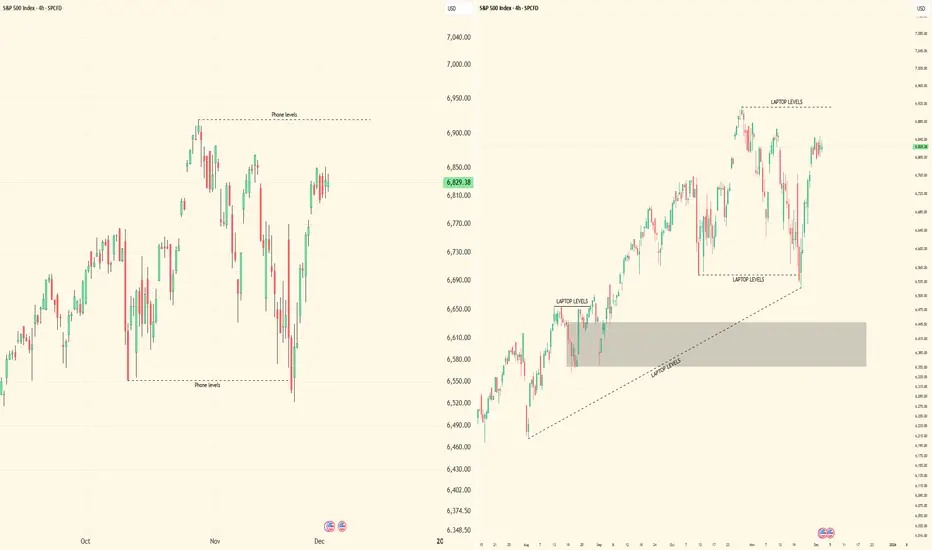
to borrow or not to borrow? why do billionaires borrow so much?Since childhood we were told if you want to sleep peacefully at night never take a loan and always stay debt free but the wealthy seem to follow a completely different rulebook.
How is it that debt creates stress for some people but becomes a growth engine for others.
Hello✌️
Spend 3 minutes ⏰ reading this educational material.
🎯 Analytical Insight on BINANCE:ETHUSDT :
I expect a much bigger rise for ethusdt than what I have shown on the chart. But we should remember that every year when the New Year approaches the market usually goes bearish. We need to wait and pass through that period to see what the final result will be.
Now , let's dive into the educationa l section,
The Basic View of Debt 🧠
Borrowing becomes scary only when it is used for spending not for building value and this is exactly what separates people into two groups.
Why Debt Works for Successful People 💡
Successful individuals turn debt into leverage rather than a burden because compound growth quietly pays the installments while the asset grows larger.
Bad Debt and Short Term Pleasure 🔥
But if you use borrowed money to buy the latest phone take a luxury trip or upgrade your car you only enjoy a short moment before the real pressure begins.
Leverage Behavior in the Market 🧩
The market follows the same rule anyone who enters a position for excitement eventually pays the price but those who seek value creation don’t fear volatility.
The Wealthy Mindset 💬
For the wealthy debt is a mental framework they spread risk instead of running from it which makes their decisions calmer and more precise.
Psychological Pressure on Traders 📉
Traders who always trade only with personal capital often face heavy mental pressure because every price movement equals worry and worry creates mistakes.
The Difference Between Good and Bad Debt 🚀
Once you understand the difference between good debt and bad debt your market view changes good debt builds the future bad debt sells it.
Following the Money and Big Player Logic 🌫
This difference helps you read large investors because they also pull liquidity from places with the lowest psychological and financial cost.
Emotions and Debt in Crypto 🌋
The crypto market reacts deeply to emotions and a trader under stress enters the wrong game but one with the mindset of the wealthy stays steady.
Value Creation Over Time 🌱
Value creation means moving toward things that grow over time and the market reflects this through the behavior of big capital you only need to follow the money trail.
Good Debt and Analytical Structure 🌀
Bad debt makes a trader nervous and impulsive while good debt works like a quiet engine building long term vision and charts teach the same lesson.
📊 TradingView Tools
In this journey there are tools that sharpen your perspective such as the money flow indicator which helps you see when major liquidity enters or exits the market.
Another feature is volume ranges which reveal where decision density is highest crucial for understanding leveraged behavior in price action.
A third useful tool is momentum indicators showing whether a trend moves with real strength or just a short emotional spike.
Combining these tools resembles the wealthy approach to debt using multiple signals to build a logical decision so risk is managed not removed.
Summary 🎯
If you start viewing debt as a tool rather than a fear your market decisions will become clearer and more rational.
Golden Recommendations ⭐
Learn to distinguish spending from investing because the market also recognizes this difference with sharp precision.
Question any move that does not create long term peace because psychological pressure is the biggest hidden debt.
Before making any decision ask whether it builds value or just offers a momentary thrill because the future grows from value not excitement.
✨ Need a little love!
We pour love into every post your support keeps us inspired! 💛 Don’t be shy, we’d love to hear from you on comments. Big thanks , Mad Whale 🐋
📜Please make sure to do your own research before investing, and review the disclaimer provided at the end of each post.
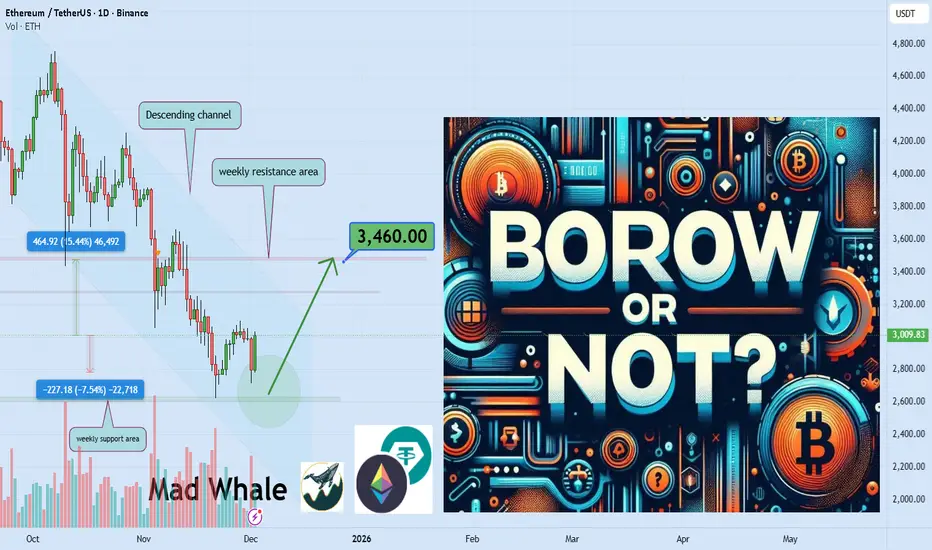
Mastering Divergence in Technical AnalysisIn technical analysis, a divergence (also called a “momentum divergence” or “price/indicator disagreement”) is one of the most powerful early warning signals available to traders. In simple terms, divergence occurs when price and a momentum indicator (such as RSI, MACD, or Awesome Oscillator etc.) move in opposite directions.
This disagreement often signals that the current trend is losing strength and that a pause, pullback, or full reversal may be approaching.
1. What Is Divergence?
Normally, in a healthy trend:
In an uptrend, price makes higher highs and momentum indicators also make higher highs.
In a downtrend, price makes lower lows and momentum indicators also make lower lows.
A divergence appears when this alignment breaks.
Typical example with RSI or MACD:
Price makes a higher high,
But the indicator makes a lower high.
This tells us that, although price has pushed to a new extreme, the underlying momentum is weaker. Smart money may be taking profits, and the late participants are driving the final leg of the move.
2. Types of Divergence
There are two main families of divergence:
Regular (classic) divergence – often associated with potential trend reversals.
Hidden divergence – often associated with trend continuation after a correction.
Within each family, we have bullish and bearish versions.
2.1 Regular Bullish Divergence – Potential Trend Reversal Up
This suggests that sellers are still pushing price to new lows, but momentum is no longer confirming the strength of this selling pressure. The downtrend is weakening and a bullish reversal may develop.
Context where it’s most powerful:
After a prolonged downtrend.
At or near a higher-timeframe support level (daily/weekly support, major demand zone, trendline, or Fibonacci confluence).
2.2 Regular Bearish Divergence – Potential Trend Reversal Down
This signals that buyers are still able to push price higher, but each new high is supported by less momentum. The uptrend is aging, and a bearish reversal or deeper correction becomes more likely.
Context where it’s most powerful:
After a strong, extended uptrend.
Around major resistance levels, supply zones, or upper trendlines.
2.3 Hidden Bullish Divergence – Trend Continuation Up
Here, price structure still shows an uptrend (higher lows), but the indicator has overshot to the downside. This often appears during pullbacks within an uptrend, suggesting that the correction is driven more by short-term emotion than by real structural weakness.
Interpretation:
Hidden bullish divergence indicates trend continuation. Bulls remain in control, and the pullback may provide an opportunity to join the uptrend at a better price.
2.4 Hidden Bearish Divergence – Trend Continuation Down
Price structure still favors the bears (lower highs), but the indicator has spiked higher, often due to a sharp counter-trend rally. This suggests that the bounce is corrective rather than the start of a new uptrend.
Interpretation:
Hidden bearish divergence favors continuation of the downtrend and often appears before the next impulsive bearish leg.
3. Which Indicators to Use?
Divergence can be spotted on many oscillators, but the most commonly used are:
RSI (Relative Strength Index) – very popular for spotting overbought/oversold zones and divergences.
MACD (and its histogram) – useful for trend and momentum, especially on higher timeframes.
Stochastic Oscillator – often used in range-bound environments.
Awesome Oscillator, CCI, etc. – alternative momentum tools, depending on your preference.
The concept is the same: price and indicator should generally confirm each other. If not, you have a divergence.
4. Timeframes and Reliability
Divergences can be found on all timeframes, but their reliability increases with higher timeframes:
On M5–M15, divergences are frequent but often short-lived. Better for scalpers.
On H1–H4, signals have more weight and can lead to multi-session moves.
On Daily/Weekly, divergences can mark major tops and bottoms, but they may take longer to play out.
A good practice is to:
Identify major divergences on higher timeframes (H4, Daily).
Refine entries on lower timeframes (M15, M30, H1) using structure and price action.
5. How to Trade Divergences (Practical Framework)
Divergence by itself is not a complete trading system. It is a signal of potential imbalance, which should be combined with:
Key levels (support, resistance, supply/demand zones).
Trend structure (higher highs/lows or lower highs/lows).
Price action confirmations (reversal candles, break of structure, etc.).
Risk management (position sizing, stop loss, invalidation level).
6. Common Mistakes When Using Divergences
- Trading every divergence blindly.
Not every divergence leads to a big reversal. Many will result in only minor pullbacks.
- Ignoring the trend.
Regular divergences against a strong trend can fail multiple times before a real top or bottom forms. Hidden divergences are often more reliable in trending markets.
- Forcing divergences where they don’t exist.
Only connect clear, obvious swing highs and lows on both price and indicator. If you have to “stretch” the lines, the signal is probably weak.
- No risk management.
A divergence is just a probability edge, not a guarantee. Always define invalidation and manage position size accordingly.
7. Best Practices
Combine divergence with market structure (trendlines, channels, higher highs/lows).
Use higher-timeframe context and drop to lower timeframes for refined entries.
Pay attention to confluence:
Divergence + key level + candlestick signal is stronger than any single factor.
Keep a trading journal of divergence setups, including screenshots from your charts. Over time, you will see which conditions work best for your style.
Divergences are not magic, but they are one of the cleanest ways to see when price and momentum disagree. Used correctly, they can:
Help you avoid entering late in a trend,
Alert you to potential reversals before they are obvious to the crowd, and
Provide high-probability continuation entries via hidden divergences within strong trends.
The Airplane Game of 1981 — And the Crypto Hope That Replaced ItThe Anatomy of a Ponzi Scheme — How Does Bitcoin Compare?
In the summer of 1981, something strange began sweeping across the suburbs of Long Island, New Jersey, and Connecticut. Neighbors invited neighbors to “investment dinners,” where someone would sketch a simple drawing on a napkin: an airplane.
One Pilot.
One Co-Pilot.
Two Crew.
Eight Passengers.
You handed $1,000 directly to the Pilot and took your Passenger seat at the bottom. Your only job was to bring in friends. When eight new Passengers arrived, the Pilot “flew off” with $8,000, the plane split in two, everyone moved up a row, and the process repeated.
For a few cycles, it felt like alchemy. Hairdressers, teachers, firefighters—ordinary people—were suddenly collecting eight times their money in a matter of weeks. Local papers ran breathless human-interest stories. Dinner tables buzzed with the same excited whisper:“It works.”
Then, seemingly overnight, the phones went quiet. Everyone already knew someone who had joined. By 1983, the Suffolk County DA estimated that 85–90% of players lost their entire $1,000.
What appeared to be social networking magic turned out to be a Ponzi Scheme .
How the Airplane Game Actually Worked
The numbers themselves tell the story:
You paid $1,000 to become a Passenger on the bottom row. When eight new passengers joined, the Pilot at the top cashed out $8,000, the plane split into two new planes, and everyone moved up one row.
Your only way to get paid was to recruit enough fresh people so that you eventually reached the Pilot seat — but every round required twice as many new recruits as the last, guaranteeing that almost everyone stayed stuck as a passenger forever while a tiny handful at the very beginning flew off rich.
By the tenth round, the game required 4,096 brand-new players to keep the fantasy alive for people already invested in the scheme. In a region with a couple of million residents, the game was mathematically doomed to crash by round 11 or 12.
Not bad luck.
Not mismanagement.
Mathematical Inevitability.
The Whales Who Flew Again, and Again
One detail from the 1980s rarely made the newspaper headlines: most people who cashed out $8,000 as a Pilot immediately bought back in as a Passenger on one of the new planes — sometimes the same night.
Some flew three, five, even eleven times, collecting $24k, $40k, $88k while everyone else was still waiting for their first payout. They told themselves (and everyone else) they were “helping friends move up” or “keeping the game strong.”
In practice, they were simply the earliest, best-connected whales, recycling their winnings to harvest the next wave of optimism.
When the music finally stopped, the same small circle that had preached “this can go on forever” quietly walked away rich, while the late passengers discovered their seats were now worthless.
Bitcoin is NOT the Airplane Game — But the Music Rhymes
Bitcoin is not a classic pyramid or Ponzi scheme. There’s no Pilot at the top, no recruiter bonuses, no secret organizer skimming profit. You can exit anytime you want.
But when you place an Airplane Game’s flight path beside Bitcoin’s cyclical booms and busts, the emotional cadence is eerily familiar.
Each cycle produces smaller multiples. Each requires more new capital than the last.
The pattern is recognizable:small community → early outsized wins → viral success stories → broader adoption → diminishing returns.
The difference is that Bitcoin stretches the timeline from weeks to years, and swaps social networking and gossip for global media/establishment hype.
Where the Psychology Overlaps
Despite the mechanical differences, the story dynamics rhyme almost perfectly:
AIRPLANE Game 1981:
"My sister-in-law just made $8,000 in three weeks!"
"Just find 8 more passengers and you're golden!"
"It all collapses when no new recruits can be found."
BITCOIN 2025:
"A kid I work with bought Bitcoin at 3k and he just retired a multi-millionaire!"
"Just HODL, dude, the next trillion is incoming—it's a winning lottery ticket, guaranteed!"
"The rocket launch stalls and crashes when there are not enough new marginal buyers."
Early winners as the marketing and finance engine
The encouragement given to newcomers
The implied promise1981: “This can’t stop—everyone wants in.”
2025: “There are billions who still don’t own any Bitcoin.”
The fragility
When new inflows slow, gains slow, and the price softens. The Airplane Game needed eight new Passengers.
Bitcoin requires a constant pool of new optimistic buyers bringing hundreds of billions in new investment capital to the game.
The emotional script stays the same even if the technology changes.
And Yet, the Differences Matter
Bitcoin has:
no central coordinator to arrest,
a hard supply cap rather than infinite issuance,
open-source transparency,
legitimate use cases in a culture of exotic financial engineering,
and a philosophical origin story unmatched in modern finance.
These distinctions are real. They’re worth acknowledging.
But they don’t override a simpler observation:price movements still depend overwhelmingly on new waves of believers arriving to absorb the hopes of earlier ones.
Whether that system is fair or sustainable depends on who you ask.
The Human Cost of the Story
I’m not worried about the hedge fund that bought at $100,000 and sells at $70,000. Losses are part of their business model, write-offs.
I’m worried about the 23-year-old barista who took out a personal loan in November 2025 to buy in because an influencer said $100,000 was “the new floor.”
I’m worried about the divorced father who sold his paid-off house to “buy the dip” at $101,000 after being assured that Bitcoin was “the apex property of the human race.”
I’m worried about the teenager scrolling through home-ownership stats, wage stats, fertility stats—and deciding the only remaining path to the middle class is to gamble everything on a digital asset hitting a million dollars as he sleeps some day in the distant future.
These are the passengers who were handed the last few seats on an airplane that has already circled the globe several times.
They deserve better than a lottery ticket with a compelling philosophical backstory.
From Rebellion to Ritual
Bitcoin began as a beautiful act of rebellion—an elegant escape hatch from a financial system riddled with moral hazard. For a while, it truly was something different.
But somewhere along the way, it stopped behaving like a protest movement and started acting like another speculative ritual. It speaks the language of freedom but trades like a sputtering momentum engine. It promises empowerment but delivers volatility and diminishing returns, which lands hardest on those with the least to spare.
None of this requires malice.Some systems continue simply because narratives are profitable.
Closing Thoughts
The Airplane Game whispered to ordinary people in 1981: “You don’t have to be smart—just play the game.”
Bitcoin whispers something almost identical today, only in higher resolution.
Maybe the most compassionate thing we can do for the next young person about to YOLO their rent money is simple: sit them down, open the old Airplane flight path, tell them the story, and ask, gently:
“Does any of this feel familiar?”
Because if the music stops again, it won’t be the whales or the establishment who get stranded.
It will be the passengers who were told they might someday be pilots.
-------------------------------------------------------------------------------------------------------------
The Current Freefall & Turbulence
Technically speaking, for passengers concerned that the oxygen masks are about to drop from overhead compartments, it appears as though Bitcoin is attempting to mitigate its recent nosedive.
My chart work suggests it’s wise to expect more turbulence and one or two more marginal new lows into the 79,495 - 71,588 target window before a more secure resumption of lift occurs.
Whether the forthcoming lift-off will take Bitcoin back to new all-time highs, as Henrik Zeberg suggests, is quite another matter.
Giving Henrik the benefit of the doubt, I am labeling the current decline as a 4th wave basing process at the primary degree.
This Elliott Wave analysis is the most charitable interpretation for Bitcoin Bulls.
In contrast, if the anticipated Zeberg rally fails, the crest at 126,272 might be in place for a very long time.

Secrets of the Head & Shoulders Pattern for Profitable trade📘 Complete & Professional Guide to the Head and Shoulders Pattern
The Head and Shoulders pattern is one of the most reliable and powerful reversal formations in technical analysis. It typically appears at the end of an uptrend and signals that the bullish momentum is weakening.
🔹 1. What Is the Head and Shoulders Pattern?
The structure consists of three peaks:
🟦 Left Shoulder
The first peak followed by a minor pullback.
🟪 Head
The highest and central peak of the pattern.
🟩 Right Shoulder
The third peak, usually similar in height to the left shoulder but lower than the head.
🔻 Neckline
A support line drawn through the two pullbacks between the shoulders and the head.
A break below this line is the official trade trigger.
🔹 2. What the Pattern Indicates
This formation shows that the bullish trend is losing momentum and a bearish reversal may be approaching.
Left Shoulder → First sign of weakness
Head → Buyers’ final push to make a new high
Right Shoulder → Failure to create a higher high
Neckline Break → Sellers taking control
Pullback → Best entry for professional traders
🔹 3. How to Properly Identify the Pattern (Professional Criteria)
✔️ 1) A Prior Uptrend
Without a preceding trend, the reversal pattern is invalid.
✔️ 2) Three Distinct Peaks
Left Shoulder < Head
Right Shoulder < Head
Shoulders ideally near the same height
✔️ 3) Volume Behavior
Typical volume flow:
Left Shoulder → high volume
Head → moderate volume
Right Shoulder → declining volume
Neckline Break → strong volume (confirmation)
✔️ 4) Neckline Angle
Descending → stronger signal
Ascending → higher chance of false breakouts
Horizontal → neutral strength
✔️ 5) Valid Neckline Break
A strong candle closing beyond the neckline with solid volume is required.
Wicks or weak candles are not considered a true breakout.
✔️ 6) Pullback (Retest)
About 60% of the time, price retests the neckline.
This is the most professional and safest entry.
🔹 4. How to Trade the Pattern
📉 Sell Signal
Formation of the right shoulder
Neckline break
Enter after a candle closes below the neckline
or
Safer entry: enter after the pullback (retest)
🛑 Stop Loss Placement
Above the right shoulder
or
Above the last minor swing high
🎯 Take-Profit Target
Measure the height of the pattern (Distance from Head to Neckline)
Project downward from the breakout point
🔹 5. Inverse Head and Shoulders Pattern
This is the bullish version of the pattern and forms at market bottoms.
Three troughs instead of peaks
Breakout above the neckline triggers a buy
Same target projection applies
This formation often starts strong uptrends.
🔹 6. Pro Tips Used by Professional Traders
⭐️ The right shoulder is more important than the left
⭐️ A taller head indicates a stronger reversal
⭐️ Volume should decrease on the right shoulder
⭐️ Higher timeframes = higher reliability
⭐️ Best entry is after the pullback
🔹 7. Common Mistakes Traders Make
❌ Entering before the neckline is broken
❌ Confusing random peaks with a structured pattern
❌ Ignoring volume behavior
❌ Setting stop-loss levels too tight
❌ Trading the pattern in a sideways market
🔹 8. Final Summary
The Head and Shoulders pattern is one of the most trustworthy reversal signals.
A professional trader should always:
✔️ Confirm the prior trend
✔️ Identify the three-peak structure
✔️ Check volume behavior
✔️ Wait for a valid neckline break
✔️ Prefer pullback entries
✔️ Set proper SL/TP
✔️ Use higher timeframes for accuracy
With consistent practice on TradingView historical charts, you can master this pattern and use it as a profitable tool in your trading strategy.