♡4"indicators1. What are indicators?
Indicators are statistical tools used by traders to analyze and interpret market data, with the goal of identifying trends, patterns, and potential opportunities for trading.
These tools are based on mathematical calculations applied to various types of market data, such as price and volume, and can help traders make informed decisions based on historical trends and patterns.
2. Why use indicators?
The use of indicators can provide traders with a wealth of information about the market, including the direction of the trend, the strength of the trend, and potential entry and exit points for trades. By using indicators, traders can make more informed decisions, based on objective data rather than emotions or guesses.
☆
Commonly used indicators:
There are many types of indicators that traders use, including moving averages, relative strength index (RSI), stochastic oscillator, Bollinger Bands, and more. Moving averages are used to identify trends, while RSI and stochastic oscillator are used to measure the strength of a trend.
Bollinger Bands are used to identify potential breakouts and to determine the volatility of the market.
☆
3. Visual backtesting provided indicators.
Visual backtesting refers to the process of testing a trading strategy using historical data.
By using backtested indicators, traders can gain insight into how a particular strategy would have performed in the past, and can use this information to improve their current trading strategy.
This process is particularly powerful when using provided indicators, as they are typically based on historical data and have been tested by experienced traders.
☆
Risk and psychological management:
While indicators can provide traders with valuable insights into the market, it's important to remember that they are not foolproof.
Traders should always practice proper risk management, such as setting stop-loss orders to limit potential losses.
Additionally, it's important to manage psychological factors, such as greed and fear, which can often cloud judgment and lead to poor decision-making.
☆
Acknowledgemt
Indicators are powerful tools used by traders to analyze and interpret market data, with the goal of making more informed decisions.
By using visually backtested provided indicators and practicing proper risk and psychological management, traders can increase their chances of success in the market.
4. Moving Average (MA) influenced indicators.
Commonly used indicators by traders to identify trends in the market are influenced with a MA calculation.
By smoothing out the price action over a set period of time, MAs can help traders determine the direction of the trend, as well as potential entry and exit points. When combined with signals, plots, and alerts, MA influenced indicators can provide even more valuable information for traders.
" # One of the benefits of MA influenced indicators is that they can help traders identify the beginning and end of trends. By plotting the MA on a chart and analyzing its slope and position relative to the price action, traders can determine whether the trend is bullish or bearish. Additionally, by using signals, plots, and alerts, traders can receive notifications when the MA crosses above or below the price, indicating potential changes in the trend. "
RSI 4, on the other hand, is a momentum oscillator that measures the strength of a trend.
By analyzing the magnitude of price movements, RSI can provide valuable information about the underlying strength of the market.
When used in conjunction with MA influenced indicators, traders can gain a more complete picture of the market, including both the direction and strength of the trend.
☆
For example, when the MA is sloping upward and the price is above the MA, indicating a bullish trend, a cross above 91 on the RSI 4 may indicate an overbought market, and a potential opportunity to sell while conforming the crossbelow 91and commonly followed by a divergence.
Conversely, when the MA is sloping downward and the price is below the MA, indicating a bearish trend, a cross below 9 on the RSI 4 may indicate an oversold market, and a potential opportunity to buy in conlfuences of the crossabove 9 and a divergence.
☆
In summary, MA influenced indicators, when used in conjunction with signals, plots, and alerts, can provide valuable information about the direction of the trend, as well as potential entry and exit points.
When combined with momentum oscillators like RSI 4, traders can gain a more complete picture of the market, including both the direction and strength of the trend, and use this information to make more informed trading decisions.
●
"Trading is a game of probabilities, where each trade is simply a bet on the likelihood of a particular outcome.
While losing trades can be frustrating, they are an inevitable part of the game, and a necessary cost of doing business.
In fact, losing trades can be just as valuable as winning trades, as they provide valuable feedback and can help traders refine their strategy, ultimately leading to greater success in the long run."
●
J @ATU_TAD
♡4"indicators
Beyondtechnicalanalysis

My Impulse Channeling techniques!If you find this info inspiring/helpful, please consider a boost and follow! Any questions or comments, please leave a comment!
Well they are not mine, just some techs
I use when dealing with impulses.
A bit of KCT.
A bit of Elliott wave and Elliot wave
All consistently used in my analysis.
If helpful, throw me some love and
I'll post some techs on channeling corrections.
Cheers!

The Process of Creating StrategyHello traders,
In this post i am going to show that how we can create and develop the trading strategy that works.
Now the first step we need to do is just search and find the any trading method that suitable for us for example that would be like elliott wave, ict concept, VSA, just using indicators and maybe you can also create your own method and backtest it. when you learned the method now its time to create your trading rules every strategy has own different rules like what is your risk to reward ratio? what is your trade management plan? either you manage your trade or just take the trade and come back after its hit TP or SL, how much is your daily limit means how much trades you will be taking in a day or in a week if you want to become a swing trader depends on you, what is your risk per trade? can you will be cutting the risk to half or just use fixed risk after lose trade? what is your daily limit of losing? can you hold trade overnight or over weekend? what is your trading timeframe? what is your trading sessions? etc...
These all kind of rules you will be require to create for yourself they might be different rules depends on your strategy method now we learned the method and created the rule move forward to the next step is open the live demo trading account and trade with your strategy and apply the rules don't break the rules that you created trade at least 30 days and journal your data your taking trades after 30 days check the journal you will see your data for example in your rules you set 1/2 risk reward ratio so you need to have around 40% winning ratio check the journal check the results did you have a 40% winning ratio if the answer is yes then good to go i am sure that you know what to do next but if you failed and your winning ratio is below 40% now analyze your journal data the trades you taken you will see some of bad trades that you don't wanted to trade again just avoid those trades next time and try again the process for the next 30 days. repeat the process one day you will be profitable and consistent but if you not then try again again learn from your mistakes and don't do that mistakes again.
When yo have been profitable this is the time you wanna enter in the market open the real live trading account and start trading with your strategy and follow the rules that you created for yourself run the process and always remember trading is not quick rish scheme you need to have a lot of patience, trading is a long run game like marathon race and its required patience. some of my advice is don't try to break the rules, don't depend on one trade, some times market will give you some results that you don't want from it but be patient and be consistent with your strategy with your rules, you will be facing drawdowns but that is the learning process you will learn a lot from the drawdown so with the time you will be better consistent and be profitable just don't leave the process too soon and believe in yourself and try again again and again, trading is a very beautiful and also the easiest thing to live life but firstly in the starting it required from us to pass the test. trading is a very easiest thing but also a very hardest thing. i hope you find this post useful, i wish you good luck and good trading.
If you like the post, boost my work with like comments and share thanks!

🧊The Iceberg Illusion In TradingThe iceberg illusion in trading refers to the perception gap between what people think trading is and what it actually means. Many people see trading as a simple way to make quick profits and accumulate wealth, with the idea that all one has to do is buy low and sell high. However, the reality is far more complex. Under the surface of what appears to be a straightforward process lies a world of risk, stress, and uncertainty. Trading is not just about making money, it requires discipline, patience, and a deep understanding of the markets. Those who don't understand the true nature of trading may face financial loss, depression and failure, much like the hidden dangers beneath the surface of an iceberg. Success in trading often requires much more than just a basic understanding of market trends and patterns, and those who dive in without being fully prepared may face dire consequences.
🔷 Above the Iceberg
Above the iceberg, people often see the glamorous and attractive side of trading, characterized by success, wealth, and financial independence. They imagine traders as confident and knowledgeable individuals, making smart decisions and reaping the rewards of their investments. The image of traders making large profits in a short amount of time is one that is often perpetuated by media and popular culture. People often see the stock market as a fast-paced, exciting place where opportunities for financial gain are abundant, and the idea of being able to control one's financial future through trading is alluring. This perception of trading often creates a rosy and idealized image of what it entails, leading many to believe that success in the markets is easy to achieve.
🔶 Bellow the Iceberg
Below the iceberg, lies the reality of the challenges and difficulties that traders face on a daily basis. There are many hidden risks and uncertainties that are not immediately apparent to those who are new to the world of trading. Some of the things that people don't know that lie beneath the surface of the iceberg include:
🔸 Market volatility:
The stock market is a highly volatile environment, and prices can fluctuate rapidly and unpredictably. This can make it difficult for traders to manage their positions and minimize their losses.
🔸 Emotional stress:
Trading can be a highly emotional experience, and the pressure to make the right decisions can be immense. Many traders struggle with anxiety, fear, and depression, particularly when faced with losing trades.
🔸 Lack of understanding:
The stock market is complex, and it can be difficult for traders to understand all of the factors that influence market trends and prices. This can lead to costly mistakes and an increased risk of financial loss.
🔸 Competition:
The stock market is a highly competitive environment, and traders must be able to keep up with fast-moving markets and make quick decisions based on complex data and information.
🔸 Long-term success:
Many traders are focused on short-term profits and may not consider the long-term impact of their trading decisions. Achieving lasting success in the markets requires a well-thought-out strategy and a strong understanding of the markets and the risks involved.
🔸 Timing:
Successful trading often requires precise timing, as markets can change rapidly and prices can fluctuate. Traders must have a deep understanding of market trends and be able to make quick decisions to take advantage of opportunities.
🔸 Risk management:
Trading involves risk, and traders must be able to manage their positions and minimize their losses. This requires a well-planned and executed risk management strategy, including setting stop-losses and taking profits at appropriate levels.
🔸 Knowledge and experience:
Trading is not just about buying low and selling high. It requires a deep understanding of market trends, economics, and financial analysis, as well as years of experience to develop a successful trading strategy.
🔸 Discipline:
Trading requires discipline and patience, as well as the ability to stick to a well-thought-out strategy. Many traders make impulsive decisions based on emotions or market rumors, which can lead to financial losses.
Welcome to the hardest game in the world.
👤 @AlgoBuddy
📅 Daily Ideas about market update, psychology & indicators
❤️ If you appreciate our work, please like, comment and follow ❤️

🧠 The Mind Of A Smart TraderTrading psychology is influenced by emotions like greed and fear, which can drive irrational behavior in markets. Greed causes excessive risk-taking and speculation, while fear causes traders to exit positions prematurely or avoid risk. Regret can also cause traders to violate discipline and make trades at peak prices, leading to losses. These emotions can be particularly prominent in bull or bear markets and can have a significant impact on market outcomes. Trading psychology is a crucial factor in determining success in trading securities. It includes aspects of an individual's character and behavior that affect their trading decisions. Discipline and risk-taking are critical components of trading psychology, as is the impact of emotions like fear, greed, hope, and regret. It can be as important as knowledge, experience, and skill in determining trading success.
🧠10 Trading mindset tips:
🔹 Stay informed: Stay updated with the latest market news, trends, and developments, as well as your preferred assets.
🔹 Create a trading plan: This should include a clear set of rules for entry, exit, and risk management. Stick to your plan.
🔹 Manage your emotions: Avoid making impulsive decisions, especially during volatile market conditions. Keep a clear head and stick to your plan.
🔹 Continuously educate yourself: Enhance your knowledge and skills by reading books, attending seminars, and practicing with demo accounts.
🔹 Diversify your portfolio: Spread your risk across different assets and markets to reduce your exposure to any one particular market.
🔹 Stay disciplined: Follow your plan and stick to your rules, even if your emotions are telling you otherwise.
🔹 Set realistic expectations: Be mindful of your limitations and don’t overreach. Accept small losses and focus on long-term success.
🔹 Stay focused: Avoid distractions and keep your mind on your trading activities.
🔹 Keep a trading journal: Record your trades, track your progress, and reflect on what you could have done differently.
🔹 Take breaks: Avoid overtrading, which can lead to burnout. Take time to recharge and come back fresh.
👤 @AlgoBuddy
📅 Daily Ideas about market update, psychology & indicators
❤️ If you appreciate our work, please like, comment and follow ❤️

Develop your trading psychology There are 2 types of edges in trading, a trading strategy edge and a trading psychology edge.
You need to have both to succeed.
This post will focus on how to develop your mental edge, which is the more important of the 2 types.
The process of developing a trading psychology edge is simple, but usually not easy.
Start trading
Identify your advantages and weaknesses
Find solutions to your weaknesses
Review your results
Repeat steps 3 and 4 until you reach your goals
In this post, I'll give you strategies to uncover your trading genius and overcome your biggest roadblocks.
Keep reading to learn the details of each step.
1. Start Trading
This step might seem obvious to some people, but it won't be to others, so I'm going to talk about it.
In order to develop a mental edge in trading, you have to engage the markets on a regular basis.
Even if you only demo trade, taking trades will start to expose your psychological strengths and weaknesses, within the context of trading.
Here are some things that you might discover after you begin trading.
You're afraid to take trades
It's easier for you to follow a rules based trading strategy
You have a tendency to revenge trade
You're good at riding trends
You take good notes
You don't like backtesting
You get easily discouraged after a series of losses
That's just a short list of what could come up for you.
But you'll only discover these things when you go through the process of taking trades and experiencing the emotional ups and downs that come with wins and losses.
Once you've taken some trades, now it's time to take an inventory of your strengths and weaknesses.
2. Identify Your Advantages and Weaknesses
How many times have you experienced an event with a group of people and they noticed things about the event that you missed?
This is because they were aware of those things and you weren't.
You also probably noticed things that they didn't.
That shows that we will only notice things that we place our awareness on.
So start a trading journal and write down what you're good at and what you aren't so great at, while you're trading.
This is the first step to full awareness.
The things you do well will give you clues as to what you should probably focus on in trading.
For example, if you find it easy to follow a trend on the daily chart, then you should probably work on trading some sort of trend following, swing trading strategy.
If you lose a lot of money when you day trade, then that's probably something you should avoid.
Maybe you live in a timezone that makes it difficult to trade the New York Forex session. Then you could work on a strategy that trades the Asian session or the London open instead.
Like with any other skill, there will be things that are optional, and there will be things that you have to change.
In the case of day trading versus swing trading, you don't have to day trade. You can trade on other time frames, so being bad at day trading is not a problem.
But let's say that you have a tendency to over trade and revenge trade.
That's a problem that has to be fixed if you want to become a successful trader.
So find ways to amplify your strengths.
That's pretty easy.
3. Find Solutions to Your Weaknesses
The great news is that there are a ton of solutions out there to help you overcome anything you're working on.
You simply have to do the work to seek out these solutions and implement them.
I cannot list all of the strategies available because there are so many of them.
But I'll get you started with the 2 general categories.
I believe that there are only 2 parts to the human mind, the conscious and subconscious.
Yeah, you probably knew that already.
However, I feel that many therapists and coaches don't understand how to apply this concept effectively. Many are trained in a particular type of treatment. Most only follow the doctrine of that modality and think that everything can be solved through that lens.
Obviously, the more aware ones understand the limitations of their craft. But there are many who do not.
Not entirely their fault. They don't know what they don't know.
There are a lot of things that I don't know either.
But I do know that it's up you to you to use your intellect to figure out what will work best for you.
That said, let's take a look at a real example of why the conscious/subconscious theory is so important.
I have a friend who used to smoke. If you know a smoker, or you were a smoker, you know that it can be one of the toughest habits to break.
But guess how he quit?
He was on a smoke break at work one day…
He looked the the cigarette, and thought “This is dumb.”
So he quit cold turkey, on the spot.
That's it.
How was that possible?
I don't think that anyone knows for sure, probably not even him. But here's my theory…
There's always a reason why we do things. Our actions fulfill a need or desire in our mind.
Sometimes the cause of a desire sits in our conscious mind. But many times it sits in the subconscious mind.
I believe that the cause of his smoking habit was in his conscious mind. So he could use a conscious thought to change the behavior.
That's why it was so easy.
Now if the source was in his subconscious, even though he knew that smoking was a waste of time and money, it would have been much harder to quit.
So when you look for methods to help you change your behaviors, start with the conscious methods first because those will give you the easiest wins.
But if you cannot change with those methods, then it's time to go deeper and dive into your subconscious.
It's not always possible to figure out if a behavior is caused by a subconscious or conscious source. It can also be difficult to figure out which part of your mind a treatment will work on.
That's OK.
Do your best and you'll get a good feel for it after trying a few different things.
What about your weaknesses?
That will probably take a little more effort.
Here's how to get started with overcoming them.
Conscious Mind Methods
Methods for changing thoughts in your conscious mind usually involve mental visualization exercises, repeating affirmations or visual cues.
Neuro linguistic programming (NLP)
Mind Movies
Visualization
Vision boards
Mantras
Talk therapy
Subconscious Mind Methods
Changing your subconscious mind is a new concept to many people and it's probably new to you too. The reason why this works may not be obvious at first.
You're basically digging down into your subconscious and bringing the causes of your negative behavior to the surface. When you do this, it's much easier to resolve the issue so the symptoms never come up again.
This can be very powerful stuff and you really have to experience it believe it.
Subliminal recordings
Hypnosis with a therapist
Cloud Sound Therapy
The Emotion Code
Clairvision
Again, this is just a short list of what's out there. But it will give you a great starting point.
4. Review Your Results
Now it's time to see how you've done.
Sit down on a Sunday morning with a coffee (or your favorite drink) and review your trading journal again.
Did the methods you used work?
If yes, then great, you're done! You can stop reading right now.
However, it's more likely that you still have things that aren't completely resolved.
That's just how it works.
Unfortunately, modern mass marketing has given us the impression that there's always a pill or hack that we can use to instantly achieve any outcome that we want.
In reality, that's rarely the case.
It's like mining. Miners almost never hit gold on the first try.
They usually have to do a lot of homework and drill several holes before they find a workable mine.
So put down your discouragement and dig your heels in for the long haul. Your transformation could be fast, but it's more likely that it will be a process.
That's how your great grandparents did it, along with every generation before them.
The idea of instant results is a new and often unrealistic ideal.
5. Repeat Steps 3 and 4 Until You Reach Your Goals
Instead of getting discouraged, do this:
Congratulate yourself for taking action.
Celebrate what did work. It's very likely that you made some progress, no matter how small.
Look for the next thing to try. Assuming you gave the first thing an honest try, it just might not have been a good fit for you.
I've had many cases where this has happened in my life.
For example, back in the day, I used to listen to a lot of Tony Robbins recordings. He's great, I have nothing against Tony.
However, I put too much faith in the idea that he had all the answers. I figured that since he had so many high-profile clients, he must have a solution that could help me.
So I would listen to his tracks over and over, and implement the strategies…over and over.
…and they did help a little.
But they didn't create the big shifts that I was looking for.
Instead of continuing to do something that didn't work, I should have reassessed my results after a few weeks, then tried something else. I just didn't know any better back then, and I'm OK with that.
It literally took me years to figure out that I needed to branch out and try other things.
I want you to learn from my experience.
If you didn't get the results that you expected, then don't get down on yourself.
Remember that one of the the most powerful tools that you can have in your trading toolbox is self-forgiveness.
It will take as long as it takes for you to become successful at trading. So get back up on your horse and keep going.
Of course, there can be the tendency to have “shiny object syndrome,” where you keep hopping to the next new thing. So you have to be honest and ask yourself if you've given the method an honest try, before moving on.
Only you can answer that question.

Price Action Part-6, Nifty option trading#nifty
#priceaction #priceactiontrading #optionanalysis #banknifty #bankniftyprediction
#nifty50 #niftytomorrow #niftyprediction #niftyanalysis #niftyfifty #niftytoday #niftybank #banknifty #bankniftytomorrow #bankniftyprediction #bnkniftytrading #charts #technicalanalysis #crypto #sensex #nse #nseindia #bse #optionsellingstrategy #optionstrading #optionsellingstrategy #optionstrategy #optiontrading #optionsellingstrategy
Bank Nifty Option Trading Earn daily Profit in stock market || Bank Nifty Options Trading for Beginners | Earn daily Profit in Bank Nifty Option Trading in Share Market -
bank nifty option trading kaise kare.
option trading kaise karte hain.
option trading profit.
bank nifty option trading strategy.
bank nifty option trading strategy,
bank nifty,
nifty options trading strategies,
nifty option trading strategies,
option trading strategies,
option trading,
options trading for beginners,
intraday trading,bank nifty strategy,
bank nifty intraday option strategy,
share market basics for beginners,
bank nifty option trading,share market,
bank nifty daily option strategy,
nifty intraday trading strategies,
option trading for beginners,
bank nifty trading strategy,
put options trading for beginners.
For More Stock Market Videos Please Subscribe Our Stock Market Etutor You Tube Channel.
Disclaimer:
This Video is for educational purpose only. These are just my personal view based on my previous research and analysis. I am not a sebi registered analyst. Kindly please consult your own financial adviser or do your own research before taking kind of Trading action on my views.
I and my channel "The Gurukool" won't responsible for any kind of loss u incur if you trade on this views.

Specific Trendline to Determine the Direction of any MarketHow to identify the specific points for trendline to determine the direction of the market? In this example, I am using the Nasdaq index.
You can use this trendline technique to any markets because its principles in this tutorial are applicable throughout whether to an individual stock, indices or even commodities.
I am going to introduce the primary and secondary trendlines, I hope after this tutorial, it will bring greater clarity in how you can deploy them.
Disclaimer:
• What presented here is not a recommendation, please consult your licensed broker.
• Our mission is to create lateral thinking skills for every investor and trader, knowing when to take a calculated risk with market uncertainty and a bolder risk when opportunity arises.
This method I just shared, it can be applied to any market and any timeframe, be it the minute chart or the weekly chart.
Micro E-Mini Nasdaq
0.25 = US$0.50
1.00 = US$2

Is this recent rally a bull rebound of a bear retracement? To make an assessment if the market has turned bear, during the closing second quarter on 29th June 2022, we discussed on the topic “Using S&P to Identify Recession
and on the 19 Jul, 2 weeks ago the tutorial posted here, we studied and expecting this current rebound, topic “Nasdaq a leading indicator of Dow Jones, S&P & Russell”.
In today’s tutorial, I thought of doing a recap between the two videos and explore if the current market and its development, if it is a bull rebound heading to break another new all-time high or if it is a bear retracement?
I have included both the video links below.
Before we get into this topic, please also take some time to read through the disclaimer in the description box below.
Disclaimer:
• What presented here is not a recommendation, please consult your licensed broker.
• Our mission is to create lateral thinking skills for every investor and trader, knowing when to take a calculated risk with market uncertainty and a bolder risk when opportunity arises.
Tutorial example:
Micro E-Mini Nasdaq
0.25 = US$0.50
1.00 = US$2
(12,900 - 11,900) x US$2
=US$2,000
(Note: Opposite is also true)
• During the closing second quarter in June, on 29 Jun - “Using S&P to Identify Recession
• On the 19 Jul, 2 weeks ago - “Nasdaq a leading indicator of Dow Jones, S&P & Russell”

What to include in your Trading RoutineMost people dive straight into trading without knowing how or why. They also don’t plan ahead.
This is why most people are unsuccessful at trading.
Having a well developed plan is KEY 🔑 to trading success!
Let’s see what in must need in trading routine:
1. Trading Journal 📝
You won’t improve without a trading journal, your whole trading routine is built around your trading journal. The time you’re trading without one is wasted time period.
2. Backtest 📌
Do it every week at least once.
Backtesting increase:
- Confidence in your strategy;
- Self-confidence to execute it;
- Discipline (when you’re confident about your strategy, you are more likely to respect it.)
Tip: Journal your backtested setups.
3. Weekly mental preparation ⏳
Write down things like:
- What are the things you want to work on.
- What are the habits you want to improve.
- What are your goals for next week.
4. Technical preparation 💡
- Make your analysis.
- Study the different price scenarios.
- Prepare your trading ideas.
You can do it weekly or daily depending on your needs.
5. Weekly performance analysis 🎭
Open the psychology section of your trading journal:
- What did you do well?
- What could have you done better?
- What lessons did you learn?
- Realization about yourself, your strategy and the market.
6. Wins and Losses analysis 🌓
- Open the charts of your trades one by one.
- Read your mistakes
- Write down at least one lesson you took from each trade.
Tip: always take a screenshot at the exact entry point of each trade. This allows you to mitigate the hindsight bias and develop your pattern recognition skills.
7. Writing ✏️
Write down your thoughts and emotions on bad days.
It helps you understand your mind and gives you clarity.
It’s a great way to focus on the process and be patient.
8. Activities outside of trading 🚴🏻♀️🚣🏻♂️
You’re going to lose motivation and belief with your trading many times, you need to have extra motivational source.
If you only rely on your trading results to feed your persistence, you ganna give up easily.
If you like this content help me grow ❤️🌱
I’d be happy you add more tips to learn from each other

LET'S GET REAL: Fear of Losing! Hey Traders,
Most traders battle it. I myself had to progress past this in order to achieve consistent returns trading the markets. It is seen as one of the hardest challenges to pass in terms of emotional discipline. Understanding yourself better so you can make decisions in a calm, composed and consistent manner is crucial to success.
Today I wanted to touch on that. I wanted to talk about the fear of losing what spurred from my fear of losing, how I progressed through it (it still creeps in from time to time). Hopefully you can take from my story and how it improved your trading or how it can help you progress past that fear of losing.
If anyone has any questions or maybe some other stories in the way they progressed through a fear of losing or a fear of being a failure, please feel free to share in the comments and I'll get back to you as soon as possible.
Have a fantastic trading week!

This is happen 🐻📉📈🐂😎I am always bullish in bitcoin because of this 🚀🤙....you just accumulate more & more & you always become's super rich ...so don't panic if btc crash 90% it's just crash 😌🔻not end ! ... 10000% I am sure btc take parabolic after this is happen 💥🤛 so get ready ( & follow for more 🤝 )

My 5 Year Forex Journey so FarIf there is one thing to remember, it's that life is precious.
What may appear to be a setback is really a stepping stone towards
a better tomorrow. That's the one thing that really separates us from the
animals. They are not aware of the the Future. They have instincts built into their
complex physiology. This is also what makes them innocent. But awareness of the future
is a key distinction. If you you observe criminal psychology, criminals are quite impulsive.
They may cut corners to achieve their goals (Short-Sighted) and this lands them in custody of the more civilized and organized
humans. It is in our nature to pursue goals, because this is how we experience positive emotion. Setting goals has turned my life around, please here this, digest it.
I was on a devastating treacherous descent into the underworld. Immature, Impulsive, Addicted, Lost, Disgusted, these words describe a mindset, an attitude.
The underworld, let me tell you, was quite the experience. I feared for my life, and the health of my loved ones. "How?" I asked myself repeatedly.
Is this what I wanted for myself?
This is what I manifested, really?
Dear God. Help my soul.
Help me Take this 1 day at a time
Help me take it 1 minute at a time if that's what is necessary
Help me restore my dignity
Not from Society
Not From Others
Not even from God
I need to believe that I am worth it
I am worthwhile
I am a good person
I am just a man
I am am an imperfect man
I am an Ignorant Man
I am an Incomplete Man
I am a partially Broken Man
I am vulnerable Man
I am a tough man
But most importantly I am an unstoppable man. And to be quite honest, it doesn't matter what you think.
Because I can manifest anything my heart desires.

Trends in Technical Analysis 📈📈✨What are the trends in technical analysis and what is its application in digital currencies such as Bitcoin and other cryptocurrencies? In the second part of the tutorial, we will look at the trends.
The concept of trends is definitely one of the principles of technical analysis. All the tools that we will teach in the following are created from patterns, oscillators, support and resistance levels, indicators, and with the aim of helping to measure the price trend. Even if you have been in the market for a short time, you must have heard the words, "Trend is your friend", "Always trade in the direction of the trend", "Never fight the trend". These are common phrases that you often hear in the market. So we need to take the time to define the process and know its types.
Bitcoin price chart consists of uptrends, downtrends and neutrals
John Murphy describes the trend in her valuable book, Technical Analysis of Financial Markets:
The market never moves in a straight line. Market changes are characterized by a series of zigzag movements. We call these market zigzag movements. The result of the motion of these waves is TREND.
✨Classification of trends in technical analysis
▪️ Uptrend
The uptrend is defined as a series of ascending waves. Charles Dow defines an uptrend as follows: "When a price is higher on an uptrend than the previous uptrend, or when the price is on a downtrend above the previous uptrend, we have an uptrend." In other words, the uptrend is a pattern of upward fluctuations.
An uptrend indicates a greater power of demand or purchase over supply or sales, referred to as the "BULLISH market".
The uptrend in technical analysis is the result of several uptrends
▪️downward trend
The downtrend is formed as a series of downward waves. Charles Dow described the downtrend as exactly the opposite of what was said about the uptrend. This means that whenever the price is lower in a bearish wave than the previous bearish wave or the price is lower in a bullish wave than in the previous bullish wave, we have a bearish trend.
A downtrend indicates a greater supply or demand power over demand or a buy, a "bearish market".
The downtrend in technical analysis is the result of several downtrends
▪️ Range trend
The Range trend consists of a wave or waves of ascending and descending that have a direct direction. In other words, if the price can not go above the peak of the uptrend or the price can not go below the bottom of the downtrend, we have a Range trend.
A Range trend indicates a relative balance between buyer and seller power or market supply and demand. "Range market" refers to this trend.
The Range trend in technical analysis is the result of several neutral waves
✨So far, we have defined the concept of trends in financial markets. We may be trending in the market but we need another tool to confirm our diagnosis, trading volume is the tool we need. According to Dow, trading volume is a secondary but important factor in confirming warnings derived from price analysis.
In general, keep in mind that trading volume should be in line with the direction of the main trend.
In the uptrend; Each ascending wave is accompanied by an increase in volume and each descending wave is accompanied by a decrease in volume.
Trading volume should confirm an uptrend
In a downward trend; Each descending wave is accompanied by an increase in volume and each ascending wave is accompanied by a decrease in volume.
If you have any questions, comment for me🔥🔥

History of ForexHistory of Forex
We have come a long way from the previously practiced barter system to the modern-day system of trading currency. Following is a brief summary of the evolution of currency and how it gave rise to Forex Trading.
Here are the main stages that are illustrated on the chart:
1️⃣The Ancient system of Trading - Trading with Gold
As early as 6th century BC , the first gold coins were produced, and they acted as a currency because they had critical characteristics like portability, durability, divisibility, uniformity, limited supply and acceptability.
2️⃣Bank Notes Originated - Deposited Gold in banks in exchange for banknotes
3️⃣Role of Geography - Various banks of different regions printed different currencies
Gold Standard - Currency pegged to gold
In the 1800s countries adopted the gold standard. The gold standard guaranteed that the government would redeem any amount of paper money for its value in gold . This worked fine until World War I where European countries had to suspend the gold standard to print more money to pay for the war.
4️⃣Bretton Woods System - Currency pegged to USD
The first major transformation of the foreign exchange market, the Bretton Woods System, occurred toward the end of World War II.
The Bretton Woods Accord was established to create a stable environment by which global economies could restore themselves. It attempted this by creating an adjustable pegged foreign exchange market. An adjustable pegged exchange rate is an exchange rate policy whereby a currency is fixed to another currency. In this case, foreign countries would 'fix' their exchange rate to the US Dollar .
5️⃣Birth of Floating Currency - Currency that is not pegged to any assets or other currencies is known as a 'floating currency'.
And what will be next?
Very hard to say but blockchain technologies will make the system change again.

Your Ultimate Guide to RSI DivergenceYour Ultimate Guide to RSI Divergence (Settings & Tips)
Hey traders,
Relative strength index is a classic technical indicator.
It is frequently applied to spot a market reversal.
RSI divergence is considered to be a quite reliable signal of a coming trend violation and change.
Though newbie traders think that the application of the divergence is quite complicated, in practice, you can easily identify it with the following tips:
💠First of all, let's start with the settings.
For the input, we will take 7/close.
For the levels, we will take 80/20.
Then about the preconditions:
1️⃣ Firstly, the market must trade in a trend ( bullish or bearish )
with a sequence of lower lows / lower highs ( bearish trend ) or higher highs / higher lows ( bullish trend ).
2️⃣ Secondly, RSI must reach the overbought/oversold condition (80/20 levels) with one of the higher highs/higher lows.
3️⃣ Thirdly, with a consequent market higher high / lower low, RSI must show the lower high / higher low instead.
➡️ Once all these conditions are met, you spotted RSI Divergence.
A strong counter-trend movement will be expected.
Also, I should say something about a time frame selection.
Personally, I prefer to apply it on a daily time frame, however, I know that scalpers apply divergence on intraday time frames as well.
❗️Remember, that it is preferable to trade the divergence in a combination with some price action pattern or some other reversal signal.

The importance of the STOPLOSS protective orderThe importance of the STOPLOSS protective order
Our protective stops are vital to managing our risk, and just a single position you open without a stop can lead to the suicide of your trading account.
The uniqueness of stop orders lies in the fact that they, being pending orders, await their execution at a predetermined price. When stop orders are triggered, their important function is that they add momentum to the market and at the same time use the liquidity present in the market.
1)
Many have probably heard such information as: "When entering a trade, place a protective stop just below the high / low of the price." The reason is that this level has been identified as an important support level .
What else is posted in the support area? Limit orders of traders to buy, who have identified the support area and are waiting for the time to open a position when retesting the level.
Is there a large number of stops under each level? It depends on the size of the timeframe and how quickly the price leaves the given zone at the time of purchase.
2)
When the price gets to this level, traders are still interested in long positions, but this time the price does not bounce off that level as one would expect. It does not break it, does not make lower lows, but displays lower highs.
If you were interested in going long right now, what would you do? The average trader who bounces off the support level would enter a long position with a stop just below the support level . If you had a limit order that hadn't been filled yet, I would have postponed the order.
Candlesticks / Bars displays lower highs; The price does not rise as fast as one might expect; You know that just below the support area there are a lot of stop orders.
3)
What happens next? The price moves downward under pressure and breaks the stops of traders who have long positions, and, as we remember, when buy stops are triggered, these are market sell orders, and they force the price to move further down.
And traders, who are waiting for the opening of short positions, open them because the price breaks the support level , but then the market takes them out, “eats” them, because the price goes higher.
4) Those traders who were initially set for long positions and who were thrown out of the market by broken stops help push the price up. Now the graph looks like this:
New stops are placed below the new level, in front of us is Groundhog Day. And everything that has just been played will be played over and over again ... only at different price levels.
STOPLOSS is a way to limit losses when managing an open trading position or portfolio of positions. In fact, a stop loss is an order to close a position in the event of an unfavorable price movement.
The trader sets a stop loss to limit his own losses and trade within his own money management rules.
Find me on:

Create Alerts And Wait PatientlyCreate Alerts And Wait Patiently
There are two key steps to creating alerts:
1. Find Important Price Levels
Do your research. Find a price level that looks important and wait. Patience is everything. You have all of the tools available to you to research and follow markets. Whether it's a simple trend line , moving average or a custom Pine Script, use the tools to make better decisions.
2. Create The Alert
Once you've found a level that interests you, create an alert and walk away. Right-click on that exact price level and then select "Create Alert" from the menu. You can also use the keyboard shortcut Alt + A or on a Mac option + A. Lastly, at the top of every chart is an alarm clock icon ⏰. Click that to open your alert menu and get started.
The chart in this example shows a level we're watching. It also shows the alert we created. We have our eyes on a possible Double Bottom and we made an alert to watch that level. We'll get notifications on our TradingView mobile app, through email, and on our desktop. We won't miss it. 😁
Alerts can help you plan ahead and wait. We all know patience is important. So use alerts to express that patience.
Thanks for reading and we look forward to hearing your feedback in the comments below!

Understanding Market StructureLets start
1) Consolidation
The market enters this phase after a strong movement. Sellers control buyers, which further leads to a downward trend
2) Down trend
Bearish phase - lower lows and lower highs. This is where traders want to go short on breakouts or from levels
3) Distribution
Occurs after a prolonged fall in prices, when buyers gain control of prices, resulting in higher prices
4) Up trend
The bull phase is where you want to be long. See to buy short breakout moves after long rallies have exhausted themselves. Attempts to rally are considered guilty until proven innocent
-------------------
Share your opinion in the comments and support the idea with likes.
Thank you for your support!
thankyou

What is impulse and how to make money on it?What is momentum and how to make money on it?
Momentum is a sharp paranormal price movement in one direction or another, unusual for average daily fluctuations of an asset
How to build zones from which impulse movement is most likely to occur?
1) The price is pushed back from the previously built level
2) There is an impulse movement in the other direction
3) Correction to the level, from which the price pushed a little
4) consolidation, consolidation below the level, from which there will be an impulse movement
How it works?
1) the level above which the price consolidates and repels
2) Rollback from the price level at the moment
3) Impulse that breaks the level
4) We need to extend the level to understand where the key point will be
5) Fixing the price below the level
6) In anticipation of an impulse movement, at the very beginning of the movement, after fixing, we open an order
*** Works in the same way in long
What do you need to do, what to earn on this?
1) If you use impulses not all in a row, but the very first one after a trend reversal, then we have a chance to pick up all the movements, it all depends on your benchmarks, where you exit the market, according to your strategies.
2) Not every impulse level is the first, we estimate the situation from strong levels, from which the price can reverse
3) We focus on the opening of the session, the chance that the market will reverse at the end of the working day and give you less profit if it is at the beginning.
It is important to understand:
Price moves from level to level
The price does not always fix directly below / above the level
You can work both on the younger (m5, m15, m30, h1, ch4) and on the higher timeframes (d1, b1, m1 )
The older the timeframe, the stronger the level from which an impulse can follow
During an impulse, funds are injected, a large player enters the market or a major player exits the market, stops-losses are collected, i.e. removal of market participants.
Our goal is to follow a major player who leads the price and get profit from it

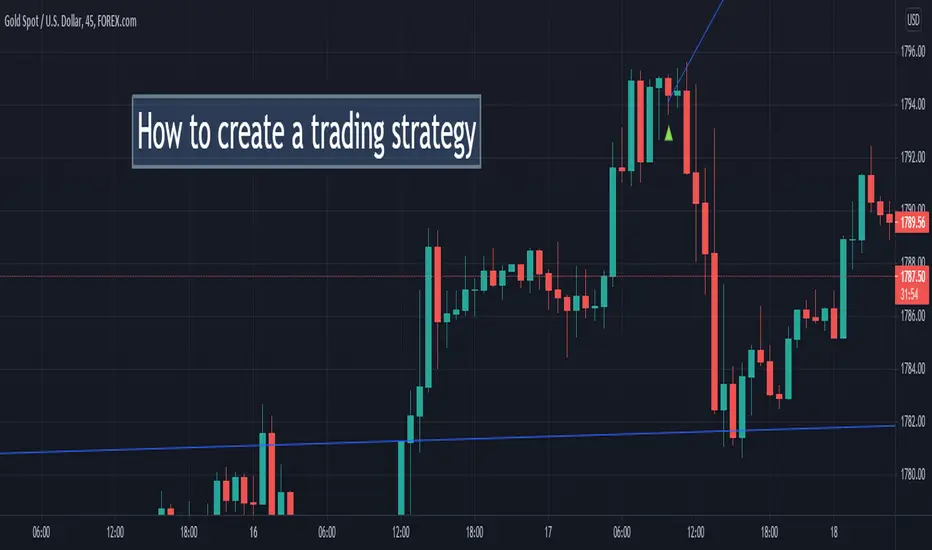
How to create a trading strategy?HOW TO CREATE A TRADING STRATEGY?
WHAT IS A TRADING STRATEGY?
Trading rules that systematize it, bring clarity, orderliness and predictability of the result. You can take a ready-made strategy and adapt it for yourself. And you can create your own
The main idea of the strategy, its rationale
The idea should be rational, based on market patterns that you understand. For example, trading with a trend or pullbacks. On technical or fundamental analysis , with or without indicators
A good trading strategy is not complicated, but simple. A large number of rules makes the strategy inconvenient and understandable for the trader himself.
Timing of trading
What timeframes do you want to trade on?
How much time are you willing to devote to trading?
What time will you trade?
Selection of trading instruments
Pick those tools. which you understand well
The strategy can be both universal (for many tools), and sharpened for specific toolsChoice of tools for analysis
1) When the main idea of the strategy emerged and it became clear how, when and what to trade, you need to decide on the tools of market analysis
2) If the strategy is indicator, then select indicators (from 2 to 5)
3) If the strategy is not indicator, then select patterns, figures of graphical analysis
4) If the strategy is based on fundamental analysis , then it is necessary to decide on which news to trade.
Trade entry rules
Under what conditions will you enter the market based on what signals?
When will you not open a trade?
What orders will you use market or pending?
Exit rules
Stop Loss and Take Profit
Under what conditions do you close a position?
How will you set stop loss and take profit?
Risk Management
Write down the risk per order, risk per day / week / month
(in percent or in currency)
Determine the maximum allowed number of losing trades
per day / week / month
Calculate the volume of a trading position (lot)
When there is a strategy, what's next?
Check the effectiveness of your strategy on the strategy tester or on a demo account
Maintain trade statistics to identify weaknesses of the strategy and remove them
Find me on:
Understanding Market Structure1) Consolidation
The market enters this phase after a strong movement. Sellers control buyers, which further leads to a downward trend
2) Down trend
Bearish phase - lower lows and lower highs. This is where traders want to go short on breakouts or from levels
3) Distribution
Occurs after a prolonged fall in prices, when buyers gain control of prices, resulting in higher prices
4) Up trend
The bull phase is where you want to be long. See to buy short breakout moves after long rallies have exhausted themselves. Attempts to rally are considered guilty until proven innocent
-------------------
Share your opinion in the comments and support the idea with likes.
Thank you for your support!

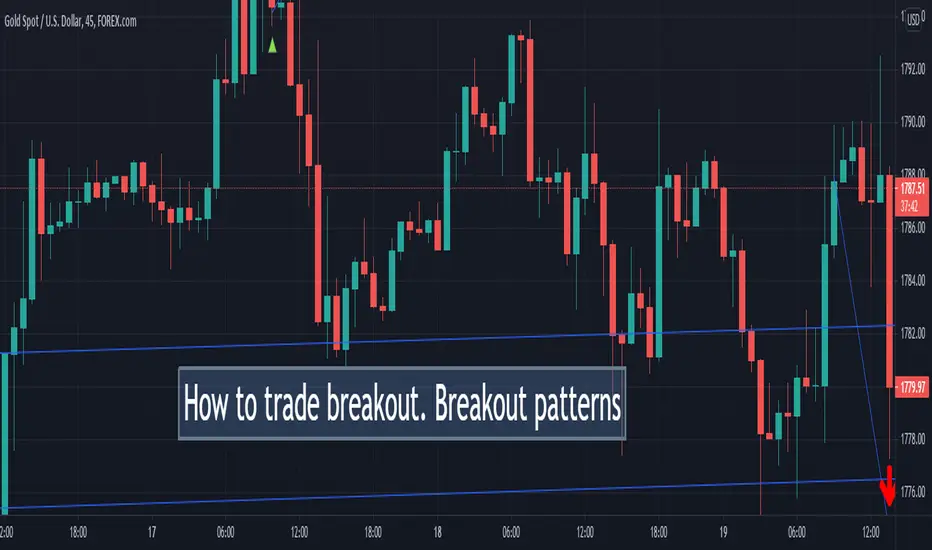
How to trade breakout Breakout patternsWhat is a level breakout? A large number of orders are located behind the level. Either this is a limit entry order
if the price overcomes the level, or it is a protective order - it is triggered if the price goes out of our way and
overcomes the protective zone in the form of a level
-------------------
Share your opinion in the comments and support the idea with Like.
Thanks for your support!