Predictions and analysis
Euro is trending up while the dollar is heading lower. We're at the bottom of the broadening formation, a break in LTF structure is a good trigger for a long to the top of the megaphone, not that I believe in LTF structure breaks per se - I'm already long. Trade will take 2 - 4 days I expect. You can take profit at the top of structure (BSL), at the top of the...
Bajaj Auto (NSE Ticker: BAJAJ_AUTO) is forming two back to back bearish patterns on the hourly chart. First bearish pattern: Broadening formation Second bearish pattern: Head & Shoulders We see high probability of fall in price in the coming days toward measured move and 200SMA target of 4410.
I don’t see how the market continues on an uptrend after cpi, and the Dow is seriously overextended Reasoning: Trendline, daily, weekly and monthly supports Weekly price exhaustion Bottom of broadening pattern Favourable volume
The price is testing the daily resistance inside a broadening pattern. At the moment the price is testing the 0.5 Fibonacci level on the Daily timeframe. How to approach it? IF the price is going to have a clear breakout and retest the resistance as new support, According to Plancton's strategy , we can set a nice order ––––– Keep in mind. 🟣 Purple structure...
The long upper wick of the candle is a sign of price rejection. The first bearish pin bar on November 22, followed by another higher high long upper wick candle on December 1, is a sign that the trend is about to bend. Confirming the two sign is followed by another higher high with Bearish Engulfing Candle, this candle pattern could be the confirmation that the...
Here we see a right angle broadening formation, with the accumulation line on the bottom. What appears to be an island reversal pattern appeared in the daily chart, marked by the yellow rectangle, which is typical of congestion patterns like this. Broadening formations are typical of late stage bull markets and are accompanied by irregular volume throughout. A...
USOIL is trading in a broadening pattern. It just tested the support zone. If it is able to hold the support then it is likely headed for the top of the pattern. All bets off if the pattern is broken downwards. Disclaimer: Not a recommendation to buy or sell. Long term chart is also posted here.
Just throwing some lines on HSBC (HSBA) . We have a broadening channel, higher highs and lower lows on a 20 year timeframe. Currently in a downward trend on the monthly, just about holding historical support. This would probably be a good place to exit if we are expecting a market downturn. "These formations are relatively rare during normal market conditions...
This broadening formation is breaking out to the upside. To confirm that, I want to see it going fully trough the 3k level. Target inside the chart.
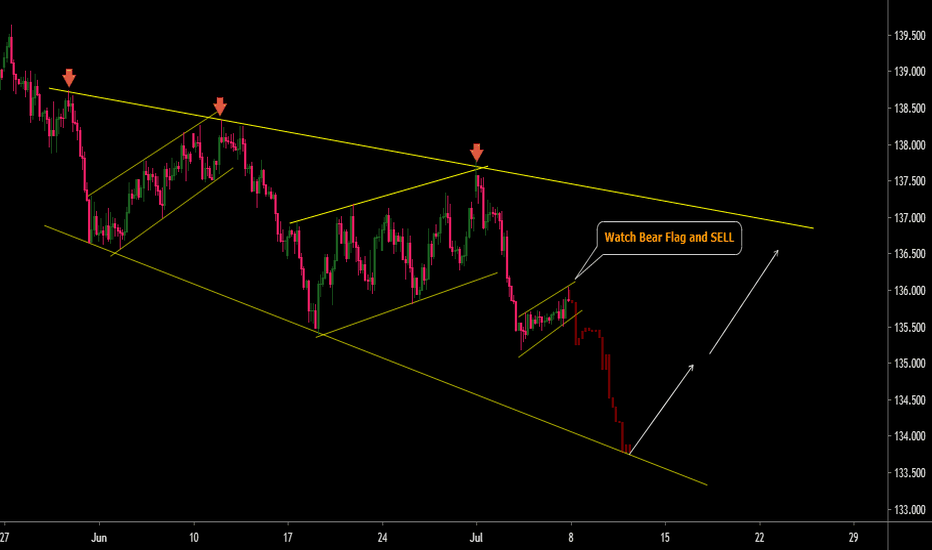
Big Expanding descending Channel or Brod Formation of structure making in GBPJPY. Currently making a Bear flag to Short Term SELL Opportunity . Buy on Third touch of structure after Confirmation in Lower Time frame - Let See What Will be Next Move - Warning- I m Not a Financial Advisor this idea Only For Educational Purpose Only. Thank You !!
can it finally break its resistance? or will it fall back into its broadening formation?
Following from the smaller scale charts posted previously, weekly scale shows 2 triangles in action from outside bars. Missed the smaller scale one which perfectly tagged the recent low but i've done some more studying and almost completed the strat course, so my eye is sharpening every day. Larger scale triangle still has lower edge to tag, as previously...
Could be broadening pattern (ascending, expanding, or bottoming ), needs more confirmation, but something to keep an eye.. good luck trading
Got this on the 39 minute chart, the crazy part about this is that the price target measurement lines up perfectly with the established trend line, let's see what she ends up doing.
Bullish bitshares broadening pattern shows the potential of a massive rise upon its next ascent...target to the $1.70+
The Broadening Top pattern forms when the price progressively makes higher highs (1, 3) and lower lows (2, 4) following two widening trend lines. The price is expected to move up or down past the pattern depending on which line is broken first. A bit of a toss up since the broadening top formation appears much more frequently at tops than at bottoms, and therefore...
Let us see what will give us this setup, do not trade until it confirms I am waiting to go short
The FB daily shows a coil around the point of control in the 114s. A break north of the coil on weak volume, paired w/ a flat RSI, and MACD negative divergence indicate a potential reversal back into the coil. If the support in the 113s holds, the coil should then break north again. If it fails, it could result in a possible bow draw reversal of the coil, at which...


