I'm not saying it is a bubble.But If it looks like a duck, swims like a duck, and quacks like a duck, then it probably is a duck.
Bubblemarket

Gold Falls!!!Hello Traders!
✔XAUUSD Is Bullish but is being pushed towards the downside
✔Price has faked out on the trendline
✔Fibonacci has tested the 50% line so a reversal is likely
✔RSI is pushing towards the downside
4500 PIP Analysis

CRASH on the S&P500 and the economy / PART 2 ( Update )----------------------------------------------
REMINDER
----------------------------------------------
We did a few months ago an analysis on the S&P500 chart based on some behavior patterns, which would trigger some results, we marked some crash zones, but the fundamentals have changed this past scenario.
What is the reason for this change? The big dollar printing by the Federal Reserve and the unwary investors who have been lured by these big gains. This generated a short squeeze that has continued to drive the price higher.
The chart has changed, but what has not changed is the price projection. We are still in the Crash Danger Zone, this zone will never disappear until the market has made a deeper correction.
Pay attention, because we are facing a complex situation, and here a good management is the only thing that will help us.
----------------------------------------------
ANALYSIS
----------------------------------------------
On the one hand, we still have a prolonged Divergence, which ALWAYS triggers an extremely strong correction. On the other hand, the fibonacci calculations have been rendered obsolete by the short squeeze generated, but this has triggered a Bubble pattern. The curved red line is the guide to the pattern we are talking about.
Normally bubble patterns, when they break the curve strongly and consistently, usually lose 60% of the value of the asset, then a strong rebound to 61% Fibo, and end with a total fall of 70% 80% or 90% of the value.
After this... the market is as if it were dead. If the asset has a real and natural value... This zone becomes an accumulation zone. ( Buy )
All this mentioned is the normal behavior of this type of patterns. But as we are talking about a very important and controlled market .... We must watch all the support zones marked on the chart.
In normal circumstances or less important graphs... It should penetrate all the support zones no matter what the zones are. But in this market we must be pending in each support zone and go managing our stop loss with caution and without greed. I do not recommend looking at earnings, simply be guided by the drawing and manage well the Traling Stop.
I would like to remind anyone who has forgotten... that before a sharp fall in the market... We are warned with viruses, from 2 to 3 viruses, and then always comes the crash. I did not invent this, it is written in the chart.
----------------------------------------------
HOW DO WE MANAGE IT?
----------------------------------------------
For all this, I recommend caution.
- If you are in a trade or you are in the market, the most advisable is to have a traling stop below the bubble curve.
- For the more risky, we can prepare our progressive shorts as the price continues to rise.
- For the more conservative, you can wait for the bubble to burst and on the bounce towards the 61% fibo area, open a bearish trade.
Best of luck to all.


US Indices - Nasdaq, SP500, Dow; Market TopsMost likely Market Tops in US Indices .
Probable dates and price levels;
The Nasdaq100;
The SP500;
The DJIA;
The NDX/DJIA/SPX rotation;


Nasdaq100; Dump it!!Aside from a total U.S. Market Capitalization that is now in excess of 260% of U.S. GDP (the historic norm, not the low, being 78%!) ...
... and a Doubly Exponential; f(x)=a^(b^x), Central Bank(s) push in equities , up to this point, ...
... and the leverage in the system (U.S. equity markets) now easily the eclipsing all previous records, by any measure, not just in absolute terms!;
www.hussmanfunds.com
... and since the current SPAC mania is identical to the South Sea Bubble, in as much as: "Let them see not what they do!" ,
... and since the total Market Cap of the top 1500 companies, that were unprofitable for each of the past 3 years, now exceeds $2.5 Trillion,
... and because of charts like these;
www.hussmanfunds.com
... and;
www.hussmanfunds.com
... and;
www.hussmanfunds.com
...
youtu.be
... there are numerous (too many to list) other leading-, as well as coincident-indicators which would all suggest that being long here is very unlikely to turn out well.
Such as;
The valuation of Bitcoin now equates one-fifth (20%) of the entire U.S. Monetary Base ;
... and;
... and;
from this post;
... and so on.

Timing the Bubble Burst Sequence (DJIA/Gold)... And the Price Levels. (Ought to speaks for itself.)
Same as the Title Chart - less distorted;

The Bubble End Game - Crude Oil; $35 before $75If you see $70 dump it with both hands and eyes closed! They will probably Stop Hunt the recent top at $68, though.
The Monthly;

The Bubble End Game - The Carry TradesThis is one of (if not "The") worst Carry Trade in modern times. (And it' is - will be - extremely illiquid when the time comes!!)
The Weekly;


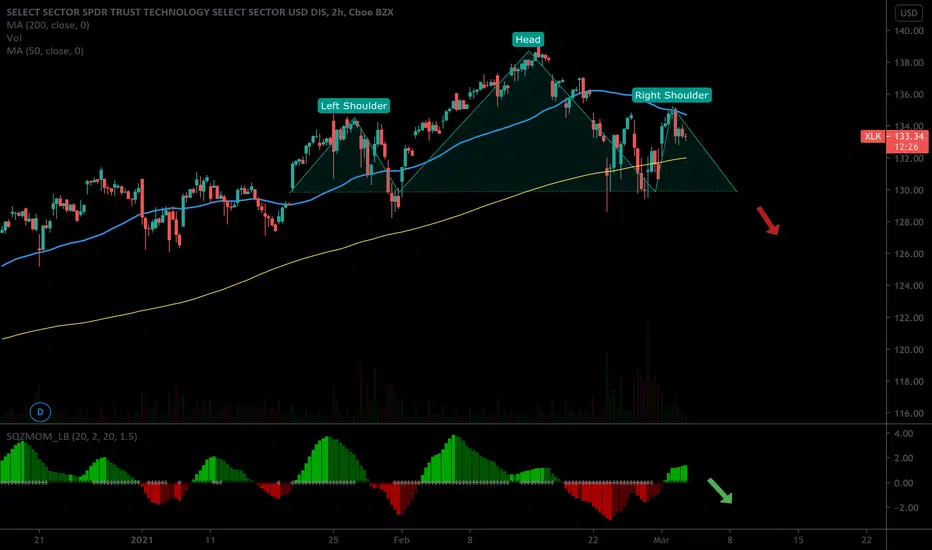
Head & Shoulders Pattern on XLKIt appears a head-and-shoulders pattern is beginning to form on the XLK. If the right shoulder fully forms, look out below!
Tesla buy or sell? Bubble?Reasons to buy Tsla
Although electric cars occupy a small portion of the global automobile market, Tesla has acquired a large market share within this niche segment. Tesla has a little less then 1% marketshare worldwide which is impressive for a young car company like Tesla. Especially in the electric segment where it has 16% marketshare in 2019. The company has a strong performance adn the unique design helps the sales. For example the preorder of the Tesla Truck. Also the solar and storage deployments will probably witness significant growth aided by the positive reception of the Megapack and Powerwall products.
The delivery of Model 3 has risen significantly, which counts for a big part of the companies overall deliveries since it the best selling car of Tesla so far. Besides Model 3, Model Y is also improving Tesla’s prospects. The construction progress for Gigafactory 4 in Berlin and Gigafactory 5 in Austin are also underway, with production from both plants expected to start this year.
With China being the biggest EV market, Tesla’s ambitious production plans in the country bode well. Robust production of Model 3 from the new Gigafactory in Shanghai bode well for its future growth. The Shanghai factory is ramping up well and commands a higher market share in the Chinese EV market.
Over a multi-year horizon, Tesla anticipates achieving 50% average annual growth in vehicle deliveries. Meanwhile, low leverage of Tesla offers financial flexibility. Notably, its long-term debt-to-capital ratio stands at 0.31, lower than its industry's 0.54.
Historically, from 2016 to 2020 sales of TSLA increased in average of 45% from one year to another, with an estimate of 49% sales growth for 2021 and 33% for 2022.
The liquidity and Solvency of Tesla are both scoring good which means Tesla is able to pay of short term as long term obligations.
Reasons to sell Tesla inc
The company’s high R&D and SG&A costs do raise concerns. During the last reported quarter, R&D and SG&A costs were up both yearly and sequentially. Capex soared 138% year over year and is likely to increase this year as well, thereby affecting cash flow and margins.
Tesla's excessive reliance on credit sales remain a concern. In 2020, Tesla posted a net GAAP income of $721 million. Without the regulatory credit sales, the firm would have incurred a loss to the tune of $859 million.
Stretched valuation of Tesla is a concern. Going by the EV/EBITDA multiple, which is often used to value auto stocks, Tesla is currently trading at a trailing 12-month EV/EBITDA multiple of 187.9, considerably higher than the industry average of 52.41. The firm’s P/S ratio of 17.3 also compares unfavorably to the industry’s 3.05.
Tesla bubble?
Based on the future outlook of the industry and the company and considering all the discussion around TSLA bubble, it can be assessed which will be the fair value for the company at the moment. For this, the EPS reported for last quarter was taken and annualised which gives us 0,96$ per share. Based on recent developement and estimation, it is forecasted that Tesla will have an annual growth in earnings of 40% each year, first 5 years and 10% from year 6 to year 15.
For safety reason 15 years is the number of years we will calculate with as there is a reasonable time to recover an investment. The forecasted EPS after 15 years based on this growth is around 12,17$ per share. Multiplying these with a decent P/E ratio of 35, the fair price would be currently below 500$, while the real price is just under 800$.
Buy or not?
Although it is clear that the company is the market leader and may outperform without problem any other company from the industry for the never ending future, however, following value investing principles, the current price is out of real position and may lead to the fact that the stock is overvalued.
Thus, the stock may face a corrective action in the near future. However, it is a bit funny to observe that even in a period of instability and uncertainty and in this Covid-19 situation, where people use the cars a lot less, Tesla kept it's position, and even increased its position, without recording great losses.
This could mean that value trading as we know, may not be applicable anymore and the investors should adjust and adapt trading principles and behaviours accordingly.
If you are a value investor, like I am, then Tesla is not the right choice to invest in.

K-Shaped Recoverymany people still thinks we're in a V-Shape recovery , but it's a K-Shaped recovery in progress right now.
which is one of last thing you want to see in a major economy.
dumb money goes into many worthless tech companies and spike their market caps at unbeliavable levels. (just like before 2000 dotcom bust)
on the otherside industrial sectors are not showing any robust recovery signs.
from this perspective this market is totally unstable now and crash is inevitable.

A look at a century of logarithmic Dow - it's not a bubble!I keep hearing that stocks are in a bubble, but that just isn't true. People always look at charts in a linear mode, but this is not how math works. To get accurate prices and movement we MUST look at a logarithmic chart. When you do this for the Dow Jones average for the last century you clearly see we perhaps are a little inflated, but nowhere near Bubble territory. You want a Bubble? 1929 - now *that* was wildly over valued (with a subsequent epic crash). Now if in 2023 the Dow is above 45k? Then you can get back to me about how we might be in an asset Bubble. Until then I expect the trend to continue bullish.

Unbridled Optimism, Irrational exuberance, wild speculationThe NQ is stuck. how many times can you hit new ATH price in 2 days? 5? 10? 20? I watched Sam Zell, Billionaire Investor on CNBC this morning saying what myself and a few others say in the room.
While Retail traders use their stimulus checks gambling in the market, like the cocaine monkey hitting the cocaine button and ignoring food and water till they drop dead this market NEEDS to correct.
Is buying the dips a real speculation trade when we drop from 13,686 to 13,683? Nobody knows what will happen in any given moment in the Markets, and yet in the room 90% of Traders are predicting
what will happen in complex patterns, for example, "we will dip to NN,NNN and they go up". how could they possibly know in this market? We are in a crazy, irrational bubble..
Having said that I do think there is a good chance we get a "Turnaround Tuesday", we defiantly need to get an UP and down cycle going again... Hey it may not happen, there is a 50/50% chance it will.
It's just what makes sense.

Top bubble ? after the valentine's day weekend?
rising wedge fall ??
Will Biden save us from the crash that is coming ???

Alexa, play "This is the end"See you all next cycle.
Bitcoin is going full speculation bubble burst.

EVERYTHING BUBBLE? (SPX , GOLD , OIL)if fundamentals support it , we can see something interesting in the next couple weeks.

SPY - are we going to see a final pump before the big dump?This is all a speculation ofcourse. No one can time the burst of the bubble. But last week showed us how crazy the market is right now.
The exact same things happened before the Dot Com Bubble burst. Just be wary of longterm trades

TSLA Bubble is close to bursting!Almost at the end of a large 5th Elliot Wave, will need to pull back hard to make Tesla healthy. This could be triggered by earnings tomorrow or soon after (It may approach 1000) Tesla is losing market share in Europe at a face pace to VW. Extremely overvalued at the moment due to people using it as an asset like BTC.
Target 1 Short - 364
Target 2 Short - 219


Bitcoin + SPAC = Double the BubbleThrew some money at this today. Bakkt, a group that has been trying to bring a Bitcoin ETF to market for several years now, has decided to go the SPAC route to market. SPACs have been one of the hottest things during this crazy bubble market. I expect it will probably go up a stupid amount for no good reason. Target? No idea, let's say $75, lolz
