EURCHF Price nearing major reversal ??Price is forming bullish structure making HH & HL, has given breakout above 0.9279 which was at the confluence of major bearish trendline and a horizontal resistance zone, now form here on we are expecting a continuation in the bullish direction but before that a pullback and retest of the breakout levels would be more confirming.
Immediate significant support is at 0.9177 which can be used as Stoploss level and immediate resistance is at 0.9395.
Waiting for the pull back would be an appropria
Buysignals
ADAUSDT the 0.33 to 0.66 is easy now ADA is currently trading at the $0.33 level following a notable decline. This zone may now represent a potential reversal area, with the next key technical target positioned near $0.66—a 100% appreciation from current levels.
For this bullish scenario to materialize, confirmation through price action and volume is required. A sustained move above near-term resistance with increasing buying volume would signal a reversal in momentum and could mark the beginning of a new upward phase.
DISCLAIMER
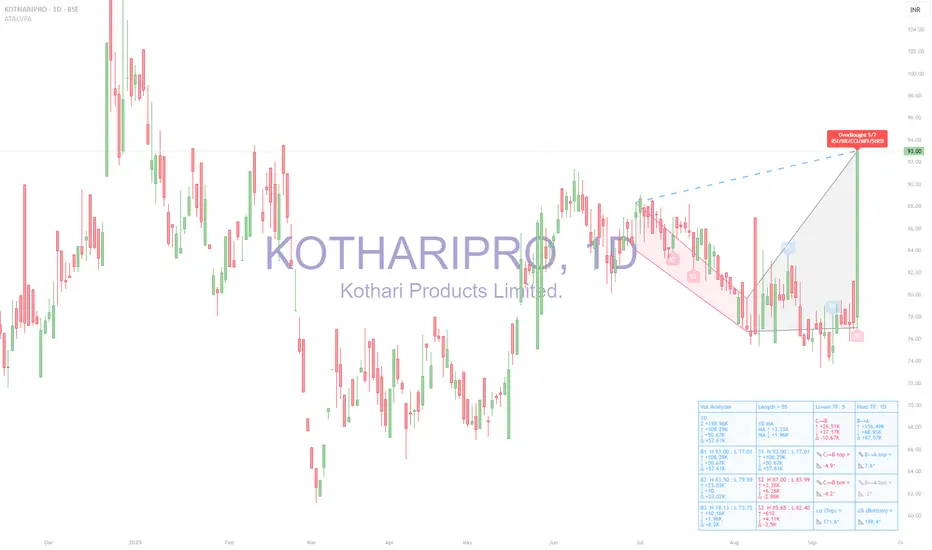
KOTHARIPRO (BSE: 1D) — Volume Pressure Analyzer | OB 5/7 Tool used
Analysis made with ATAI Volume Pressure Analyzer (VPA), which decomposes daily flows into buy/sell volume, prints half-window deltas (C→B vs B→A), ATR-normalized wing slopes, α/β geometry at vertex B, and OverBought/OverSold spike labels confirmed by a 7-oscillator vote
1) Snapshot from HUD
◉ OB 5/7 fired on today’s +20% candle (RSI/Stoch/CCI/MFI/StRSI cluster).
◉ C→B (earlier half): Δ −14.21 → seller-tilted.
◉ B→A (recent half): Δ +72.25K → buyers in control.
◉ Angles: C→B wing bo
AUDNZD (4H) Symmetrical Triangle Breakout+Falling Wedge ReversalOn the 4-hour chart of AUDNZD, the market has completed a compression phase inside a symmetrical triangle, nested within a larger falling wedge structure. Both patterns suggest a potential bullish reversal after an extended downward trend.
The breakout occurred to the upside, with price moving above the triangle and breaking through short-term resistance around 1.0713. Volume increased on the breakout, confirming genuine buyer interest. If the price holds above this level and breaks 1.0766, it
Raydium _ Next Target is Previous High, Make a +575% PROFITRaydium is going to break the 0.6 Fibonacci Retracement level. If the market close above the 0.6 Fibonacci Retracement level, then the market Approaching Previous High. So Previous High is the Next Target. And Offering the chance to make a +575% Percentage Profit.
Support me; I want to Help People Make PROFIT all over the "World".
Conflux _ Next Target is Box Size _ Biggest Profit (+1,456 % )Conflux, Trading in Side Waves or Box. Next Target is the Box Top and if Breakout above the Box, Box Target is USD 2.27048238. Offering the Chance to Achieve Biggest Profit of (+1,456%).
Suppose if Breakout bottom of the Box, exit all the positions.
Support me; I want to Help People Make PROFIT all over the "World".
GBPUSD BUY Exciting News, Traders! GBP/USD is showing a promising buy opportunity at 1.21000 level. Our analysis of the weekly pattern reveals a strong bullish signal with a candle closing above this crucial point. Let's seize this opportunity and work together to make this trade a success! Stay tuned for updates, and let's navigate the markets and secure those profits together! #TradingSuccess #GBPUSD
Bollinger Bands: Investment Guide 📊🚀📉 The Basics: Bollinger Bands consist of three lines – the middle line is the simple moving average (SMA), while the upper and lower bands are set at a certain standard deviation from the SMA. They act as dynamic support and resistance levels.
🌟 Long-Term Perspective: Bollinger Bands are highly versatile and well-suited for long-term investors. They provide valuable insights into Bitcoin's price volatility over time.
💡 The Buy Signal: One effective strategy for long-term investors is to consid
Bullish on $CSE:BTC Blue Sky Digital Symbol: CSE:BTC
Blue sky is a prime example of a dormant stock about to bounce!
Note the illustrated section where it notes crossing the MACD and I believe an upward trend to 0.06+ in near future, possibly the next two weeks!
BTC = Buy in my opinion
Note: This is not financial advice and I am not a financial advisor! Do your own research!
ERN was a gamechanger7-star buy and sell signal caugh ERN pump perfectly. We always strive to filter out fake signals and help cut your losses. Whether you are a beginner or professional trader, 7-star always be a guiding light to your trading strategy. Next time when your alerts trigger we make sure that they come to gain you profits.
Chat with us for more details.
Crypto trading is highly volatile. Trade with caution.
E
Dego to bounce?Received a passive signal on our 7-star premium buy & sell indicator. expecting target 3.3 - 3.4
Remember it's on resistance now. it should break 2.8
DLong
US30 OLHC (BUYS) YEARLY STRUCTURE (NOVEMBER 2022)US30 OLHC (BUYS)
YEARLY STRUCTURE
(NOVEMBER 2022)
YEARLY STRUCTURE ( MONTHLY TIMEFRAME )
Please support this idea with LIKE if you find it useful..
Three Important keys to look out for.
1. Market Structure (OLHC)
2. Bullish Divergence
3. TDI Cross ( Bullish Cross)
Market structure for US30 for this current year 2022 in the monthly timeframe is OLHC (Buy Setup).
There's also a strong Bullish Divergence from 02 November 2020 to current yearly low.
TDI cross has also confirmed the presence o
ULong
ANANTRAJ LTD GOOD FOR SWING TRADINGANANTRAJ LTD GOOD FOR SWING TRADING
Resistance breakout
Rejection 3-4times and then breakout
Buy = 96.55
1st Target= 113
2nd Target= 131
stop loss=76.60
⚠️ Important: Always maintain your Risk & Reward Ratio.
✅Like and follow to never miss a new idea!✅
Disclaimer: I am not SEBI Registered Advisor. My posts are purely for training and educational purposes.
Eat🍜 Sleep😴 TradingView📈 Repeat 🔁
EURUSD bullish continuationHello traders
In the past two weeks, the bulls have been in full control making higher highs and higher lows. I have also noticed that the move is being accelerated during the London session and also the Newyork session (NY).
On Tuesdays and Thursdays, the price is on an uptrend. On Wednesdays, the price is having a small reversal so that we can have another sniper bullish entry on Thursdays.
I believe that the price will continue going higher to fill the liquidity void that is still present
Cosmos (ATOM) Buy ZoneCosmos (ATOM) Buy Zone
--------------------
BIAS
Mid-Term : Bullish
Risk : High
Cosmos is showing signs of strength paired to both USDT and BTC. Laddering orders all the way down to entry zone.
--------------------
$ATOM/USDT LONG SETUP
Leverage : x3 - x5
Entry Price : 24.25 - 24.75
TP 1 : 25.3
TP 2 : 25.9
TP 3 : 26.75
TP 4 : 26.25
TP 5 : 28.12
TP 6 : 29
TP 7 : 30.3
TP 8 : 32
Stop Loss : 23.5
*Maximum 3% of Portfolio.
*Unload 12.5% at each TP. Whenever TP 2 hits, Move stop loss to entry.
ZEST huge upside potentialLast year ZEST Ecoark had a $20 Million Registered Direct Offering Priced at a Premium to Market of 3,478,261 shares of its common stock at a purchase price of $5.75 and the warrants have an exercise price of $5.75 per share.
And the stock was down ever since.
But the upside is still there, if an institutional investor agreed for that premium to market private placement.
For sure they did an extensive due diligence.
Ecoark Holdings, Inc. (ZEST) 52 Week Range $2.00 - 17.00. now $2.70.
But wh
ZLong