Gold – Potential Choppy Price Action AheadThe market got what it wanted from the Federal Reserve last night when a widely anticipated interest rate cut of 25bps (0.25%) was announced, a move which as a rule is positive for Gold prices as it is an asset that doesn’t bear any interest itself. Initially this was the case, with the popular metal trading from opening levels at 4210 before the Fed decision on Wednesday up to a one week high of 4248 early this morning. However, that is where the positive story ended and Gold prices have since traded back down to 4210 again at the time of writing (0700 GMT).
On a longer-term basis, the drivers underpinning prices still seem to remain in place, namely central bank buying dips, concerns over swelling government debt and an uncertain geopolitical outlook, but in the short-term Gold prices could be at the mercy of general risk sentiment, which is wavering after a disappointing Q3 earnings release from Oracle overnight, and positioning readjustment. This situation isn’t helped by the reality that there is little in the way of scheduled risk events for traders to focus on until the release of US Non-farm Payrolls next Tuesday, December 16th (1330 GMT) and the interest rate decisions from the Bank of England, European Central Bank (December 18th) and Bank of Japan (December 19th).
This backdrop could suggest potential for some choppy price action ahead which may require traders to keep monitoring important support and resistance levels that could impact the direction of Gold moving forward.
Gold Technical Update: Watching the 4245/4265 Resistance Band
Since posting the 4381 October 20th high and 3887 October 28th low, Gold has entered a more balanced phase of sideways trading between these extremes. The over‑extended upside price conditions seen after the recent sharp acceleration higher are currently being unwound by this activity.
This current balance between buyers and sellers is evident in the chart below, but it also highlights that no successful closing breakout has yet materialised in price.
Gold’s initial response to the Fed interest rate cut and subsequent press conference yesterday was more positive, with fresh price strength emerging. However, there is still no evidence of a successful breakout to the topside on a closing basis.
As such, maintaining an awareness of both key support and resistance levels could be important in gauging whether the recent sideways trading range is nearing an end.
Possible Resistance Levels:
As the chart below highlights, there is a combination of potential resistance levels situated just above current price activity. This zone reflects both the downtrend line connecting price highs back to October 20th, which sits at 4245 and the December 1st high at 4265. Having previously marked areas where selling pressure has emerged, traders may now be focused on how this resistance band is defended on a closing basis.
Closing breaks above 4245/4265 could lead to a fresh phase of price strength, marking an upside break in Gold from its sideways activity. While not a guarantee of sustained gains, such a move could open potential to challenge the 4381 October 20th extreme and possibly extend further if that level also gives way on a closing basis.
Potential Support Levels:
For now, the 4245/4265 resistance band remains intact. While this area continues to cap attempts at price strength on a closing basis, risks may shift toward the downside, bringing the Bollinger mid‑average at 4155 into play as a potential support level to monitor.
Closing breaks below this support at 4155, if seen, could suggest scope for continued declines toward 3998, the November 18th low. If this level also gave way, it may open the path toward 3887, the October 28th downside extreme.
The material provided here has not been prepared accordance with legal requirements designed to promote the independence of investment research and as such is considered to be a marketing communication. Whilst it is not subject to any prohibition on dealing ahead of the dissemination of investment research, we will not seek to take any advantage before providing it to our clients.
Pepperstone doesn’t represent that the material provided here is accurate, current or complete, and therefore shouldn’t be relied upon as such. The information, whether from a third party or not, isn’t to be considered as a recommendation; or an offer to buy or sell; or the solicitation of an offer to buy or sell any security, financial product or instrument; or to participate in any particular trading strategy. It does not take into account readers’ financial situation or investment objectives. We advise any readers of this content to seek their own advice. Without the approval of Pepperstone, reproduction or redistribution of this information isn’t permitted.
Candlestick Analysis

GOLD (XAU/USD): Day Trading Setup for Today📈GOLD is currently consolidating within a horizontal intraday range.
Following a test of the channel's support, the price may continue to ascend towards its resistance.
As a confirmation, I observe a head and shoulders pattern formation.
Target - 4255

NZD/USD: Confirmed Break of StructureI see a confirmed bullish breakout of a significant daily structure, with the candle closing above it on 📈NZDUSD chart.
With a high probability, the market will continue rising and
reach 0.5840 resistance soon.

USDJPY: Move Up Confirmed?! 🇺🇸🇯🇵
USDJPY will likely bounce from the underlined intraday support.
A formation of a bullish engulfing candle confirms a buying
imbalance after its test.
The price will rise at least to 156.54
❤️Please, support my work with like, thank you!❤️
I am part of Trade Nation's Influencer program and receive a monthly fee for using their TradingView charts in my analysis.

XAUUSD SELLSBreak of structure. 1H OB and 15M OB in the same price area. Let’s see how this goes. Looks solid. This is not financial advice.

USDCHF: High Chance for a Pullback 🇺🇸🇨🇭
There is a high probability that USDCHF
will move up from a key daily support.
A double bottom pattern formation on that on an hourly time frame
provides a reliable confirmation.
Expect a pullback to 0.8007
❤️Please, support my work with like, thank you!❤️
I am part of Trade Nation's Influencer program and receive a monthly fee for using their TradingView charts in my analysis.

The Calm Before the Storm: How to Position Your Gold#XAUUSD OANDA:XAUUSD TVC:GOLD
Gold prices are currently falling slowly and have already broken below 4190. In the short term, if the decline continues, it may test the lower Bollinger Band on the 4-hour chart around 4180. If it touches this level for the first time before the interest rate announcement, a small long position can be considered. I have marked the other key points on the map. You can refer to the layout of the key points. In conclusion, the interest rate itself was not the key point of this interest rate decision, the dot plot, economic forecasts, and bond-buying program were the deciding factors. Correspondingly, gold is highly likely to experience significant volatility tonight, without a doubt.

ETH/USD: Fade the fear or chase the flush?ETH/USD has put in a topping pattern on the daily tick, printing a shooting star candle after a failed bullish probe above the interaction of the 50 and 200DMAs. As things stand, Thursday’s candle would complete an evening star bearish reversal pattern should it close around these levels or lower, doubling down on the bearish signal.
However, I don’t trust the broader risk-off move in Asia, apparently sparked by renewed concerns about AI capex following an update from Oracle. I suspect it’s just as much about yen strength weighing on the Nikkei after the Fed’s not-so-hawkish cut delivered on Wednesday. With a near-perfect correlation between Nikkei futures and risk assets such as Ethereum on a one-minute tick over the past hour, it feels like the move may be faded once Europe gets up and running.
I’m watching $3,200 closely into the changeover as it screens as an ideal level to build trades around, given it provided both support and resistance over the past month. If the price holds beneath $3,200 into Europe, consider initiating shorts with a stop above for protection, targeting either $3,000 or $2,916 initially. But if the price reverses back above $3,200 and holds there, the option is there to set longs with a stop beneath for protection, targeting the confluence of the 50 and 200DMAs or Wednesday’s high above $3,450.
The momentum picture is neutral, putting more emphasis on price action when assessing both setups.
Good luck!
DS

BTC Post-Cut Rates Bearish BiasMy bias after first post-FOMC hours: Short-term bearish in corrective range
We now have:
Clear liquidity sweep ABOVE 93–93.5k
Break BELOW 92k
Immediate bounce back to low 92's
Short-term structure = bearish, but in the middle of the impulse, not at an extreme. That matters for entries.
93–93.5k = key macro level
Price could not hold; spike → rejection → dump.
That confirms it as strong resistance for now.
Price stabbed below 92k and bounced.
That is first probe below his line, not a clean breakdown yet.
Right now we are in no-man’s-land.
Key short trigger:
Primary: 93–93.5k retest failure
Secondary: Break + retest of 92k from below
Hard invalidation of bear idea:
Daily close > 95k with strong volume.
Key long trigger:
Reclaim & hold 94–94.5k or capitulation flush to 85–88k with strong reversal.
If price just chops between 92k and 93k:
Sit on hands and wait for one of the triggers.

Nifty Analysis EOD – December 10, 2025 – Wednesday🟢 Nifty Analysis EOD – December 10, 2025 – Wednesday 🔴
25920 Resistance Holds Firm; Bears Secure Yet Another Lower Close at Critical Support.
🗞 Nifty Summary
The Nifty started with a 29-point Gap Up but immediately failed, filling the gap and briefly forming a base at the PDC. Bulls attempted to push north, but the crucial resistance zone of 25920 ~ 25930 and the PDH successfully repelled the advance.
After the failure, the index slipped below the IBL and the Previous Day’s Trendline support, dropping 90 points. Although a recovery was attempted, the market met the same resistance, leading to a deeper plunge that almost reached the PDL.
Once again, the strong support zone of 25715 ~ 25740 provided defense, yet bears managed to secure a close near the day’s low at 25,742.65. The day was a precise test of both PDH and PDL, but the lower close confirms that bears won the territorial fight today.
🛡 5 Min Intraday Chart with Levels
🛡 Intraday Walk
The day tested the range extremes, with the PDC acting as the mean level. The failure of the gap-up and the swift rejection at 25920 confirmed that the polarity flip witnessed yesterday is still valid—this level is now strong overhead supply.
The repeated rejection initiated the sustained downtrend. The close right on the 25715 ~ 25740 support zone means the market is now precariously positioned.
Tomorrow’s action is crucial: if the Nifty breaks the 25700 level and closes below it, a new, deeper downside zone will open for the index.
📉 Daily Time Frame Chart with Intraday Levels
🕯 Daily Candle Breakdown
Open: 25,864.05
High: 25,947.65
Low: 25,734.55
Close: 25,758.00
Change: −81.65 (−0.32%)
🏗️ Structure Breakdown
Type: Bearish candle with a Long Lower Wick, kind of spinning top.
Range (High–Low): ≈ 213.1 points — elevated intraday volatility.
Body: ≈ 106.05 points — moderate bearish body, showing sustained downside pressure.
Upper Wick: ≈ 83.6 points — strong rejection near the day’s high
Lower Wick: ≈ 23.45 points — limited buying attempt from lower levels.
📚 Interpretation
The candle shows a clear bearish tilt with a substantial body, confirming bears maintained control, resulting in a lower close. The size of the upper wick confirms the strong rejection at the 25920 resistance zone. The lower wick is small, indicating limited defense near the 25700 base compared to the previous day, suggesting vulnerability.
🕯 Candle Type
Bearish Candle with Long Upper Wick (Strong Rejection) — Indicates distribution and sustained weakness toward support.
🛡 5 Min Intraday Chart
⚔️ Gladiator Strategy Update
ATR: 206.55
IB Range: 87.55 → Medium
Market Structure: Balanced
Trade Highlights:
11:38 Short Trade - Target Hit (R:R 1:1.83) (Trendline Breakdown, later on PDC + IBL breakdown)
Trade Summary: The strategy successfully captured the directional breakdown below the IB zone, capitalizing on the pressure sustained from the 25920 resistance failure. The profitable short trade aligned with the dominant bearish theme of the day.
🧱 Support & Resistance Levels
Resistance Zones:
25930 ~ 25920 (Immediate Polarity Flip Resistance)
25985
26030
Support Zones:
25740 ~ 25715 (Critical Immediate Base Support)
🧠 Final Thoughts
“The 25700 must hold.”
The close right on the 25740 ~ 25715 support zone makes tomorrow’s session crucial. If the market breaks the 25700 level and closes below it, a new downside zone will open.
Given the multiple downside hurdles (25985 and 25930), I will avoid aggressive short trades, but if quick contra trade opportunities arise, they will be attempted with utmost caution.
Keep in mind the 26220 Level for upside; if it’s breached and sustained, aggressive long positions should be favored.
✏️ Disclaimer
This is just my personal viewpoint. Always consult your financial advisor before taking any action.

CHF/JPY: Bullish Trend ContinuesI see a confirmed breakout of a significant daily/intraday resistance level on 📈CHFJPY, accompanied by the formation of a new higher high and higher close.
These occurrences indicate a strong likelihood of a continued bullish trend.
The subsequent target is 195.33.

CAD/CHF: Overbought Market & PullbackThe CADCHF pair has demonstrated a clear respect for a significant daily horizontal resistance level.
Following its interaction with this resistance, the price formed an inverted cup and handle pattern on a 4-hour chart.
It is anticipated that the pair may retrace to the 0.5780 level.

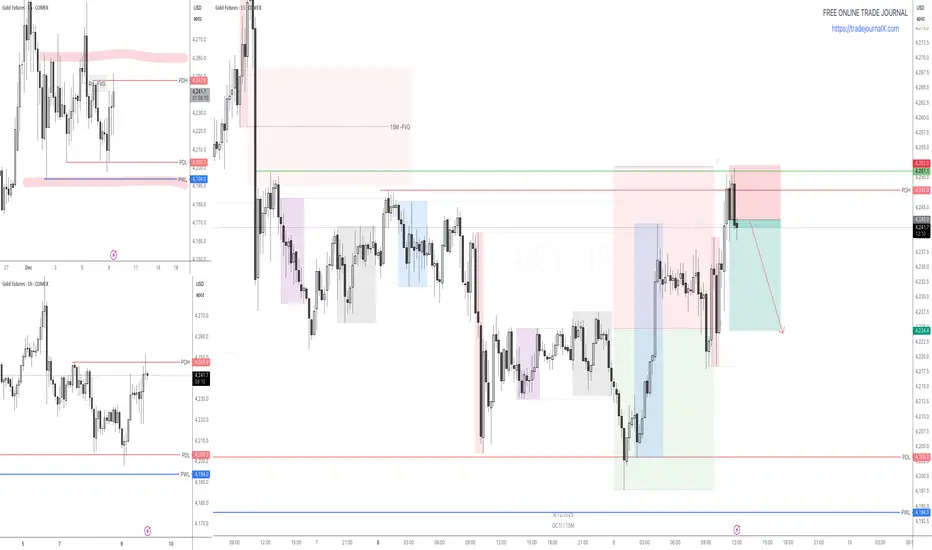
Buy GCGC tested my level of interest according my morning analysis. Buying gold based on 15M engulfing candle

BTC Dominance at a Crossroads: What's Next?!Alright crypto fam, buckle up! We're diving deep into Bitcoin's market cap dominance on the 1-month chart, and I've spotted some critical junctures. Scenario A? A straightforward dip to the 53.11% support zone. But here's where it gets nuanced: Scenario B suggests a potential move down to 57.75% for a re-accumulation, followed by an epic rebound to challenge 63.62%—a level I'm eyeing for potential resistance before a final leg down to 53.11%. This is fascinating price action, and I want to hear your takes!

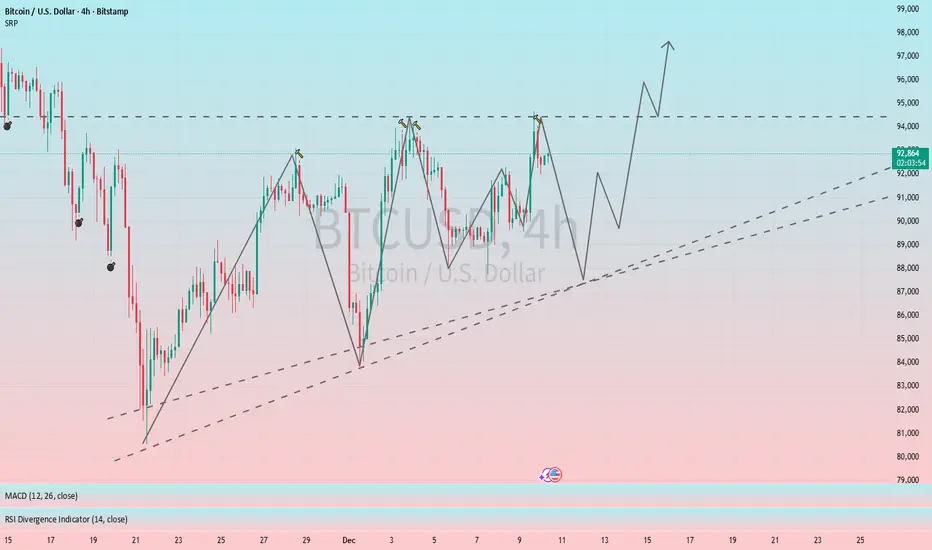
Ascending triangle formation indicates a bullish outlook for BTC#BTCUSD BITSTAMP:BTCUSD BINANCE:BTCUSDT
From the 4H chart, BTC's short-term trend has formed an ascending triangle pattern, which is a typical bullish pattern. Short-term resistance is located at 93500-94500, a break above this level would likely lead to further gains. The key support level to watch is 88000-87500. If the price retraces to this range, we can consider going long on BTC.
Gold: Next Big Move🌟 Gold: Preparing for the Next Big Move
Gold has been consolidating between $4,260 and $4,170 since November 28, building pressure for its next major breakout. This tight range suggests accumulation, similar to previous setups before strong impulsive rallies. These weeks require patience, discipline, and solid risk management.
Today is crucial:
📉 If the Fed cuts rates, gold could enter its final bullish rally of the year.
📊 Current market surveys show ~90% probability of a 25 bps cut, which historically boosts gold as real yields drop and safe-haven demand increases.
Additional context:
🔥 Geopolitical tensions (Venezuela–USA, Middle East) continue to support a risk-off environment.
💵 The US Dollar Index (DXY) has been weakening ahead of the decision — another bullish factor for gold.
📈 CFTC data also shows increasing net long positioning in gold futures, signaling strong institutional interest.
Gold is coiling.
The breakout — when it comes — will be massive.
OANDA:XAUUSD

GC daily trade plan for Dec 10, 2025Gold is in the consolidation range. Market is awaiting FOMC meeting. I do not expect any big moves ahead of that meeting however I will watch for trade signals at the extremes of that consolidation

FireHoseReel | Uniswap Is Approaching a Market Decision Zone🔥 Welcome To FireHoseReel !
Let’s jump into Uni Swap (UNI) market analysis.
👀 UNI 4H Overview
UNI is currently trading inside a range box, with resistance at $5.858 and support at $5.445.
A breakout from either side can lead to a major move. Looking at the chart history, every strong upside move has been followed by a deep correction, yet the impulses themselves have been very sharp and aggressive.
📊 Volume Analysis
UNI volume on Binance is currently not very strong, so clear confirmation is still missing.
However, when UNI starts printing high volume on Binance as well, it signals increased trader attention.
A rise in volume would be a logical confirmation for the next price move.
✍️ UNI Trading Scenarios
🟢 Long Scenario:
A breakout above $5.858 can activate our long trigger, but this setup requires a clear increase in buying volume for confirmation.
🔴 Short Scenario:
A breakdown below the $5.44 support can push price toward the next demand zone.
This move should be confirmed with a strong rise in selling volume, making it a valid short opportunity.
🧠 Protect your capital first. No setup is worth blowing your account. If risk isn’t controlled, profit means nothing. Trade with rules, not emotions.

FireHoseReel | BNB Daily Analysis #19🔥 Welcome To FireHoseReel !
Let’s dive into BinanceCoin (BNB) analysis.
👀 BNB 4H Overview
BNB is currently trading inside a large 4H range box. A breakout from this box could trigger a major move.
The $922 level stands as both the top of the range and the 38% Fibonacci retracement of the previous bearish leg.
On the downside, $881 is acting as a freshly formed support zone.
📊 Volume Analysis
Volume slightly increased during the attempt to break $922, but buyers lacked enough strength and selling pressure followed.
A strong and sustained increase in volume will significantly raise the probability of a valid breakout.
✍️ BNB Trading Scenarios
🟢 Long Scenario 1:
A confirmed breakout above $922 creates a solid long opportunity.
Entry confirmation should come from a stable increase in buying volume.
🟢 Long Scenario 2:
You may enter on the 4th test using a stop-buy order with a wider stop, targeting around RR = 2.
⚠️ This type of entry should be executed with maximum 0.5% risk per trade to avoid heavy losses.
🔴 Short Scenario:
Since the broader structure behind price is strongly bearish, and the market previously experienced an aggressive drop from a distribution zone,
a break below the newly formed $881 support can activate a short position, confirmed by rising sell volume.
🧠 Protect your capital first. No setup is worth blowing your account. If risk isn’t controlled, profit means nothing. Trade with rules, not emotions.

GBPUSD – Bearish BiasWe are calling a bearish bias on GBPUSD for today.
Yesterday’s price action gave us a textbook sign of weakness:
Price took the previous day’s high and low, cleared both sides of liquidity, and still closed bearish — and importantly, it closed outside the previous day’s low.
This confirms a clear continuation narrative with institutional sell-side delivery likely.
What this means:
As long as GBPUSD trades below yesterday’s low, the market is signaling further downside expansion.
Bearish Expectations:
Potential continuation into lower liquidity pools
Retracements into premium zones can offer high-probability sell setups.
Bias remains bearish unless we close back above yesterday’s high
Stay aligned with the flow. 👌

EUR/CAD: Dead Cat bounce?An interesting bearish setup may have emerged on EUR/CAD. After breaking below trend support on Friday, the pair has held beneath that level and is now consolidating tightly near the lows. Both the broken trendline and the October trough are acting as resistance, reinforcing the risk that any rebound may prove shallow.
If downside momentum resumes, support layers around the 1.60 handle and the 200-day moving averages become natural targets for sellers.
Matt Simpson, Market Analyst at City Index.

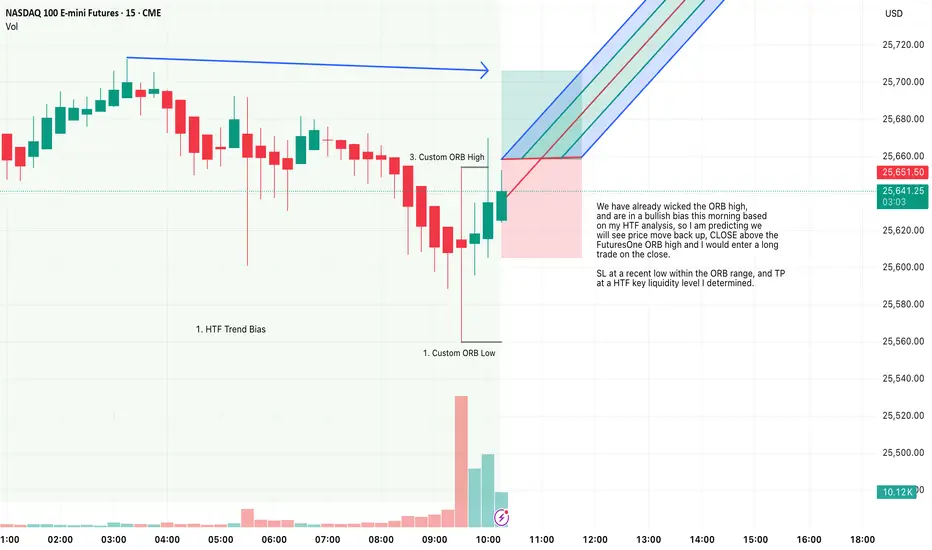
FuturesOne ORB, Long, NQ1, HTF Bias EntryFor this Idea, I am looking at a Long on NQ1.
Price has already wicked the ORB high,
and are in a bullish bias this morning based
on my HTF analysis, so I am predicting we
will see price move back up, CLOSE above the
FuturesOne ORB high and I would enter a long
trade on the close.
SL at a recent low within the ORB range, and TP
at a HTF key liquidity level I determined.
Selling GCBased on my morning analysis selling GC from Daily range high to the middle of the range. Going for 1:2 RR