Amazon (AMZN) Falters, Bears Eye 200 EMAI’m wondering whether Amazon has seen a major top on 3 November, given it saw a large gap into the high before momentum turned lower. This has the hallmarks of a ‘blow-off top’, which can occur at major turning points when bulls push a stock higher with such force – often via a gap – as a kind of ‘last hurrah’, only for momentum to then falter.
A 16.8% decline to its 200-day EMA then ensued and, while it has tried to rebound, it has also struggled to rise alongside the broader market.
Trading volumes were declining while prices rose, and Tuesday’s shooting-star candle formed near the September high and below the January high. Prices also gapped lower on Wednesday before finding support around the 50-day EMA.
Bears could look to fade moves towards the shooting-star high, with a retest of the 200-day EMA in focus.
Matt Simpson, Market Analyst at City Index.
Candlestick Analysis

GBPUSD Swing Trade Short Idea GBPUSD Swing Trade Short Idea based on HTF analysis. Price is trading near a weekly order block.

USDCAD – Bearish BiasUsing my Daily Bias Model, USDCAD is showing a clear Bearish Bias going into Thursday.
Here’s why:
Wednesday’s daily candle closed below Tuesday’s Low
Whether Wednesday swept Tuesday’s High or not does not matter for this condition
➡️ This confirms a Bearish Bias for Thursday.
Now during active trading session, we wanna see and old internal Highs being taken, or a trade into a lower timeframe FVG before trading to the main DOL (Previous D1 Low)
📌So in summary
Bias for Thursday: 🔻 Bearish
Expecting downward movement unless the daily structure shifts again.

Bitcoin predictionmy thoughts on Bitcoin, im on the fence about where price is heading to but I wouldnt be surprised if its heads lower.

EUR/AUD cracks 200DMA as bears circleDownside risks for EUR/AUD look to be building.
For the first time in 2025, the pair closed beneath the 200DMA on Wednesday, adding to the bearish signals delivered over the past week. With RSI (14) and MACD indicating building downside pressure, the message from price action and momentum indicators favours bearish setups over longs.
While its interactions with the level have been fleeting in recent times, of those that have occurred, it’s clear from the price action that traders pay attention to the 200DMA. As such, it can be used to build trade setups around.
Should the bearish break of the 200DMA stick, shorts could be established with a stop above for protection. 1.7670 saw buying over the past two days, so keep that on the radar should the price stall around the level again. If it does, consider nixing the trade. But if the bearish unwind extends, 1.7600, 1.7465 or 1.7400 provide target levels depending on your desired risk-reward.
While longs are not favoured right now, the 200DMA could also be used to build bullish setups should Wednesday’s break prove false, allowing for longs to be established above it with a stop below, targeting either 1.7750, the 50DMA or 1.7945 initially.
Good luck!
DS

Long trade 🟩 Buy-Side Trade
Buy-side Trade
Pair: EURUSD
Date: Wed 3rd Dec 2025
Time: 6:15 am
Session: London Session AM
📘 Trade Details
Entry: 1.16597
Profit Level: 1.16915 (0.273%)
Stop Level: 1.16584 (0.011%)
Risk–Reward (RR): 24.46
Correlation DXY
📗 Model / Structure
Bullish structure confirmed on 15m
BOS + displacement into premium zones
FVG → retracement → continuation model
Trend supported by EMA/WMA alignment
📙 Liquidity Story
Sweep of London open sell-side liquidity
Inducement below local swing low
Price targeted multiple FVGs stacked above
Liquidity magnets: 1.16850 → 1.16920
📕 Sentiment / Narrative
USD weakness during early LND session
EUR stable macro tone
High-volatility transition from Asia → London
Market repricing toward upper imbalance
📒 Outcome: Trade in session.

Next Week EURUSD Analysis There is more htf context to this but I will keep it brief. Weekly candle rejected 1.147 area, Smt of 3month lows with GU and DXY indicating that there is divergence between correlated assets, every downside target has been met we have just opened with a new monthly candle which usually makes the low the first week aswell. And we now have a weekly crt formed meaning we can target the high of the previous week pairing liquidity pools we already had a daily change in state so I am expecting daily ob to take us higher.

SPY reveals a setup for a short-term bearish swingThe analysis across both the daily (or 4-hour) and 30-minute charts of SPY reveals a high-probability setup for a short-term bearish swing. The primary signal, a classic Volume Price Analysis (VPA) indication of weakness, is the significant bearish divergence between price and volume. As the price has rallied to new highs over the past several sessions, the volume has been consistently decreasing. This 'No Demand' rally suggests a lack of professional participation and conviction, making the uptrend fragile and susceptible to a reversal.
On the longer timeframe chart, we observe price approaching an upper trend line resistance. Concurrently, the candles are becoming smaller, indicating a loss of upward momentum and exhaustion among buyers. This price action at a key resistance level, combined with declining volume, is a strong signal of distribution.
The 30-minute chart confirms this weakness on a granular level. The final push to the highs is not accompanied by a spike in volume; instead, the volume is subdued. This lack of 'effort' to break out suggests the move is likely a false breakout or an 'up-thrust' designed to trap eager buyers before a move down.
The confluence of these factors—testing resistance, slowing momentum, and most importantly, a clear price/volume divergence—points to a probable swing down over the next 2-10 days. The trade is to sell, anticipating a pullback towards the previous support/consolidation zone.

Nifty Analysis EOD – December 3, 2025 – Wednesday🟢 Nifty Analysis EOD – December 3, 2025 – Wednesday 🔴
25900 Holds: Buyers Force Doji After 170-Point Plunge.
🗞 Nifty Summary
The Nifty started with a bearish continuation sentiment, leading to a deep plunge of 170 points in the first half of the session. The selling pressure was halted around the 25900 level, where the index successfully found a base and stayed range-bound within approximately 35 points.
The 25950 level acted as a strong hurdle, trapping buyers multiple times. However, in a last-hour push, the index managed to breach this hurdle and successfully tested the psychological 26K mark before closing at 25,986.00, resulting in a loss of -46.20 points (-0.18%).
The day’s close was below the PDL and the 26K level, but the strong defense and recovery from the 25900 support zone are key takeaways. The resulting Daily Candle forms a Doji-like structure right on this important support, signaling potential base-building.
🛡 5 Min Intraday Chart with Levels
🛡 Intraday Walk
The day was marked by strong directional movement in the first hour, followed by dull consolidation within the Initial Balance (IB) range near the bottom. The deep dive confirmed the strong short-term bearish bias following the previous day’s close. However, the subsequent 95-point lower wick confirms that institutional buyers aggressively stepped in at the 25900 zone.
This strong support response is the most positive takeaway. The tight range consolidation near 25950 was eventually overcome, but the failure to close above 26K leaves the short-term bias ambiguous.
📉 Daily Time Frame Chart with Intraday Levels
🕯 Daily Candle Breakdown
Open: 26,004.90
High: 26,066.45
Low: 25,891.00
Close: 25,986.00
Change: −46.20 (−0.18%)
🏗️ Structure Breakdown
Type: Bearish candle (small body) — Doji-like Indecision.
Range (High–Low): ≈ 175 points — indicating elevated intraday volatility.
Body: ≈ 19 points — very small body, highlighting indecision with a slight bearish tilt.
Upper Wick: ≈ 62 points — buyers attempted upside but faced resistance quickly.
Lower Wick: ≈ 95 points — strong buying response from lower levels, forming a large lower shadow.
📚 Interpretation
The small real body and the long lower wick are classic signs of a potential base-building effort. The strong buying from the 25,891 low shows aggressive defense of the support zone. However, the close below 26K means the selling pressure hasn’t been completely negated. We need to watch closely to see if the market honors this Doji by reversing (bullish signal) or continuing the fall (bearish signal).
🕯 Candle Type
Indecision Candle with Bullish Lower-Wick Support — Next candle direction will decide short-term trend continuation or reversal.
🛡 5 Min Intraday Chart
⚔️ Gladiator Strategy Update
ATR: 193.38
IB Range: 144.6 → Big
Market Structure: ImBalanced
Trade Highlights:
11:33 Long Trade - Target Hit (R:R 1:2.33) (Trendline Breakout)
Trade Summary: The volatile initial plunge set a wide range. The strategy successfully capitalized on the strong reversal from the day’s low, capturing the long trade following the trendline breakout after the initial sell-off stabilized.
🧱 Support & Resistance Levels
Resistance Zones:
26030 ~ 26075
26104
26132 ~ 26160
26220
Support Zones:
25985
25930 ~ 25920 (Immediate Base)
🧠 Final Thoughts
“The Doji is the pause button.”
The key now is the 25900 level. Today’s action confirms that buyers are actively defending this psychological zone.
If tomorrow’s session trades and closes above the high of today’s Doji (26,066), we should see a resumption of the upward journey toward 26132. If the market breaks and sustains below 25,891, the short-term bearish move will continue toward 25850.
✏️ Disclaimer
This is just my personal viewpoint. Always consult your financial advisor before taking any action.

The expectation of interest rate cuts remains the core support.#XAUUSD TVC:GOLD OANDA:XAUUSD
✅ From the daily chart, gold prices are still above the MA5 and MA10. A prudent approach is to wait for a pullback to buy, or continue to use a buy-low-sell-high strategy until key resistance is broken. With the moving averages rising, the first support level to watch today is 4205-4195. If the price finds support and stabilizes in this area and strengthens again, the first resistance level to watch is the 4260-4270 area. This level represents both the previous high and a key level determining whether gold can hold above the 4300 mark.
✅ It is worth noting that if the price breaks below the support range of 4205-4195, it may retest the 4160-4140 area. It is particularly important to note that repeated testing of the same support level often signals weakness, and a cautious approach is necessary.

GER SELLLow probability high risk sells. Risk reasonably. Price is coming from an Imbalance after sweeping liq so sells is low probability for now.

EURJPY 2nd entry setup.Following overall bearish bias on this pair. Break and retest of structure.
Manage risk well if interested

Ford Motors Stock Supply and Demand AnalysisFord Motors is currently offering one of the cleanest supply and demand structures in the stock market. The bigger timeframes — monthly and weekly — are in full control, and as price reacts to these higher-timeframe imbalances, new daily demand levels are forming with exceptional strength.
This is exactly how professional price action develops: the higher timeframes establish control, and smaller timeframes follow by creating fresh pockets of imbalance.
Daily Demand at $12.60
This level shows:
- A strong departure
- Tight basing
- Powerful bullish impulse
Candles with minimal overlap
It stands out immediately as one of the clearest imbalances in the recent price action.
Why Patience Is Everything in Trading
Most retail traders ruin strong setups because they want to "be in the market." The truth is simple:
📌 Trading is about waiting. Not chasing.
Institutional imbalances take time to develop. Once they form, they provide clarity for days, weeks, or even months. Ford is now in such a phase.
As long as the daily and higher timeframe demand zones hold, a new bullish leg is the most probable outcome.

FireHoseReel | USDT.D : The Next Major Crypto Wave Is Starting🔥 Welcome to FireHoseReel!
Let’s dive into the USDT Dominance (USDT.D) market structure.
👀 USDT.D – 4H Overview
After a strong bullish rally, USDT Dominance has fully retraced its entire move and is now losing a key support zone. This is one of those levels you shouldn’t pass without a position — it’s a critical decision area.
🧮 RSI Analysis
The USDT Dominance RSI has formed an oversold zone around the 33 level. A breakdown and sustained move below this zone could trigger mass USDT selling and strong buying pressure in Bitcoin and altcoins.
✍️ Current Scenario for USDT Dominance (Simple Setup)
🟢 Long Scenario for the Crypto Market:
A clear break and candle close below 5.934%, ideally accompanied by RSI breaking below the 33 level, would confirm momentum. In that case, the move is expected to accelerate, and we’ll likely spend less time inside the position due to high volatility.
❤️ Risk Management & Emotional Discipline
Crypto trading is highly risky. Without proper risk management and emotional control, trading becomes no different from gambling.
Logic must always come before emotions. Learn to manage your trades and enjoy the process with control and discipline.

Month long accumulation in CMSINFO Lots of wicks in Weekly Time frame, 350 is good support. Expecting considerable pullback at least till 380.

ETH Take that Buy positionthe trend is going back bullish , you must be buying at this time , it's all about positionning to catch the trend

BITCOIN (BTCUSD): Bullish Reversal is Coming?!
On our yesterday's live stream, we discussed Bitcoin.
It looks like the market found a bottom and preparing for a bullish reversal.
To confirm a start of an uptrend, I suggest focus on
92000 - 94100 Order Block zone.
Its breakout and a daily candle close above will confirm a bullish reversal.
A formation of a Higher Low after the last retracement from that leaves
some clues of a weakening bearish momentum.
A breakout will be our final confirmation.
❤️Please, support my work with like, thank you!❤️
I am part of Trade Nation's Influencer program and receive a monthly fee for using their TradingView charts in my analysis.

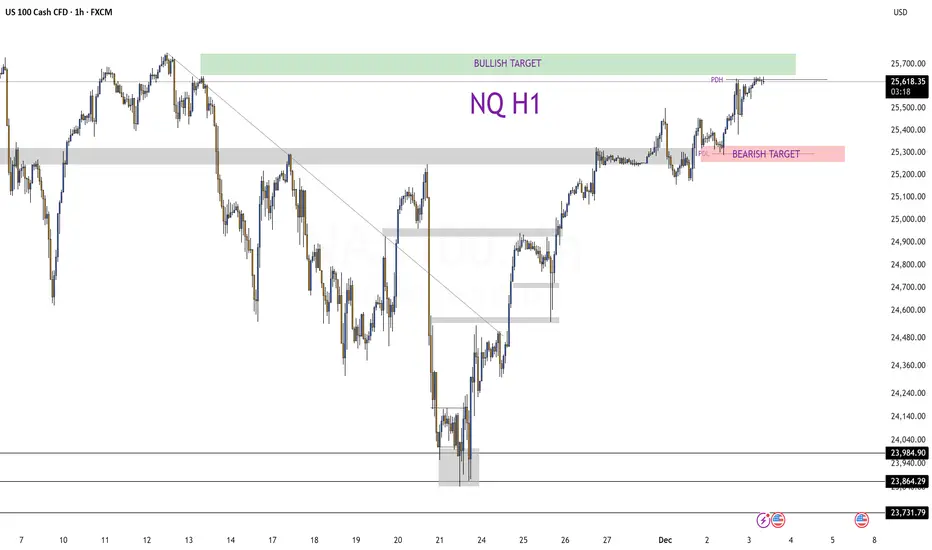
Nasdaq Hits Resistance: Pullback Before the Next Bullish Move?📊 Nasdaq – Technical Setup & Market Catalysts
The index recently tested a previously unfilled Fair Value Gap (H1 timeframe) and swept liquidity from last week’s accumulation — a process that often precedes new directional moves. The move cleared many trapped positions and reset the orderbook.
Currently, Nasdaq is sitting below a strong resistance zone; price appears to be weakening, which increases the probability of a short-term pullback toward the Previous Day Low (PDL) to collect more liquidity before any further upside attempt.
Momentum indicators and price structure suggest caution: while the general uptrend remains, a lack of upward acceleration and signs of hesitation point toward a possible consolidation or retracement.
🌍 Fundamental & Macro Context
Optimism remains in markets thanks to rising investor expectations of a rate cut by the Federal Reserve (Fed) this December. This sentiment supports risk assets, and tech stocks in particular — historically sensitive to interest rates and discounting future earnings.
However, some analysts warn that valuations in the tech sector — which heavily influence Nasdaq — are rich relative to earnings. The forward P/E ratio sits well above long-term averages, increasing vulnerability if economic data disappoints or if rate cuts are delayed.
Broader macro conditions remain fragile: global yield curves and bond markets show signs of stress, which could add volatility. Also, inflation trends and upcoming U.S. data releases could shift sentiment quickly.
🎯 What to Watch Next
Pullback zone: Look for support near the PDL or recent liquidity area — potential buying zone if price stabilizes.
Breakout zone: If Nasdaq breaks above resistance with strength and volume, upside is open toward higher targets set pre-rally.
Catalysts: Fed rate-cut expectations, upcoming economic data (inflation, employment, PMI), and tech sector earnings will influence direction strongly.
Gold Reclaims the Bullish Channel: Are Safe-Haven Flows About toGold has re-entered its bullish channel, showing that buyers continue to defend the structure despite recent volatility. From a technical perspective, price may still dip to PDL levels to collect liquidity before continuing higher, which aligns with typical channel behavior and liquidity cycles. The 4H trend remains strongly bullish, with price holding above the 20/50 EMA cluster and showing steady higher lows.
On the fundamental side, geopolitical tension between Venezuela and the United States keeps safe-haven demand elevated. Gold typically benefits during diplomatic uncertainty, and current market sentiment favors risk-off positioning. Additionally, the probability of a Federal Reserve rate cut in December continues to rise as inflation cools and labor data softens—both highly supportive for gold. Lower interest rates decrease real yields, making gold more attractive.
Overall, the confluence of safe-haven flows + rate-cut expectations + bullish technical structure keeps gold biased to the upside.

Bitcoin Analysis- Back Inside the Bullishh Channel📈 Bitcoin Analysis – Back Inside the Bullish Channel
After Monday’s sharp overnight drop, Bitcoin has shown a strong recovery, pushing back into the ascending channel and respecting its structure. Price has returned to the same zone where it was before the collapse, signaling that buyers are still defending key levels.
Technically, BTC rejected the midline of the bullish channel, failing to break above it—suggesting a possible need for a healthy pullback before continuation.
My preferred scenario remains a retracement toward the 92,000 support zone, which aligns with:
The lower half of the rising channel
A local demand zone from last week
The 0.382–0.5 Fibonacci retracement cluster of the recent recovery leg
From this area, I expect renewed bullish momentum as long as 92,000 holds.
🔍 Added Technical Factors
Higher lows remain intact despite volatility.
Volume on the recovery move was positive, indicating real demand.
The RSI on H4 is cooling off, supporting a potential pullback.
BTC continues to trade above the 50 EMA (H1)—short-term bullish bias.
🌍 Added Fundamental Factors
Risk appetite increased globally after softer U.S. inflation data, boosting crypto sentiment.
Fed officials continue hinting at possible rate cuts in early 2025, keeping BTC supported as liquidity expectations rise.
ETF inflows remain net positive, though slower this week—still a constructive long-term driver.
Reduced on-chain selling pressure from miners following difficulty adjustments helps stabilize price action.

FireHoseReel | All Eyes on Solana at This Critical Level🔥 Welcome to FireHoseReel!
Let’s jump into the Solana (SOL) market structure.
👀 SOL – 4H Overview
After breaking its descending curve structure, SOL faced strong resistance at $144 but failed to break it, leading to a sharp rejection.
Price then formed a double bottom and pushed back toward the same resistance. SOL is now trading near this critical zone once again.
📊 Volume Analysis
Volume increased significantly during the formation of the double bottom, driving a sharp move back toward resistance.
If buy volume remains sustained, the probability of a breakout above $144 increases.
✍️ SOL Trading Scenarios
You can use the following scenarios alongside your own trading strategy:
🟢 Long Scenario (Breakout Setup)
A confirmed breakout above $144, supported by a strong increase in buy volume, could provide a solid long opportunity on SOL.
🟢 Long Scenario (Aggressive Risk Setup)
Wait for price to consolidate, then enter during the pullback with decreasing volume, followed by the first signs of renewed buying pressure.
This setup allows for a tighter stop-loss and faster R:R, suitable for higher-risk traders.
🔴 Short Scenario
A loss of the key support at $124, accompanied by strong sell pressure, could activate a valid short setup for SOL.
❤️ Risk Management & Emotional Discipline
Crypto trading is highly risky. Without proper risk management and emotional control, trading is no different from gambling.
Logic must always come before emotions. Learn to manage your trades, and enjoy the process of trading with control and discipline.

FireHoseReel | BNB Daily Analysis #14🔥 Welcome to FireHoseReel!
Let’s dive into the Binance Coin (BNB) analysis.
👀 BNB – 4H Overview
BNB is currently trading just below its major resistance at $900, a level that holds both strong psychological and technical importance.
A clean break above this zone could activate our primary long trigger.
📊 Volume Analysis
During the recent market crash, BNB faced heavy selling pressure, followed by strong buyer absorption, which allowed price to recover with rising buy volume.
If this buy-side momentum remains sustained, BNB will have a strong chance to break above the $900 resistance.
✍️ BNB Trading Scenarios
Here are the active scenarios you can use alongside your own trading strategy:
🟢 Long Scenario (Breakout Setup)
A confirmed breakout above $900, supported by a clear increase in buy volume, can provide a solid long entry opportunity.
🟢 Long Scenario (Low-Risk, Fast R:R Setup)
For traders seeking tight stops and quick risk-to-reward, wait for price to consolidate, then enter during the pullback with decreasing volume, followed by the first signs of volume expansion.
🔴 Short Scenario
A breakdown below $872, followed by the formation of a lower high, could create a multi-timeframe bearish structure. A confirmed structure break on that pattern may open a short setup.
❤️ Risk Management & Emotional Discipline
Crypto trading is highly risky. Without proper risk management and emotional control, trading is no different from gambling.
Logic must always come before emotions. Learn to manage your trades, and enjoy the process of trading with control and discipline.
Us30 On the daily, the previous day candlestick closed below a major key level 47500.
What do u think the directional bias be for today (Daily & 4 TF)
