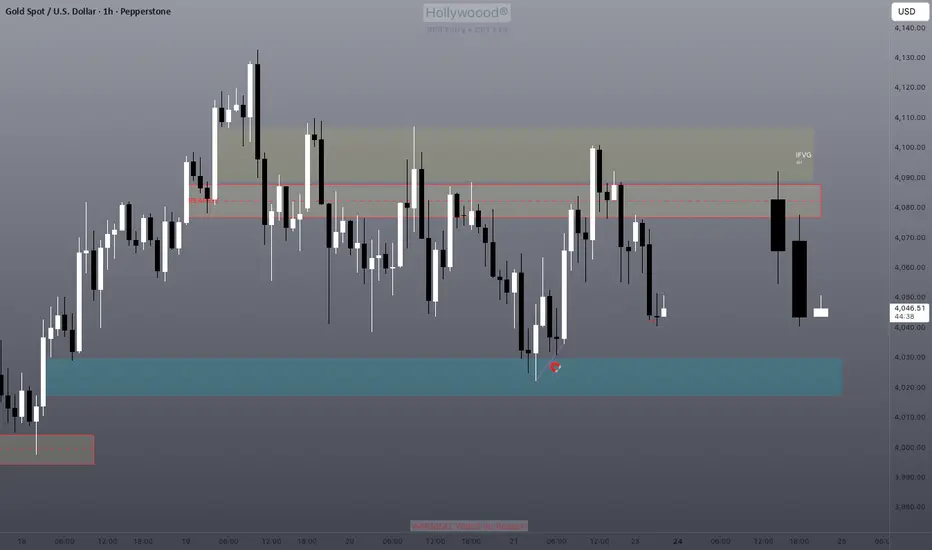
Imbalance below range seems to be the current targetBlue zone is the bullish imbalance that was left behind last week.
Price only targets lows or imbalances below support during sell-offs. Let's see what we get with this one.
Candlestick Analysis
Zen - BullishThis weekly chart shows a multi-year compression range that has repeatedly expanded into large upside volatility when price reclaims the same set of mid-range levels. Every major impulse in the past two years began from failed breakdowns and quick recoveries inside this zone.
Price has once again expanded off the lower boundary and reclaimed the mid-range area around 11–12. Historically, this has triggered strong follow-through moves as volatility shifts from contraction to expansion. The prior expansion legs from this level pushed into the 15, 25 and 57 zones, which are marked as upside projection targets.
The structure is simple: long-term support continues to hold, breakdowns fail, and each reclaim of the mid-range leads to aggressive expansion. As long as price holds above the weekly levels shown, the next expansion phase remains intact with the same historical upside ranges active.

VET - BullishThis chart highlights how VET behaves when volatility expansion occurs at major swing levels.
There are two clear reference points marked.
The first is the expansion that lasted sixteen candles. That move defined the prior expansion cycle and shows how price behaves when it breaks out of a compressed range with rising volatility. It also provides a baseline for cycle duration and expected reach.
The second is the current three day expansion signal on the right side of the chart. Price is pressing into a multi-month support floor while the market has been contracting for an extended period. This is the same condition that preceded the last major expansion. The repeated small-range candles, declining volatility, and low momentum readings all confirm compression.
The expansion targets are mapped using both the three day and sixteen day fib projections. The initial levels sit at zero point zero two four four nine and zero point zero two eight two zero four. The extended cycle levels sit at zero point zero four one seven six, zero point zero five three eight five, and zero point zero six nine two seven. These reflect the historical reach of prior volatility expansion cycles and outline the potential move if the current base holds.
The shaded zones represent the probable path of expansion if volatility normalizes. The key point is that price is forming another expansion trigger at the bottom of the range while the broader structure remains unchanged. When these conditions align, the market has repeatedly responded with strong multi-week expansion cycles.

Descending channel ETH/USDTSeems like we've found ourselves in a channel. It tried to breakout above it, but it couldn't. Let's see what happens now.

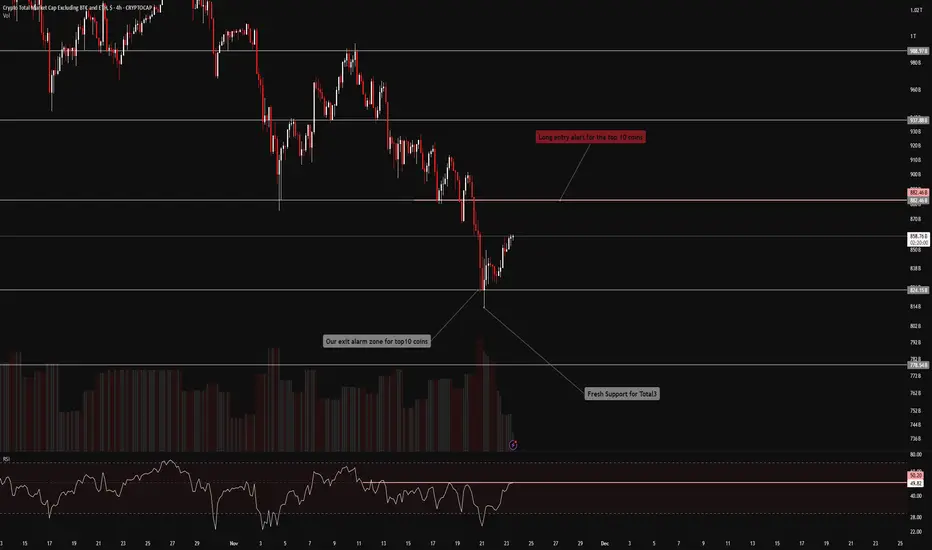
FireHoseReel | Total3: One Breakout Could Flip the Entire Market🔥 Welcome FireHoseReel !
Let’s break down what’s happening with TOTAL3 and see how the altcoin market is shaping up right now.
⭐ TOTAL3 Market Structure Update
The altcoin market (TOTAL3) has formed a solid support base around $824B after the recent pullback and is now pushing upward toward its major resistance at $882B.
A clean breakout above this zone could spark a broader bullish continuation, activate long triggers across top altcoins, and shift the market into a risk-on phase.
📊 RSI Momentum
The RSI is currently battling the 50 level, which has repeatedly acted as strong static resistance.
A confirmed breakout above RSI 50 would strengthen bullish momentum and support upward continuation — most likely during the China open session, where volatility usually increases.
🎯Impact on Top Altcoins
If USDT dominance declines, the top altcoins are likely to gain momentum quickly.
This can accelerate breakouts, create strong bullish impulses, and open up high-probability profit opportunities as liquidity rotates back into alts.
🧭 Trading Perspective
This is the kind of environment where staying close to the charts is essential.
Wait for index confirmations before entering new positions.
A potential altcoin rally could begin from these zones — and with proper risk management, layered entries across multiple altcoins can be highly effective.
🛞 Risk Management & Disclaimer
Please remember to always use proper risk management and position sizing. Nothing in this analysis is financial advice. The market can change quickly, so always trade based on your own strategy, research, and risk tolerance. You are fully responsible for your own trades.
GBP/AUD Downside in FocusAnother failed breakout above 2.0300 resistance has produced a shooting star reversal pattern on the charts, signaling potential near-term downside for GBP/AUD. With risk appetite improving as the new week begins, the high-beta Aussie may benefit more than the lower-beta pound, reinforcing confidence in the bearish price signal.
If price remains capped beneath 2.0300, shorts could be considered below the level with a stop above for protection, initially targeting the November 13 uptrend near 2.0180. A break of that level would put 2.0150—where buying emerged last week—on the radar, along with support at the psychologically important 2.0000 mark.
For now, momentum indicators offer a neutral directional bias. RSI (14) is trending higher and sits just above the neutral 50 level. MACD remains in negative territory but has crossed the signal line from below, suggesting diminishing downside pressure. Taken together, the message favors price signals over holding a fixed bias.
Good luck!
DS

FireHoseReel | TAO: Breakout Loading Don’t Be Late This Time🔥 Welcome FireHoseReel !
Let’s break down what’s happening with TAO (Bittensor) right now.
👀 TAO – Price Action Overview
After the recent drop, TAO has formed a strong support at $267.6. From this level, buy volume increased and price started pushing upward toward its resistances. Along the way, TAO managed to break several multi-timeframe resistances, showing that seller pressure has weakened and buyers are stepping in more confidently.
Our long trigger is at $310, and a clean breakout above this level can give us a valid long setup.
📊 Volume Analysis
Following the recent declines, TAO’s volume temporarily dropped. However, during the last sell-off, buy volume noticeably increased, causing a sharp move and breaking the $310 support earlier.
For a proper breakout this time, we need strong buy volume to trigger a short squeeze above the resistance zone.
✔️ Price Behavior Near Resistance
TAO is currently interacting with this resistance for the first touch, which often leads to rejection.
Better long setups typically form after the second touch and onward, when buyers show stronger control and volume convergence improves.
🔗 TAO/BTC Pair Perspective Looking at the TAO/BTC pair, price is approaching a key resistance zone sitting at the top of its previous trading range.
A breakout above this level can create a high-momentum move, especially if Bitcoin dominance rises.
This alignment increases the probability of continuation on the TAO/USDT pair as well.
✍️ Long Scenario
A long setup becomes valid if the following conditions align:
• Breakout above $310
• Increase in Bitcoin dominance (BTC.D)
• Decrease in USDT dominance (USDT.D)
• Strong buy volume and clean multi-timeframe volume convergence
• Ideally entering after the second touch into resistance
If these conditions are met, the long scenario becomes much stronger and more reliable.
🛞 Risk Management & Disclaimer
Please remember to always use proper risk management and position sizing. Nothing in this analysis is financial advice. The market can change quickly, so always trade based on your own strategy, research, and risk tolerance. You are fully responsible for your own trades.

Injective - Bullish This idea focuses on how volatility expansion behaves around major structural levels on INJ using the three day and weekly charts.
The first key reference point is the 2023 bottom on the left side of the chart. Price produced a cluster of exhaustion style candles, volume spiked, and volatility was compressed before a full expansion cycle began. That entire sequence is included as a historical example of how volatility expansion typically starts from deep compression and reclaimed structure.
The second and most important focus is the current setup. Price has retraced directly into the same major support shelf that launched the previous expansion cycle. The yellow arrows on the weekly chart highlight the structural zone and how cleanly price is retesting it. This level also aligns with the seventy eight six retracement, giving both structural and fib confluence.
The volatility panels show compression building again. Momentum is fading into support and historical volatility is sitting at the lower end of its range. This type of environment has repeatedly been the base condition for volatility expansion to occur when support holds.
On the right side of the chart the fib projections outline the potential expansion legs. Eleven point three seven one and fifteen point seven six nine are the initial targets if price stabilizes above support. Twenty four point four three five and fifty five point two eight seven represent extended cycle targets based on prior expansion behavior.
The idea is simple. Price is retesting a major level with volatility compressed. Historically this combination has led to strong expansion cycles. The next move depends on whether this structural shelf holds or fails.

Bitcoin - Last Leg UpBitcoin should have its last leg up before going into a bear market like draw down. This would be an area where buyers could step back in changing market dynamics.
This follows the similar patter 4 years ago when everyone was caught off guard by a dead cat bounce and "altcoin" season.
There are a lot of similarities between now, 2019, and 1990 in terms of macro-economic backdrop, rate cute cycles, and price "action".
I do think Bitcoin will make a new all time high during this leg up topping at around 140k.

BTC HAMMER REVERSAL (1D) - UPTREND LIKELYWe see a hammer reversal candlestick pattern on the 1D BTC chart (Nov. 23, 2025). This reversal coincidentally occurred at the 1.272 fib level, the 1 is anchored at the 2021 high (69,000) and the 0 is anchored at the Nov. 2022 low (FTX black swan).
I expect a reversal here. Keep an eye out on the charts!

Long trade
Trade Journal Entry
Pair: LINKUSDT.P
Trade Type: Buyside Trade
Date: Sat 22nd Nov 25
Time: 3:00 pm
Session: NY Session PM
Timeframe: 15 min
1. Trade Parameters
Entry: 11.975
Profit Level: 12.922 (+7.99%)
Stop Level: 11.922 (−0.43%)
Risk-to-Reward: 18.06 R
2. Context & Structure
The setup follows a three-session accumulation sequence (Tokyo → London → NY), forming a descending wedge within the discount range of the prior bearish leg.
The London session sweep of liquidity below 11.80 marked the final inducement before NY expansion.
The Daily Open acted as a midpoint magnet where price consolidated before displacement.
BOS (Break of Structure): confirmed on NY PM session with clear displacement above the Asian high.
EMA alignment:
50 EMA crossed above 200 EMA, signalling intraday structural reversal.
Both EMAs now serve as dynamic support zones.
3. Liquidity Story & Smart-Money Model
The sell-side liquidity beneath the 11.70–11.80 range was swept before bullish expansion.
Imbalance/FVG blocks between 11.83 – 12.18 were efficiently filled on the breakout, leaving new unmitigated FVGs below for potential re-entries.
PD Array narrative:
The price transitioned from a discount (accumulation) to equilibrium, with current targets aimed at premium inefficiencies (12.80–12.95). Multiple internal FVGs (12:18 → 12:45 → 12:68) act as continuation stepping zones.
4. Wyckoff / SMC Alignment
Wyckoff Phase Observation ICT / SMC Equivalent
Phase C London sweep of the range lows, Liquidity inducement
Phase D NY displacement through range high Break of Structure (BOS)
Phase E Retest of bullish order block & continuation
FVG + OB confluence entry
5. Volume & Confirmation
Noticeable increase in volume during the breakout of the wedge — signalling institutional participation. Volume distribution shows progressive expansion on bullish candles and contraction on retracements, consistent with smart-money accumulation → expansion behaviour.

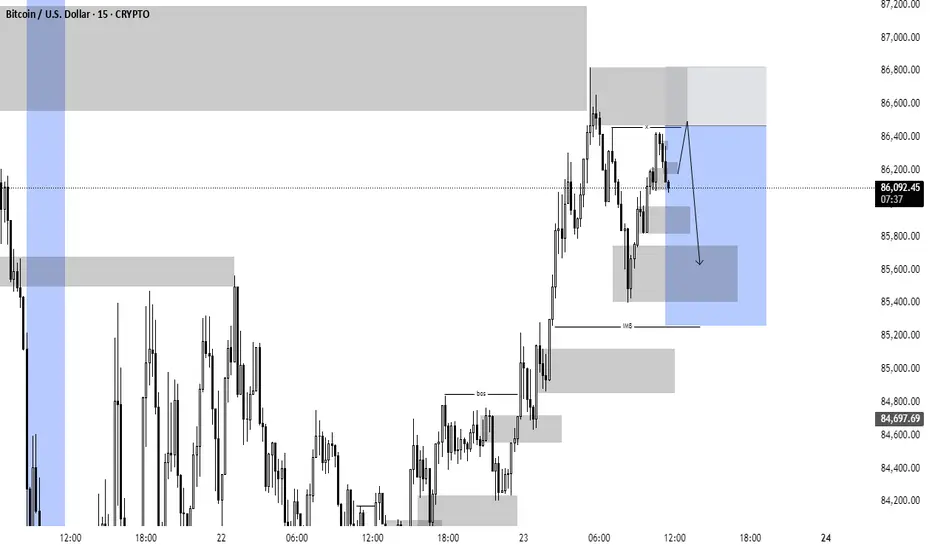
Bitcoin scalp sells?Low probability sell setup on Bitcoin targeting Demand zones. Price might diregard the setup and keep moving lower now since it has mitigated higher timeframe supply.
Manage risk well.

Long trade
15min TF overview
🟩 Pair: TONUSDT.P
Direction: Buyside Trade
Date: Sat 22nd Nov 25
Time: 3.00 pm
Session: NY Session PM
Timeframe: 15 minutes
Model: Accumulation → Manipulation Sweep → Expansion
🔹 Trade Details
Entry: 1.5217
Profit Level: 1.7829 (+13.57%)
Stop Level: 1.5139 (–0.51%)
Risk-Reward Ratio: RR 26.47
Optimal Trade Entry (OTE)
NY PM session liquidity window
FVG boundary
Breaker block origin
Discount within the swing range
TP zones
1. Internal Liquidity: 1.563 – 1.585 (NY session high cluster)
2. External Liquidity: 1.7005 price level (major inefficiency fill)
3. Premium Imbalance Completion: 1.7829 (Your target)
🔹 Sentiment & Narrative Analysis
Market Cycle Phase:
Micro accumulation inside macro distribution.
Psychological Narrative:
We anticipated that retail traders would be selling the breakdown at the wedge lows, providing liquidity for smart money. With the NY PM session acting as the catalyst for expansion, with price drawn towards the premium side, inefficiencies positioned above.
Sentiment:
Turning from fear → disbelief → rally.

FireHoseReel | BNB Daily Analysis #4🔥 Welcome FireHoseReel !
Let’s dive into the analysis of BNB (Binance Coin).
👀 BNB – 1H Timeframe
BNB is currently breaking through its multi-timeframe resistance around $842.
If price forms a higher low above this zone, we can take it as a valid confirmation for bullish continuation.
Keep in mind: the long trigger sits at $880, which makes this setup a bit risky.
📊 Volume Analysis
The volume indicator is showing rising multi-timeframe buy volume, which is different from previous behavior on the left side of the chart.
This suggests a healthy convergence of buying pressure, showing that sellers are weakening, market fear is fading, and investors are slowly stepping back in to accumulate at these levels.
✔️ BNB/BTC Pair Perspective To look at things differently, we also check the BNB/BTC pair, which helps us understand the structure more deeply.
The pair is still in the same condition as yesterday, with one difference:
The multi-timeframe resistance at 0.0991 could become a risky long trigger.
A breakout above this zone may push momentum into the BNB/USDT pair as well.
✍️ Let’s break down the trading scenarios for BNB on the 1H timeframe.
🔼 Long Scenario:
We need:
• Strong buyer support and increased participation
• Continued multi-timeframe volume convergence
• Breakout of key resistance zones on both BNB/USDT and BNB/BTC
If these conditions align, we can take a low-risk (0.5%) long entry on the breakout.
If needed, we can also add to the position on higher resistance breakouts.
🔽 Short Scenario:
A breakdown of the key support levels on the chart + clear selling pressure can give us a valid short or exit signal.
This breakdown may also require a break of USDT dominance resistance, which would strengthen the bearish move.
🛞 Risk Management & Disclaimer
Please remember to always use proper risk management and position sizing. Nothing in this analysis is financial advice. The market can change quickly, so always trade based on your own strategy, research, and risk tolerance. You are fully responsible for your own trades.

Nifty Analysis EOD – November 21, 2025 – Friday🟢 Nifty Analysis EOD – November 21, 2025 – Friday 🔴
Bulls Fail to Sustain Rally; Panic from Global Markets
🗞 Nifty Summary
nfluenced by negative global news, the Nifty started with a 71-point Gap Down and quickly lost another 30 points. The 26100 psychological support came to the rescue initially, triggering an 80-point bounce from the day’s low. However, the crucial swing resistance at 26170 acted as a firm ceiling, pushing the index back down sharply by 118 points. This move set the temporary day low at 26,055.95.
After a period of tight consolidation (15-18 points range), a second rally attempted to breach 26170, but this upward move fizzled out due to renewed selling pressure. The Nifty closed near the day’s low at 26,068.15, resulting in a loss of -124.00 points (-0.47%). The panic was clearly driven by global clues.
Despite the drop, the close and low are near the previous day’s low and the November 19th high, suggesting the long-term bullish structure remains technically intact.
Action planning must await Monday’s session closing.
🛡 5 Min Intraday Chart with Levels
🛡 Intraday Walk
The session was highly volatile, characterized by sharp 80-point swings, almost entirely contained within the Initial Balance (IB) Range. The initial fake-down below the IB Low served as a bear trap, leading to the morning bounce.
However, the consistent rejection at the 26170 level was the defining feature of the day. Every attempt by bulls to reclaim higher ground was met with aggressive selling, culminating in a close almost at the low of the day. This type of price action offers good opportunities for intraday traders but highlights structural uncertainty for the swing bias.
📉 Daily Time Frame Chart with Intraday Levels
🕯 Daily Candle Breakdown
Open: 26,109.55
High: 26,179.20
Low: 26,052.20
Close: 26,068.15
Change: −124.00 (−0.47%)
🏗️ Structure Breakdown
Type: Bearish candle with a strong upper wick.
Range (High–Low): ≈ 127 points — moderate intraday volatility.
Body: ≈ 41 points — controlled but clear downside pressure.
Upper Wick: ≈ 69 points — strong selling pressure and rejection at the higher levels (26170 zone).
Lower Wick: ≈ 16 points — mild buying from the day’s lows but ultimately insufficient to shift the closing momentum.
📚 Interpretation
The strong upper wick is the most important structural element, indicating that sellers aggressively entered the market every time the index attempted to rise. The close near the low confirms that the sellers maintained control throughout the session, despite the initial bounce from the 26100 support. This candle is a clear sign that overhead supply is active near the recent highs.
🕯 Candle Type
Bearish Candle with Strong Upper-Wick Rejection — A clear signal that resistance is active and the upward momentum has paused.
🛡 5 Min Intraday Chart
⚔️ Gladiator Strategy Update
ATR: 191
IB Range: 80.55 → Medium
Market Structure: Balanced
Trade Highlights:
10:56 Long Trade - Target Hit (R:R 1:2.89)
Trade Summary: The strategy successfully captured the morning counter-trend bounce, demonstrating adaptability to the initial range-bound fakeout. The volatility offered limited opportunities, but the core profitable trade capitalised on the immediate reaction at the 26100 support.
🧱 Support & Resistance Levels
Resistance Zones:
26104
26135
26180 (Crucial Rejection Level)
26220 ~ 26245
26277 (ATH)
Support Zones:
26075 ~ 26040 (Current Holding Zone)
26000 (Psychological Support)
25950 ~ 25940
🧠 Final Thoughts
“The bulls must defend the lower ground to maintain the structure.”
The close near the lows means the market is vulnerable to further downside, but the crucial structural support lies in the 26040 ~ 26000 zone. The bullish structure is intact only if Nifty successfully holds this band.
A decisive breach above 26180 is required to signal renewed confidence toward the ATH.
Until then, stay cautious and respect the volatility.
✏️ Disclaimer
This is just my personal viewpoint. Always consult your financial advisor before taking any action.
