US DOLLAR INDEX (DXY): Classic Breakout TradeThe Dollar Index successfully broke and closed above a significant daily horizontal resistance cluster earlier this week.
Following this, the pair started to consolidate on a 4-hour timeframe, retesting the previously breached structure.
A bullish breakout of this consolidation serve as a strong confirmation of further upward movement.
It is highly probable that the price will continue to ascend, potentially reaching at least 98.20.
Candlestick Analysis
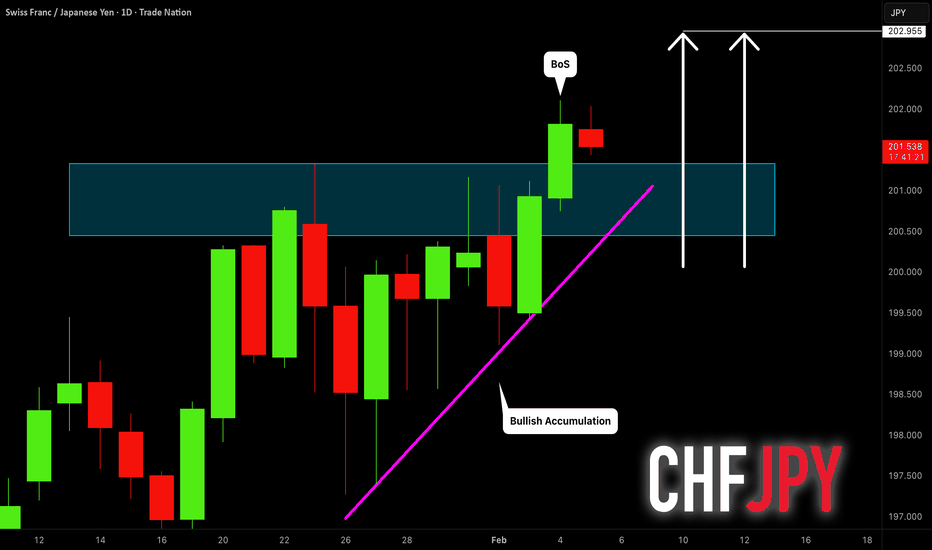
CHFJPY: Important Breakout 🇨🇭🇯🇵
CHFJPY broke a horizontal neckline of an ascending
triangle pattern on a daily time frame.
The next strong resistance that I see is 202.93 level.
With a high probability, it will be reached soon.
❤️Please, support my work with like, thank you!❤️
I am part of Trade Nation's Influencer program and receive a monthly fee for using their TradingView charts in my analysis.
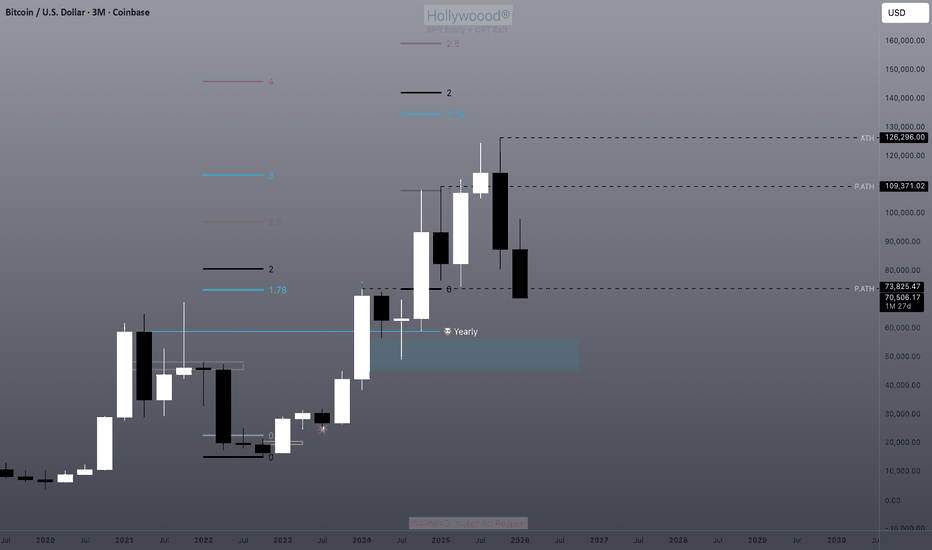
NQ and ES quarterly theory cycle.There you have it ,the manipulation has happened ,just go check on my previous analisi here attached.
IF the leg in the purple box will be broken ,meaning that the weekly down colse candle will close below the lower previous swing ,we will certainly see new lower targets for the year to come .
gbpusd shortsprevious week closed with a reversal candle after taking buyside external range liquidity.
Monday opened with a bearish expansion leaving a bearish fvg untapped.
Tuesday traded as an inside bar candle.
today takes both Monday and Tuesday highs into a bearish fvg and a 4hour bearish orderblock from last week.
smt with eurusd is confirmed with eurusd failing to take Monday highs.
a 1hour cisd confirms the daily bearish bias.
taking the trade after 1hour cisd and targeting Monday lows for a 1:4R
#CHFJPY: Important BreakoutThe CHFJPY pair has successfully violated a resistance level within an ascending triangle pattern on the 4-hour timeframe.
This previously broken structure is now anticipated to act as a robust support level.
It is possible that the pair will continue its upward trend following a brief retracement, with the next target set at 202.50.
BTCUSD 4HR Timeframe Anlysis (03.02.26)On the 4HR Time frame, there exists:
- An inverted FVG
This FVG was created when price ran 31.01.26's low and consolidated at the breaker block which has now been invalidated.
I anticipate the iFVG to hold and price to trade lower to a nearby low before further bullish movement.
Let's see.
Cheers.
BTCUSD Daily Timeframe Analysis (03.02.26)There exists :
- Fair Value Gap on the daily,
- Previous Days high and low, and
- Weekly to daily fair value gap range below price.
Price is has taken out the previous days low, tapped into the upper half of the weekly - daily fair value gap range, and rejected
There is still an open range of the fair value gap from the weekly timeframe transposed to the daily.
Daily Timeframe analysis
Balkrishna Industries Ltd (NSE) — Positional Long Setup | 1DPrice: ₹2,571
Timeframe: Daily
Trend Type: Medium-term bullish reversal / retracement continuation
🔍 Technical Overview
Balkrishna Industries has completed a major corrective phase and is now trading within a well-defined Fibonacci retracement zone, indicating accumulation after a prolonged downtrend.
Key observations:
Price has respected the 0.5–0.618 Fibonacci retracement support zone (₹2,405–₹2,535), suggesting strong demand.
Formation of higher lows indicates gradual trend reversal.
RSI is turning upward from lower levels, signaling improving momentum.
Volume expansion near the base supports accumulation behavior.
📐 Key Levels (Fibonacci Based)
Strong Support Zone: ₹2,405 – ₹2,535 (0.5–0.618 retracement)
Immediate Resistance: ₹2,745
Target 1: ₹2,956 (-0.382 Fib extension)
Target 2: ₹3,081 (-0.618 Fib extension)
Extended Target: ₹3,375 (previous supply / range high)
🎯 Trade Plan (Positional)
Entry:
Buy on dips near ₹2,520–₹2,560
Or on a daily close above ₹2,745 for confirmation
Targets:
🎯 T1: ₹2,956
🎯 T2: ₹3,081
🎯 T3 (Positional): ₹3,350+
📌 Conclusion
Balkrishna Industries is showing early signs of a trend reversal after a deep correction. As long as price holds above the ₹2,405 support, the structure remains bullish, with upside potential toward ₹3,000+ in the coming months.
⚠️ Wait for confirmation and manage risk as per your trading plan.
How to Trade Price Action Patterns in TradingViewHow to Trade Price Action Patterns in TradingView
Master price action pattern recognition using TradingView's charting tools in this comprehensive tutorial from Optimus Futures.
Price action patterns are among the most time-tested technical analysis methods available.
They help traders identify potential reversals, continuations, and high-probability entry points directly from candlestick formations.
What You'll Learn:
Understanding price action patterns: reading market psychology through candlestick formations
The two main pattern categories: reversal patterns and continuation patterns
Essential reversal patterns: pin bars, engulfing candles, and double tops/bottoms
How pin bar wicks reveal price rejection at key levels
Bullish and bearish engulfing patterns for identifying shifts in control
Double tops and bottoms as significant turning point signals
Key continuation patterns: flags, triangles, and inside bars
Using TradingView's built-in candlestick pattern recognition indicators
Manual pattern identification techniques and optimal timeframes
Practicing with TradingView's bar replay feature
The importance of context: trading patterns at support and resistance zones
Entry timing: waiting for confirmation candles
Stop placement strategies for different pattern types
Calculating measured move targets for profit-taking
Multiple timeframe analysis for added conviction
Combining price action with volume analysis for confluence
Aligning patterns with Fibonacci levels and prior swing points
This tutorial may benefit futures traders, swing traders, and technical analysts who want to read price action directly without indicator lag.
The concepts covered could help you recognize high-probability setups, time entries more precisely, and understand the buyer/seller dynamics behind each candlestick formation.
Learn more about futures trading with TradingView: optimusfutures.com
Disclaimer:
There is a substantial risk of loss in futures trading. Past performance is not indicative of future results. Please trade only with risk capital. We are not responsible for any third-party links, comments, or content shared on TradingView. Any opinions, links, or messages posted by users on TradingView do not represent our views or recommendations. Please exercise your own judgment and due diligence when engaging with any external content or user commentary.
This video represents the opinion of Optimus Futures and is intended for educational purposes only. Chart interpretations are presented solely to illustrate objective technical concepts and should not be viewed as predictive of future market behavior. In our opinion, charts are analytical tools, not forecasting instruments.
TECHM bullish breakout above. Resistance Buliish breakout above, resistance, Price has confirmed a bullish breakout above a key resistance zone, indicating a potential shift in short-term trend. The breakout is supported by a strong reversal from the Fibonacci 0.5 retracement level, which previously acted as a demand area.
This confluence of resistance-turned-support and Fibonacci support strengthens the bullish bias. If price sustains above the breakout level, momentum continuation is likely.
📈 Trade Outlook
Bias: Bullish
Confirmation: Sustained price action above resistance
Upside Potential: 4–7% in the near term
Invalidation: Breakdown below the 0.5 Fibonacci support
Conclusion:
As long as price holds above the breakout zone, the structure favors buyers. A continuation move towards higher levels is expected, while failure to hold support may lead to consolidation or a pullback.
⚠️ Trade with proper risk management and confirmation from volume or momentum indicators.
Karur Vysya Bank Ltd (KARURVYSYA) – Weekly Chart AnalysisTrend: Strong Bullish
Timeframe: Weekly
CMP: ~₹296
🔍 Technical Overview
The stock is in a clear higher high–higher low structure, confirming a strong primary uptrend.
Price has decisively moved above the 0.382 Fibonacci retracement (~₹304) zone and is consolidating just below the 0.618 Fibonacci extension (~₹321–322).
The recent rally shows strong bullish momentum supported by volume expansion, indicating institutional participation.
Relative Strength vs NIFTY is rising, showing outperformance.
🟢 Key Levels
Immediate Support: ₹275–280 (Fib 0 level / demand zone)
Major Support: ₹245–250 (0.382 Fib retracement & prior breakout base)
Immediate Resistance: ₹320–322 (0.618 Fib extension)
Next Upside Targets:
🎯 Target 1: ₹320
🎯 Target 2: ₹340
🎯 Target 3: ₹360+ (on sustained breakout and retest)
📈 Trade Plan (Positional / Swing)
Buy on dips: ₹280–290 zone
Aggressive Buy: Weekly close above ₹322 with volume confirmation
⚠️ Risk Factors
Failure to break ₹320 may lead to short-term consolidation.
Broader market weakness could delay upside but structure remains bullish unless ₹270 breaks decisively.
🧠 Conclusion
KARURVYSYA is structurally strong on higher timeframes. As long as the price holds above the ₹275 support zone, the bias remains bullish with ₹320+ as the immediate breakout trigger. Suitable for positional traders and long-term investors tracking banking sector strength.
GOLD (XAU/USD) : Liquidity Grab & Bullish Confirmation Gold formed a liquidity grab following a test of significant intraday/daily support.
The formation of a cup and handle pattern, along with a violation of its neckline, offers a strong bullish confirmation.
I anticipate an upward movement now, at least to the 4935 level.
US30 – DAILY (SELL FROM SUPPLY)Price is reacting from a strong DAILY supply & resistance zone, with buyers showing exhaustion at highs.
🔻 Rejection from resistance
🔻 Weak bullish follow-through
🔻 Supply clearly defended
🎯 Targets: 49,000 → 48,300
🛑 Invalidation: Daily close above 49,650
Bias: Sellers to push price toward next demand.
Dollar Index - Don't Trust Relative Equal HighsObvious Highs Provides Opportunity For Those Who Short Dollar Over The Weekend To Place A 'Safe' Stop Loss With The Intention Of Targeting New Intra-Day Lows.
Sentiment Is Bearish Which Is, At Times A Breeding Ground For Low Resistance Liquidity Run.
Targeting 97.348 (75% Quadrant NWOG Range) As The 1st Point Of Interest.
97.546 - 97.738 Is My Terminus
Check Out My GBPUSD And EURUSD Analysis. All Aligns Up Perfectly.
Dollar Index - Aiming For Low Hanging FruitsThe Question Many Will Ask Is... When Is The Bottom Of The Market For Dollar?
Right Now, I See The Potential For Short-Term Rallies Up to Previous Highs, With 97.348 Being A High Probability Zone For The Algorithm To Reprice Up to.
Ultimately, I Studying Dollar With The Belief That The Rally Could Be Stronger Than I Expect, Aiming For The 97.738 - 97.456 Daily IFVG
Euro - Can Your Set-Up Pay Bills? This Could...As A Scalper, I Jump All Over High Probability Opportunities, Even If It Only Yields A Small Pip Gain.
Patterns And Signatures Like This Play Out Every Single Day (Don't Take My Word For It, Check It Out Yourself)
1.18330 Is On My Radar As A Price Of Interest Going Into The First 2 Days Of The Week.
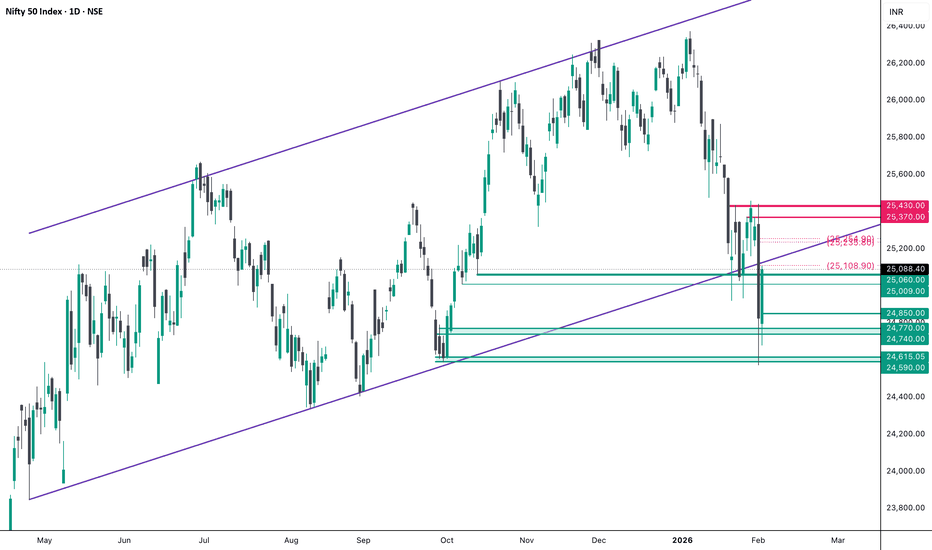
Nifty Analysis EOD – February 2, 2026 – Monday🟢 Nifty Analysis EOD – February 1, 2026 – Sunday 🔴
Here is Today's Nifty Movement Chart :
Hi everyone,
I will be on vacation for one week, so I will not be able to share the daily reports during this time.
I look forward to catching up when I return. I wish you all a great week of trading.
Best regards,
Kiran Zatakia
GBPCHF SHORTSMarket Structure bearish on HTFs 3
Entry at Daily AOi
Weekly Rejection at AOi
Previous Weekly Structure Point
Daily Rejection At AOi
Previous Daily Structure Point
Around Psychological Level 1.06000
Touching EMA H4
H4 Candlestick rejection
Rejection from Previous structure
TP: WHO KNOWS!
Entry 110%
REMEMBER : Trading is a Game Of Probability
: Manage Your Risk
: Be Patient
: Every Moment Is Unique
: Rinse, Wash, Repeat!
: Christ is King.


