Worldcoin —The downtrend endsSince March 2024 here we have a downtrend. If the downtrend ends, we get a new market cycle. It can be either sideways or bullish. For a sideways period to start, there must be some sort of change first. This is to say that a bullish move comes next regardless of how you slice it.
Worldcoin (WLDUSDT) is ending its downtrend based on multiple chart signals. It has been crashing since March 2024 with a bottom being hit October 2025. After October 2025, no new lows.
Last week we have a Doji. It comes up at the end of a very long downtrend and also as a higher low compared to the October 2025 all-time low. This Doji works as a reversal signal.
The fact that this week turns green, is full green and about to close in this way, confirms the Doji as a reversal signal. Thus, the end of the downtrend.
The end of the downtrend implies the start of a new market phase. This new market phase means Worldcoin will stop dropping; it means higher prices.
Namaste.
Chart Patterns

US10Y Daily priceaction and directional bias.US10Y is the yield on the U.S .10-year treasury notes government debt security maturing in 10 years that serves as a global benchmark for interest rates, reflecting investors expectations on growth ,inflation and federal reserve policy.
The US10Y represents the effective return investors demand to lend to united states government for a decade(10years).it moves inversely to bond prices, on technical, when yields are rising which signals stronger growth while falling yields indicates economic caution or safe-haven demand,US10y influences borrowing cost across mortgages, corporate bonds and loans
Coupon rate is the fixed annual interest paid on a bond's face value. For a Treasury note or bond, it's set at issuance and paid semi-annually until maturity.
Key Details
It's calculated as (annual coupon payments / par value) × 100; e.g., a 5% coupon on $1,000 par pays $50 yearly ($25 twice).
Unlike yield, which fluctuates with market price, the coupon remains constant—higher coupons trade at premiums when yields fall.
Bond prices and yields have an inverse relationship. When yields rise, prices fall, and vice versa, due to the fixed coupon payments relative to market rates.
Why Inverse?
Fixed coupons mean higher market yields make existing bonds less attractive, forcing sellers to discount prices for competitive returns.
Lower yields increase demand for higher-coupon bonds, driving prices above par (premium).
US10Y affect DAX40,the DAX40 is the German benchmark index of 40 major stocks, through global yield spillovers and capital flows.
When the US10Y is higher and bullish ,it strengthens the dollar index and pressure Eurozone borrowing, this makes U.S assets more attractive and weighing on European equities like the DAX40.
The US10Y bearish drop can be seen as supporting DAX by easing ECB policy constraints and boosting risk appetite.
So coming week trading US10Y along side DAX40.
the market structure of the US10Y is giving us a sell vibes and it could drop below 4.0% this month .
though we have an ascending trendline on daily that should serve as support to enable us get a retest and sell below 4.0% on possible breakout of trend.
#US10 #US10 #BONDS

Interesting Bitcoin Cycle Volume Data since 2011 - Change ahead?
The Main Chart is using Fixed Range Volume Profiles.
These are based on the Low from the previous High, till the Next ATH, showing us the Volume profile for Each "Cycle"
OR, Where were people most interested in Buying Bitcoin in a cycle.
As we Look at each cycle Closer. you will also be seeing the Fixed VWAP.
Volume-Weighted Average Price (VWAP) is a technical analysis indicator that calculates the average price a security has traded at throughout the day, weighted by trading volume. It provides a more accurate representation of true market activity than simple averages because it gives greater importance to prices at which larger volumes were traded.
I will start these Zooomed in charts from the 2015 cycle but it is interesting to see how the Volume was from the 2011 low. The was A Bitcoin for $2 !
You will see 2 Horizontal lines , Yellow and Red, This is the VALUE AREA Range....High ( Yellow ) and LOW ( Red )
This Vakue Area shows you were 70% of the trading took place in the Given Range selected ( Low to ATH ).
Value area in 2011 -> 2013 = 2 - 47 usd
Note how Tall this Range is in the chart and how it is mostly traded Low and then traders waited till the ATH was reached.
These people were probably the creators of Bitcoin, Friends and interested parties that were offered a cheap gamble on something that May be "Big value" one day.
I bought my first Bitcoins at $33 and Lost the address,,,,,,,,,,,,,,,,NO COMMENT ( I had seen a TV program talking about it and so spent £1000 at Mt Gox, thinking I could be Rich one day)
2015 to 2017 Profile
See the 2 Horizontal yellow lines....~This is the Value Area. ( I forgot to change lower line to Red)
See how much smaller this is compared to previous.
This shows that people KNEW where the Bottom was, When to Buy and then Wait.
The Value area this time was 2015 -> 2017 = 225 - 255
a $30 range !!!!
We can see a vastly reduced Volume of trading as Price rose.....Again, Showing people understanding what to do and WAITING>
Another thing to see here is those VWAP lines,,,the Yellow and Red
The Yellow is the VWAP and the others are Multiples of that....
I'll not go into details here but Note how that VWAP (yellow ) line progresses and PA hit it at the Bottom and marked the beginning of the Next Cycle.
2019 to 2021 Profile
Again, see the 2 Horizontal yellow lines, the Value Area.
2019 -> 2021 = 3419 - 6344 usd , this time, a $3000 usd range
See how Most of the trading was done AT THE BOTTOM, where that VWAP met the PA line.
See how the VMAP line Rose, with PA above it. It is generally considered bullish when PA is above VMAP.
We did see PA drop below the VWAP line in Late 2022 and this was certainly triggered by the FTX Scam coming to light.
This scared traders and we now see more and more Professional traders entering the Bitcoin world. But as we can see on the next Profile, the FTX problems Scared traders.
2023 - 2025 profile
See how much higher the Value Area is this time ? People did trade the Bottom, the Risk was high after the previous year of Companies collapsing etc.
The Value are this time was 24812 - 31093 usd. The Low was around 15K !
People were nervous, waited and entered slowly.
BUT what makes this So Very different is looking at the amount of trading Higher up. Confidence returned when the USA decided to NOT demonise Bitcoin
This is the ETF Arrival.........The Corporate arrival and maybe the Change of cycle dynamics.
And Look were that VWAP line is NOW......PA has bounced off it already............Was that the Bottom ?
But is this the End of one Cycle and the start of another ?
I am not sure yet.
For a start, PA usualy reaches ATH by reaching above the upper band of the VWAP ( 2nd Red line)
We have not done that yet.
What is also interesting to see is how the ATH's are All Just above the Next Fib Extension , except for the current ATH, Showing that, Maybe, this cycle is NOT over yet.
Global Fib extension ATH number
NOTE how ATH is just above this Fib level
2013 November - 1
2017 December- 1.414
2021 November - 1.618
2025 Current Fib keve just below 1,768 - Are we going to see a push over that line before Real Cycle Close?
Or have we entered a Super cycle ?
So, we do seem to have a change in the making............
Early reach down to VWAP line, so far, not even a -50% drop from ATH compared to the usual -80%
Not reaching above the next Fib extension
High trading Volume late in cycle
PA Not reaching above the 2nd line high on VWAP
And so much more.
Interesting days.............................
For me, We have reached A Bottom, Not THE Bottom and I am not to sure we will ever see a real Bottom agaain...We WILL see LOWS.....
But I think Cycle dynamics have changed and this is discussed in charts I have posted about the Fibonacci Arc that has rejected every ATH
Time Will tell

EURAUD potential bullish shiftI think if the pair break this bearish trend line we may see a bullish trend again

ADA ready to shine again 20% gain toward 0.35$ HI
after huge correction to the downside now some green candlesticks for continuing the process or reverse is logical i can see at least 20% gain toward 0.35$ for ADA

Stellar bullish signals and market conditions —$0.52 Next targetAs part of a long-term correction and bearish cycle, Stellar hit a major low recently, less than two weeks ago. This low managed to produce some of the worst market conditions seen in years... But there is some good news.
While Stellar, XLMUSDT, hit bottom this same month, 6-February 2026; its daily MACD hit bottom 10-February 2025, a year ago. This is giving us a very strong, long-term, bullish divergence. A clear signal showing that lower is no longer possible, a reversal comes next.
Here is the chart for the daily MACD:
Bullish signals tend to pile up on top of each other, making them hard to miss.
As XLMUSDT produces long-term lower lows, the MACD has been doing higher lows.
Recently, two days ago, on the 13th of February, we have a bullish cross. This means the MACD is about to shoot straight up, and this in turn supports rising prices.
Another signal that tends to lead to a price reversal is the falling wedge pattern, shown here in red. And the double-top is what gives us the main target for this bullish wave. A strong resistance level, it rejected growth in January and July 2025, it needs to be challenged again to see if it holds. This is to say that XLMUSDT is about to grow to $0.52 minimum. That's a strong advance and opens up 190% profits potential on the way up.
It can go higher of course, but this is the target that cannot be missed. Next, the market goes up.
Thanks a lot for your continued support.
Namaste.

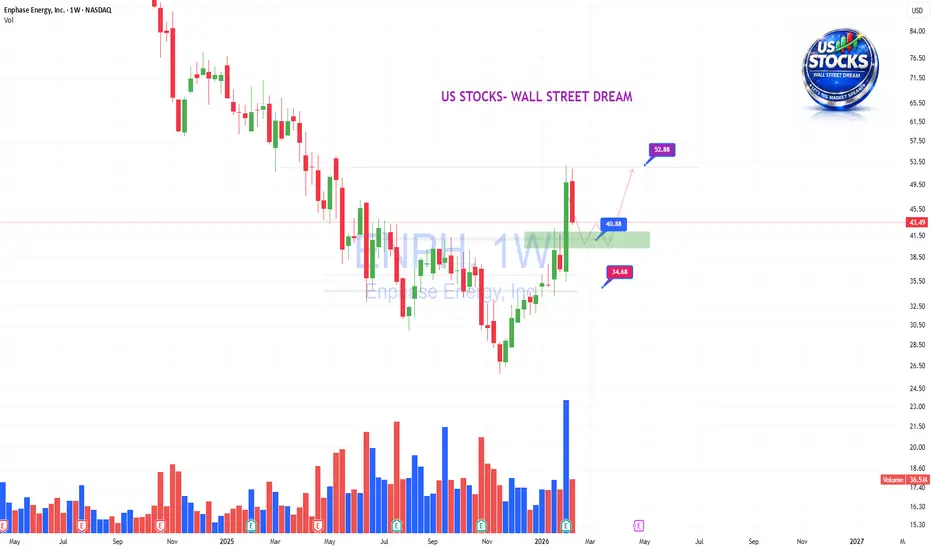
ENPH- Backtesting!NASDAQ:ENPH
.
Nice consolidation breaking out with CHOCH confirmed.
Now backtest.
.
US STOCKS- WALL STREET DREAM- LET'S THE MARKET SPEAK!
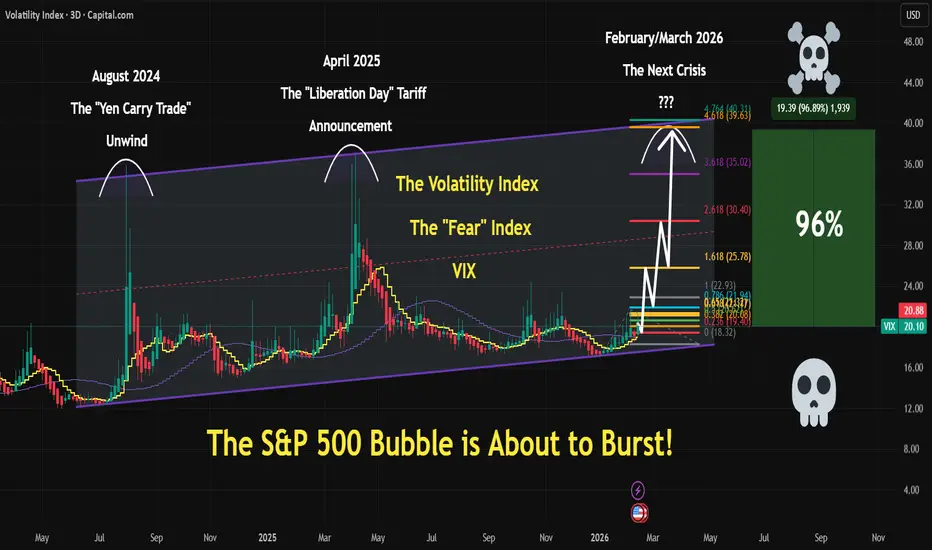
VIX | S&P500 Is About To TANK | LONG VIX | SHORT SPYSince we are currently in mid-February 2026, the specific "crisis" label is still being debated by historians and market analysts, but several distinct names have already emerged in the headlines. Depending on whether you're following the diplomatic friction, the domestic policy shifts, or the literal weather, it is being referred to in a few different ways:
1. The "Greenland Gaffe" (or the "Arctic Stand-off")
This is currently the most popular name in global news. It refers to the massive spike in market volatility following the U.S. administration's statements regarding the purchase of Greenland. This sparked an immediate diplomatic rift with NATO allies, leading to a series of retaliatory tariffs that caused the S&P 500’s sharpest one-day drop since October 2025.
2. The "Warsh Wobble"
In financial circles, especially among traders like yourself, this period is often called the "Warsh Wobble." The announcement on January 30 of Kevin Warsh as the nominee to succeed Jerome Powell as Fed Chair in May 2026 sent shockwaves through the gold and silver markets. The transition uncertainty, combined with his historical reputation as a "hawk," caused a massive reversal in precious metals—with Gold plunging 10% in a single day (January 30).
+1
3. The "Frozen Shutdown"
This name is being used to describe the convergence of two domestic issues:
The Partial Government Shutdown: Washington entered February with a funding lapse that has stalled several federal agencies.
The Energy Spike: Record-breaking severe winter weather across the Southern and Eastern U.S. has caused natural gas and electricity prices to skyrocket. The "crisis" here is the strain on households already dealing with a shutdown and persistent inflation.
4. The "AI Reality Check"
Some tech analysts are calling the current volatility the "AI Reality Check" or the "SaaS Earthquake." The rollout of new AI productivity tools has started disrupting "legacy" Software-as-a-Service firms en masse. This has created a massive rotation out of former tech darlings and into small-cap stocks (the Russell 2000), which outperformed the S&P 500 for 14 straight days in early February.
Possible bullish reversalThe US Dollar Index is currently trading near a key support zone around 96.15–96.20, where price previously showed strong buying reaction. This area could act as a base for a potential bullish reversal.
Although the broader structure recently turned bearish after a strong downside impulse, the current price action suggests a possible short-term recovery if support holds.
As long as price remains above the 96.15 support zone, buyers may attempt to push the index higher.
The first resistance (Target 1) is located near 98.20.
A potential long opportunity exists at current levels, but confirmation through higher lows and a breakout above resistance is required. Risk management is essential, as the broader structure remains vulnerable.
Let me know your opinion in comments bellow

QQQ: Bullish Continuation & Long Signal
QQQ
- Classic bullish formation
- Our team expects pullback
SUGGESTED TRADE:
Swing Trade
Long QQQ
Entry - 601.88
Sl - 598.82
Tp - 607.67
Our Risk - 1%
Start protection of your profits from lower levels
Disclosure: I am part of Trade Nation's Influencer program and receive a monthly fee for using their TradingView charts in my analysis.
❤️ Please, support our work with like & comment! ❤️

DXY | FRGNT WEEKLY FORECAST | Q1 | W7 | Y26📅 Q1 | W7 | Y26
📊 DXY | FRGNT WEEKLY FORECAST |
🔍 Analysis Approach
I’m applying a developed version of Smart Money Concepts, with a structured focus on:
• Identifying Key Points of Interest (POIs) on Higher Time Frames (HTFs) 🕰️
• Using those POIs to define a clear and controlled trading range 📐
• Refining those zones on Lower Time Frames (LTFs) 🔎
• Waiting for a Break of Structure (BoS) as confirmation ✅
This process keeps me precise, disciplined, and aligned with market narrative, rather than reacting emotionally or chasing price.
💡 My Motto
“Capital management, discipline, and consistency in your trading edge.”
A positive risk-to-reward ratio, combined with a high-probability execution model, is the backbone of any sustainable trading plan 📈🔐
⚠️ On Losses
Losses are part of the mathematical reality of trading 🎲
They don’t define you — they are necessary, expected, and managed.
We acknowledge them, learn, and move forward 📊➡️
🙏 I appreciate you taking the time to review my Daily Forecast.
Further context and supporting material can be found in the Links section.
Stay sharp 🧠
Stay consistent 🎯
Protect your capital 🔐
— FRGNT 🚀📈
TVC:DXY

Gold trend analysis!- Ascending Triangle as an corrective pattern in Long Time Frame
- Fibonacci Level - 50.00%
- Completed " 12345 " Impulsive Waves and " ABC " Corrective Waves
- Double Top in Short Time Frame
- Sell Side Liquidity

BTC dominance still strong Hi,
a lot of chart here about that we are going to fall down. My TA shows different stuff. I think we will go higher from here. There is key level to watch which is 50 MA we are below right now. We can have a breakout or wick to 70% - still possible. If it does happen alts will fall again 50%. Watch out this is really strong information based on loger time-frame. If 50 MA (blue line) will not be forced we can assume that ALT season will happen in upcomming months. We are in upward chanell still !!!.
If there will be a break, there will be no ALT season soon. Be careful.
Regards,
J.

xauusdSlow week for most. We have to come a decisive area where 2 scenarios exist at least. Given the latest drop i dont feel the pa is showing a continuation but more corrective. So 5300 is still on. Likely in 5 waves most likely developing wave 1. Ths will be confiirmed above 5119

RDW 1W Structural Compression After ExpansionOn the weekly chart Redwire has completed a full market cycle from base formation to impulsive expansion and into deep correction. The long-term bottom formed in the 2–3 range, where accumulation developed before the breakout phase. That base led to an expansion move toward 26.66, marked by volatility expansion and range acceleration.
After printing the high, structure shifted. A descending wedge developed during the corrective phase, characterized by lower highs compressing under a declining resistance line. The attempt to break above 14.52 failed to produce weekly acceptance. Liquidity was taken, but no structural confirmation followed, and price continued lower within the wedge formation.
The current move brings price back into the 6.97–7.78 demand zone. This range aligns with the 0.702–0.786 Fibonacci retracement of the entire 2 → 26.66 impulse, coincides with a high-volume node on the profile, and sits near the weekly MA200. Downside momentum has slowed, the angle of decline has flattened, and ADX does not signal trend acceleration. This reflects compression into support rather than aggressive distribution.
Structurally, this is a decision zone. Holding 6.97–7.78 opens the path toward 14.00 as the first liquidity reaction level. Acceptance there would shift focus to 21–22, where prior supply was concentrated. A sustained break below 6.97 would invalidate the accumulation thesis and transition the model into deeper redistribution.
Fundamentally, Redwire remains in an investment phase within the space infrastructure sector. Q3 2025 revenue was 103.43M USD, with Q4 2025 estimated at 98.78M USD. Q3 EPS printed -0.29 USD, with Q4 estimated at -0.18 USD. Operating cash flow TTM stands at -145.99M USD and free cash flow TTM at -159.62M USD. Financing cash flow TTM of 330.34M USD reflects reliance on capital markets to fund expansion.
Fundamental summary: revenue growth continues, losses are narrowing, but free cash flow remains negative. The business is scaling, not yet profitable.
RDW is no longer in expansion mode. It is testing structural support after a completed impulse cycle. In aerospace, trajectory matters more than velocity.

Aave long-term —Theorizing. Can a new all-time high hit in 2026?Apart from the fact that Crypto is turning bullish, we are about to close a green week, the first one after very strong bearish action.
Look at Aave... Look at the last three weeks. All red.
Look at the correction, it started mid-August and it was brutal, straight down I should say.
There were two stops along the way, three weeks green, in November and December, but the action was very weak. Always a continuation of the bearish move... It is all different now.
Look at AAVEUSDT and this week recovered all loses from last week and the action is at the top of the session. The biggest green candle since the last bullish move March-August 2025.
As this week ends, the market turns; bullish confirmation. Then we can experience a wave of growth. The same bearish wave but in reverse. Week after week after week the market closing green. If there is a pause, it would be short-lived ending in a continuation until the bulls run out of force.
The first target is $200 and this is an easy one. Can be hit next almost right away.
The second target is a bit stronger, $277, this would complete a lower high based on the current chart structure. After this target, magic happens.
The bearish period lasted more than a year, since December 2024; lower highs and lower lows.
A bullish period can unravel pretty fast but it can also extend and develop long-term. Even three months, a worst case scenario, can result in really high/good numbers.
After the December 2024 peak price, a target very likely to be challenged, $400, we enter hyper-bullish territory. Prices not seen since late 2021.
If the $400 barrier breaks, we are looking at $600 and potentially a new all-time high. The much awaited and highly anticipated altcoins market bull-run phase.
This is where the market is headed. This is what the chart says.
We have a strong chart setup. A clearly bullish bias long-term.
Higher lows lead to higher highs.
›› AAVEUSDT produced a long-term higher low October 2025, this can result in the 2026 bullish period ending in a strong higher high—a new all-time high.
Namaste.

Price Action Blocks and Trading Levels to IndicatorsIn this video, I’m not teaching a strategy as much as I’m walking beside you inside the process.
You’re watching me map a trade in real time — not just the mechanics of entry and exit — but the thought pattern behind it. The patience. The restraint. The conversation happening internally before capital is ever deployed.
Because trading, at its highest level, is not technical. It is personal.
As price moves, I’m outlining the path to the next level — where the market is most likely to travel if momentum holds. Not predicting. Not forcing. Simply reading what is already unfolding.
You’ll see the levels laid out clearly — structure points where decisions live. Areas where opportunity either expands… or disappears.
I talk through my Go / No-Go zones — the places where a trade is either validated or immediately disqualified. There is power in knowing where not to participate. Preservation of capital is preservation of peace.
You’ll also hear me reference what I call Right or Right Out trades — positions where my stop sits directly at my entry. No wiggle room. No hope trades. Price moves in alignment quickly… or I step aside without damage.
This is not aggression.
This is alignment.
The Lens I’m Viewing Through
My charts are structured, but they are not cluttered.
I use tools to create context, not dependency:
• Bollinger Bands to observe volatility breathing
• Ichimoku Cloud — with a heavy respect for the Lagging Span — to confirm whether price has clean air or friction behind it
• The 50, 100, and 200 SMA to understand macro trend structure
• The 5 SMA to feel immediate momentum
• The 9 / 21 EMA cross to time rhythm shifts
I do not use volume.
I do not use time grids.
I am watching behavior. Not noise.
Timeframes
I’m observing price across three lenses:
Hourly for directional posture.
15-minute for formation.
5-minute for precision.
Each timeframe is a conversation.
When they agree, clarity expands.
The Deeper Message
But this video is not about indicators.
It is about trust.
Trusting your preparation.
Trusting your ability to read structure.
Trusting the integration of your mind, heart, and gut when you engage risk.
Prosperity is not created from forcing trades.
It is created from alignment with opportunity.
Abundance comes from discipline… not frequency.
My intention in sharing this inside the community is simple:
To empower you to find your setup.
To refine your lens.
To build a relationship with the market that is grounded, calm, and self-directed.
Because when you learn to read opportunity clearly…
You stop chasing money.
And you start participating in prosperity.

The Nasdaq and the S&PThis is Sunday the 14th. I believe there's a setup for potential trades in both markets. I will be looking at the markets when they open on Sunday. even though they are the types of behavior that they have and which can create a very good return.... It's important to have context with these markets.... Instead of generating a lot of sentences here.... It's probably a little better to go to the charts and listen to them from beginning to end.

Silver outlook Silver for the coming week will be full of surprises. My expectation is this but the chances are low as it's not in a stage for prediction. We haven't got clear indication that it will go up in my opinion I wouldn't recommend anyone buy it with all capital as in future 55$ is expected. Next week move is expected to be clear and the data is bearish that's why its gonna get complicated.

ETH ready for small gain 14% gain toward 2400$Hi,
Yes sir, everything is possible in this market. Rises and corrections are two sides of the same coin. This correction really shocked me, but I still considered it a correction. It just happened sooner than I expected.
Do you know when I understood this? Let me answer that question in the comments if anyone reads this explanation and asks about it.
Right now, after this huge correction, I can see more upside for the price. A small gain is expected and it could act as a gift for holders. Of course, more correction is also possible. But overall, I am somewhat optimistic.
As I said, my first target is a 14% move toward $2,400.

Bitcoin —The bottom is in or lower in the latter part of 2026?I had a dream, and people were arguing about Bitcoin. The topic was about the current chart situation, it was a lively discussion. Everybody was wondering if the bottom is truly in.
Many people were saying no, the bottom is yet to come. Others were saying lower for sure. One of them said, "Forget the bottom, we are going up."
But this was all dreaming of course, what about the chart? What is the chart saying right now? What can we expect?
If the bottom isn't already in, does this mean we have to experience still lower prices?
If the bottom is in, do we get long-term growth?
The reason why some people say that the bottom being in is not possible is due to past action.
A bottom normally isn't a one day process, nor a one week process, it is an event. It can take months for the bottom to settle, and thus these people expect lower prices.
Of course, to have this view there are many things that must be ignored.
Yes, the bottom is a process but this process differs between cycles. In some cases, a bottom can take months to form. In other instances, a bottom can happen in a flash and the market never looks back.
We are likely looking at the second version. Here are some examples:
›› August 2024. The market hits bottom and never looks back.
›› March 2020. The market hits bottom and never looks back.
›› February 2018. The market hits bottom and grows almost 100% right after.
Anything is possible say, in October or November 2026. Let's remain open. Maybe a lower low, a double-bottom or a higher low.
The problem with making predictions that far right now concerns this present moment, today. If we are focusing on the bottom being in or not, what happens to the current bullish wave?
The bottom is in for the time being. The bottom came in early February 2026. Now, the market will produce a very strong wave of growth. Not only Bitcoin, but also all of the altcoins. This wave of growth is what reveals and supports the end of the correction. This is what reveals the true bottom. If the bottom was yet to come, the market wouldn't grow.
Another signal comes from Ethereum and many of the top projects. Ethereum ended its early 2026 correction with a higher low when comparing to April 2025. The bottom is in.
Other projects I showed you recently from the top 20 are all "saying" the same. The market is set to grow now, growth is already happening. It is the first time Bitcoin fails to produce a new low after 7 days. This means the correction is over. With the correction being over, we get higher prices next.
As soon as we get a higher high on the next rise, this lend support to what I just shared.
A higher high in Q1-Q2 2026 would invalidate any possibility of move below $60,000. Bitcoin just need a strong move above $100,000 and that's it, no more doubt—the bulls win.
Thank you for reading.
Namaste.

DOGE next target is 0.1120$ means 15% gains HI
after huge correction to the downside now some green candlesticks for continuing the process or reverse is logical i can see at least 15% gain toward 0.1120$ for doge

SILVER My Opinion! BUY!
My dear friends,
SILVER looks like it will make a good move, and here are the details:
The market is trading on 77.528 pivot level.
Bias - Bullish
Technical Indicators: Supper Trend generates a clear long signal while Pivot Point HL is currently determining the overall Bullish trend of the market.
Goal - 81.491
About Used Indicators:
Pivot points are a great way to identify areas of support and resistance, but they work best when combined with other kinds of technical analysis
Disclosure: I am part of Trade Nation's Influencer program and receive a monthly fee for using their TradingView charts in my analysis.
———————————
WISH YOU ALL LUCK
