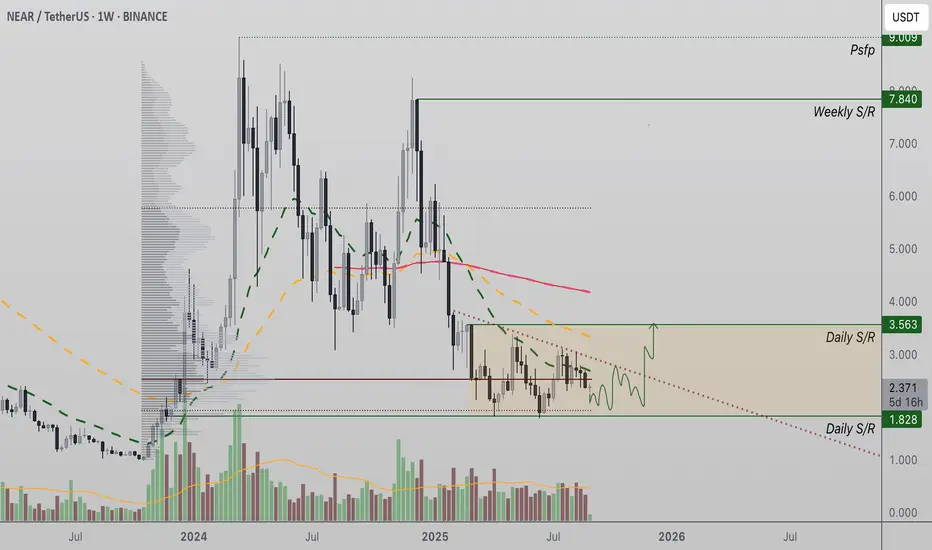
NEAR Protocol Price Coils in Equilibrium, Breakout Toward $7.80 NEAR Protocol is consolidating within an apex structure of higher lows and lower highs. A decisive break of $3.50 resistance with volume could fuel a bullish rotation toward $7.80.
NEAR Protocol is approaching a critical moment on the charts as price action tightens into a converging equilibrium. With both lower highs and higher lows forming, the market has created an apex zone where a breakout will eventually materialize. Support is currently holding at $1.80, while resistance at $3.50 stands as the major barrier before any significant continuation higher.
NEAR Protocol (NEAR) Key Technical Points
- Support at $1.80: The key level that maintains the integrity of bullish structure.
- Resistance at $3.50: A breach here could trigger a breakout from equilibrium.
- Upside Target at $7.80: The next rotational objective if resistance is cleared.
NEAR Protocol has spent the past sessions in a prolonged consolidation phase, forming a classic equilibrium of lower highs and higher lows. This compression of price action highlights the market’s indecision, but also builds the conditions for volatility expansion once either support or resistance is broken.
The $1.80 level remains the most important support in this structure. Each retest of this zone has attracted buying demand, preventing a breakdown and maintaining bullish potential within the broader market structure. On the other hand, the $3.50 resistance level has acted as a dynamic ceiling, rejecting price multiple times. A confirmed breakout here would signal the end of equilibrium and the start of a bullish rotation.
The volume profile provides further insight. Current trading shows average levels of participation, insufficient for a sustained breakout in either direction. For NEAR to rotate toward $7.80, an influx of bullish volume is required, ideally with strong continuation after the breakout. Without this confirmation, false moves and quick rejections remain a risk.
Market structure suggests that once the $3.50 resistance is broken on convincing volume, the probability of a continuation move toward the $7.80 level increases significantly. This target aligns with historical resistance levels and fits within the broader rotational framework of NEAR’s chart.
What to Expect in the Coming Price Action
As long as NEAR Protocol holds above $1.80 support, the equilibrium structure remains intact and biased toward a bullish resolution. Traders should watch closely for a breakout above $3.50, backed by significant volume influx, as this would likely confirm momentum toward $7.80. Until then, price may continue to compress within the apex zone before making a decisive move.
Contains IO script
ENA LongI don’t share many day trades on TradingView, but ENA looks promising. I expect one more leg down before a move up let’s see how it plays out. X marks the invalidation.

AVALANCHE - GOOD ENTRY FOR LONG SWING TRADE, 100%+AVALANCHE (AVAX) - Layer 1 blockchain, that functions as a platform for decentralized applications and custom blockchain networks. It is one of Ethereum’s rivals, aiming to unseat Ethereum as the most popular blockchain for smart contracts. It aims to do so by having a higher transaction output of up to 6,500 transactions per second while not compromising scalability.
Looking for an entry around $25 and exit around $50 on spot for a nice 2x. Its possible for price to move a bit lower in the short term depending on overall crypto market, however this is a good swing trade and any lower entry would be a better entry. You can wait for bullish volume and a catalyst if you feel its risky, or overall crypto/altcoin sentiment to increase.

Starbucks to 118SBUX has consolidated nicely at the anchored VWAP and has put in a strong low on the weekly timeframe. The easy money is for a push to ~118. Extension targets could take this as high as 145. A breach of the strong low would invalidate the hypothesis. This trade could take a few months to play out.

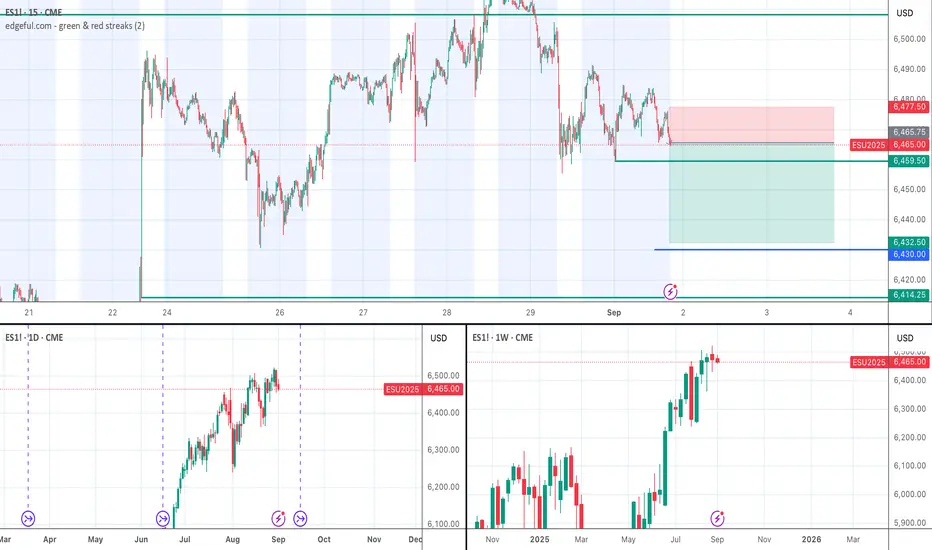
Short ES to Last Week's LowES is looking heavy with a steady decreasing Cumulative Volume Delta this evening. There is a 500 order block sitting at last week's lows just below 6430, so I'm thinking we head down to that level and test the support there.
Bitcoin Vs. GoldCan you see it?..A massive H&S potentially forming on the pair. Is war on the horizon? Why does gold keep climbing? Big money knows something. Usually you see profits roll down the risk curve but we see it pouring into.the safe have of Gold.

Shampoo Trading102-105k bounce into macro lower high (116-120k) before 88-93k before right shoulder into 106-108k previous range high into 60-70ks (last cycle all time high) into fake breakdown/chop before moon to 7 figures.
HTF Head & Shoulders price action.
GLHF.

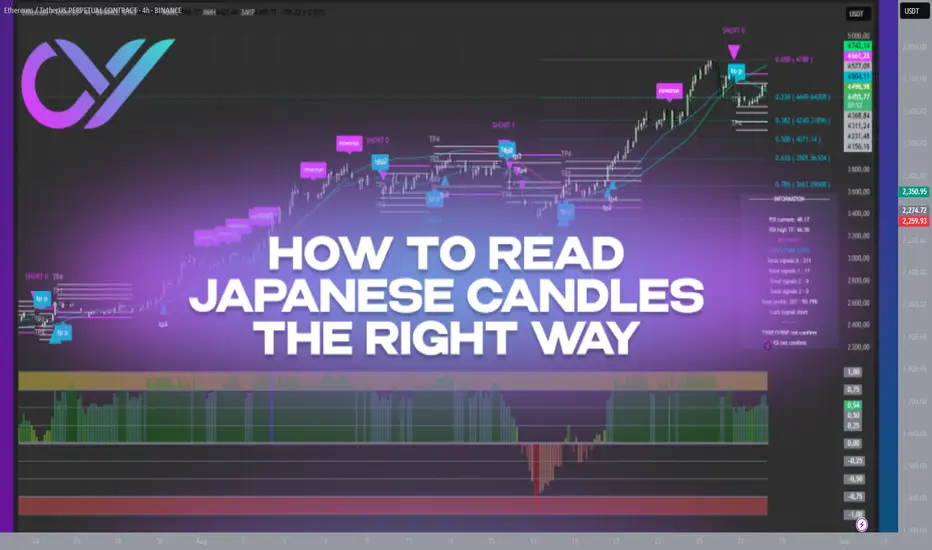
How to Read Japanese Candles ProperlyWhen traders first look at a chart, they often see what looks like a chaotic mix of red and green bars with shadows. These are Japanese candlesticks — the main language of financial markets. But for many, they remain a mystery: what does a long wick mean? Why does one candle look strong while another looks weak? How can you find structure in this chaos?
In reality, candles are not just colored shapes. Each one represents a small battle between buyers and sellers. The body shows where price opened and closed, while the wicks mark the extremes of that session. A green candle reflects bullish control, a red one shows bearish dominance.
The details matter most. A long upper wick signals that buyers tried to push higher but sellers pushed back. A long lower wick means the opposite — heavy selling pressure was absorbed, and buyers regained control. A doji with small body and long wicks highlights indecision and often warns of a possible shift.
Single candles rarely tell the whole story; combinations and context are far more valuable. A “hammer” at support after a downtrend hints at reversal. A “bullish engulfing” pattern after a series of red candles shows momentum shifting to buyers. On the flip side, a “hanging man” near resistance often warns of correction.
Timeframe also changes the narrative. A candle on the 1-minute chart tells a completely different story than a candle on the daily chart. Aligning short-term candles with higher timeframes helps distinguish noise from meaningful moves.
Experienced traders never rely on candles alone — they integrate them into a system. Candles are confirmed with support and resistance, volume dynamics, divergences, and overall trend structure. Only then does a clear picture of the market emerge.
The key, however, is eliminating emotions. Traders who focus only on candles often act chaotically — exiting too early, holding losing trades too long, or entering impulsively. But when combined with algorithmic analysis and structured trade management, candles become a clear language: they show where the market weakens, where momentum builds, and where it makes sense to take profits.
Japanese candlesticks mirror crowd psychology. Yet only a systematic approach allows traders to truly read their signals. When the market looks chaotic, structure and automation bring control back to the trader, turning emotions into cold calculation.
Gann Square of 144 Price should reverse after the .50 angelGann Square of 144 Price should reverse after the .50 angel

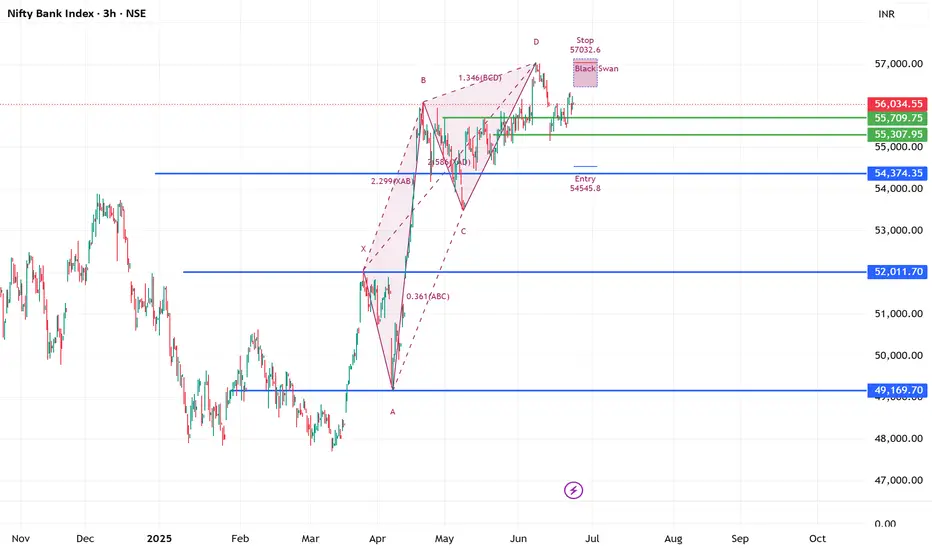
Berish Black Swan (Harmonic pattern) Running in #BANKNIFTY 3hrs56069 spot 23-06-2025
patterns clearly suggest after hitting ATH 57049
at this angel 1.346 BCD move completed by price
now due to amid war situation traders must take extra cautious approach
this is pure educational based study !!!!!
What is going on with BTC? Psychology of loss :(🚨 Bitcoin Price Update
We’re at a super interesting spot in the market right now ⚖️. BTC is giving us both bullish & bearish signals 📈📉. Bulls are pointing to institutional accumulation and macro tailwinds, while bears see warning signs in recent volatility and sharp pullbacks. In short → we’re preparing for all possibilities. Stay flexible, not biased! 🧠💡
🧩 The Psychology of Loss in Trading
Every trader faces losses—it’s part of the game 🎲. But how you perceive those losses will decide how far you go in your trading journey 🚀. Many traders go through 5 stages when losing money:
1️⃣ Denial – “This trade will bounce back, I’ll just wait…”
2️⃣ Anger – “Why me?! The market is rigged 😡”
3️⃣ Bargaining – “If I move my stop loss just a bit…” 🤔
4️⃣ Depression – “Maybe trading isn’t for me 😞”
5️⃣ Acceptance – “Okay, lesson learned. Let’s refine the plan 📑✅”
🎯 Key Takeaway
Losses should never be internalized as an ego hit. They’re not proof you’re a “bad trader”—they’re data points 🧮. Each loss is feedback you can use to:
Improve your risk management 🛡️
Refine your strategy 🔧
Understand market conditions better 🌍
Think of losses as tuition fees you pay to the market—painful, but they buy you growth 📚✨.
🔥 Final Thoughts
Bitcoin is in a decision zone ⚡—so stay sharp, manage risk, and remember: your progress depends not on avoiding losses, but on learning from them. 💎

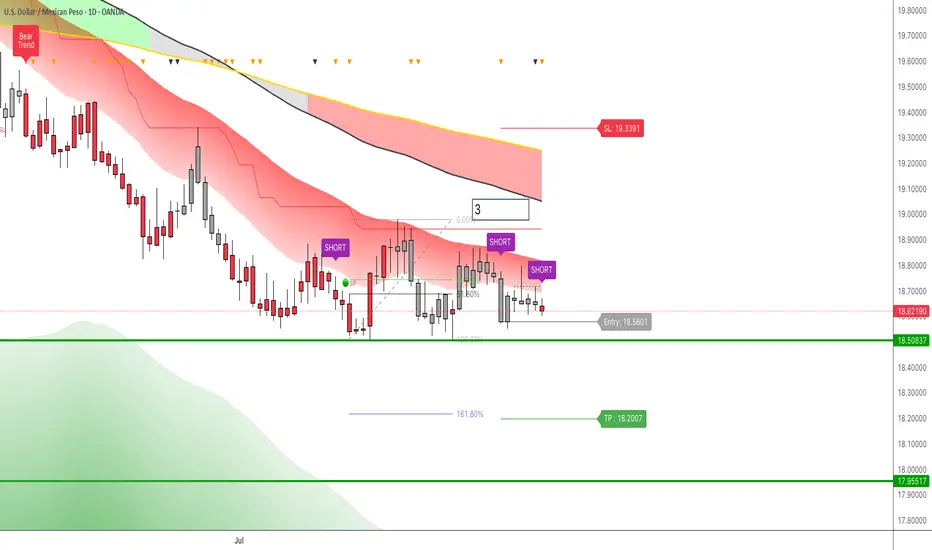
USDMXN: Short TriggerHello fellow traders,
today I share the UsdMxn chart in which we have a new Short trigger signal from LuBot.
The signal appears on the daily timeframe and is a very good trigger for the following reasons:
1. Red candles: the short structure returns bearish in favor of the main trend.
2. Downswing swings with highs that do not exceed the red fast trend cloud.
3. Double pinBar with decreasing maximums
4. Signal on the third negative swing of the weekly timeframe that has just begun after a period of lateralization / breathing space.
5. Reversal Trend signal in favor of the trigger
As the first target area we see the support level given by the weekly lows starting from 2017 to which the price has reacted in recent weeks.
Breaking this level, our main objective for this trade will be the 161.8 level of the fibonacci retracement of the latest swings which coincides with the TP suggested by LuBot.
The stop loss can be placed as a precaution on the level suggested by the indicator, or if you want to increase the return risk you can place it immediately above the last high where we will see a change in the short-term structure.
You could opt for a double trade with different sizes with these 2 methods, placing the smaller size in the riskier trade. But never exceeding the total risk of 3 or maximum 5% of the total capital of the entire trade.
👍 If you want to see other similar posts, like/boost
🙋♂️ Remember to follow me so you don't miss my future analyses
⚠️ Disclaimer: This post is for informational purposes only and does not constitute financial advice. Always do your research before making investment decisions.
FX:USDMXN FOREXCOM:USDMXN SAXO:USDMXN CAPITALCOM:USDMXN OANDA:USDMXN ACTIVTRADES:USDMXN SKILLING:USDMXN EASYMARKETS:USDMXN PEPPERSTONE:USDMXN
NIFTY50....Wave iv complete?Hello Traders,
the NIFTY50 has probably complete a wave iii of lower degree.
It closed the day @ 24625. In contrast of a wave ii, that has lasted for one day also, this wave could be complete.
In this case, the next move should occurr to the downside and complete a wave v! Targets are still valid and have been published yesterday!
If this move instead was all of the correction, it should start a new advance and create possibly new high's above 25153 on August 21th.
While the move for now looks like a "three-down" I await another wave to the downside to accomplishe a "five-down"!
So friends, that's it for a quick note today.
Have a great week.....
Ruebennase
Please ask or comment as appropriate.
Trade on this analysis at your own risk.

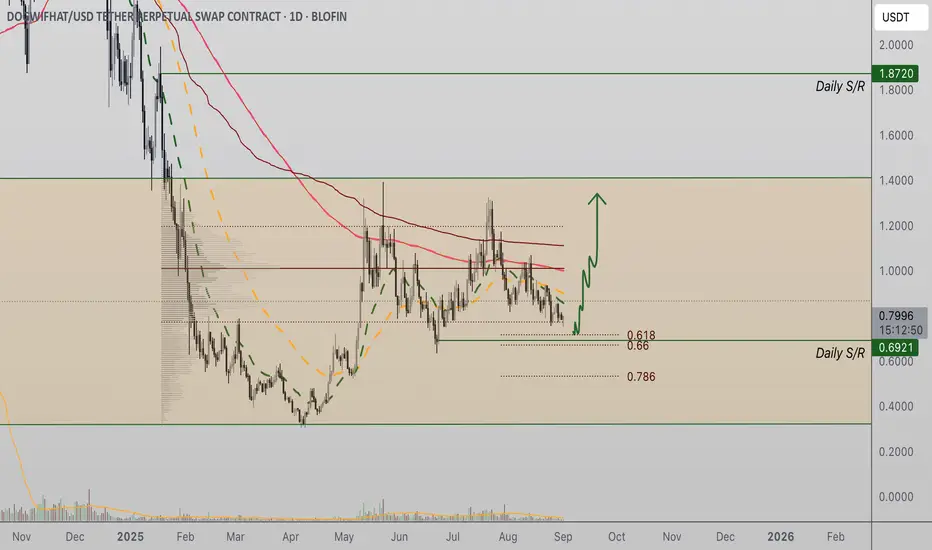
WIF Holds Fibonacci Support as Range ConsolidatesWIF Coin is respecting the 0.618 Fibonacci retracement, which aligns with daily support and the value area low of its current range. Price action remains rotational, but a move toward range resistance is developing.
WIF Coin continues to trade within a longer-term defined range, where both support and resistance have held firm. At present, price is finding support at the 0.618 Fibonacci retracement, a key technical level in confluence with daily support and the value area low. This alignment strengthens the case for a potential rotation higher within the range, although a broader breakout has yet to occur.
Key Technical Points
- 0.618 Fibonacci Confluence: Price is currently holding above the retracement aligned with daily support and value area low.
- Rotational Range Structure: WIF Coin remains locked in a sideways trading range, awaiting breakout confirmation.
- Resistance in Focus: The next major test lies at range resistance, which price is now approaching.
The current price behavior of WIF Coin illustrates the mechanics of range-bound markets. Strong confluence between the 0.618 Fibonacci retracement, the daily support level, and the value area low has created a reliable structural base. As long as this level holds, the likelihood of continuation higher within the range remains strong.
Despite this supportive base, WIF Coin has yet to escape its longer-term trading range. Resistance overhead continues to cap upside momentum, while support has repeatedly caught downside attempts. This equilibrium creates a rotational environment where traders can anticipate cycles from the lower boundary back toward the highs.
Currently, price is leaning toward the resistance zone at the top of the range. A move toward this level would fit the rotational structure, but the key factor will be volume confirmation. Without increasing volume, any rally risks stalling before testing resistance. Conversely, a surge in bullish volume would strengthen the case for a decisive breakout attempt.
The critical catalyst lies in the eventual range resolution. A breakout above the defined resistance would open the door to significant upside expansion, while a breakdown below support would tilt the market firmly bearish. Until such a resolution occurs, price action remains rotational within the defined boundaries.
What to Expect in the Coming Price Action
If WIF Coin continues to respect the 0.618 Fibonacci support, a rotation toward range resistance remains the most probable scenario. However, only a decisive breakout will unlock explosive directional momentum. For now, the market remains balanced, with traders awaiting volume confirmation to determine the next trend-defining move.
KNC Price Readies for Bullish Expansion Kyber Network (KNC) has been consolidating after a corrective pullback, holding key support at $0.28. With price trading in a bullish order block, traders are eyeing a potential rotation toward the $0.84 resistance if volume confirms the next move.
Kyber Network’s KNC token has been consolidating within a corrective phase after recently backtesting the point of control (POC). Price action suggests the correction is nearing completion as KNC trades in a bullish order block that may serve as the foundation for the next upward move. However, volume dynamics remain a critical factor, as momentum confirmation is necessary for a sustained bullish expansion.
Key Technical Points
- Critical Support at $0.28: A pivotal level that must hold to maintain bullish structure.
- Volume Weakness: Current decline in trading volume highlights the need for confirmation on the next move.
- Upside Target at $0.84: Resistance zone in focus if the bullish rotation is triggered.
After a volatile upward move earlier, KNC entered a correction phase, retesting the point of control before stabilizing. This corrective behavior aligns with broader market tendencies, where sharp expansions are often followed by consolidation or pullbacks before resuming trend direction. The presence of a bullish order block within this correction provides a structural base that could propel the next leg higher.
The $0.28 level has emerged as the most significant support. This region has already been tested and respected, suggesting active buyer interest at this price zone. Holding above $0.28 is essential for bullish traders, as a breakdown below this level would weaken the current structure and potentially extend the corrective cycle.
Volume, however, is the main missing piece at the moment. The decline in trading activity during the corrective move reflects reduced participation, which is common in consolidation phases. For KNC to rotate toward the highs, the next push upward must be backed by a noticeable increase in volume. Without this confirmation, any attempted breakout risks fading quickly, trapping early longs.
Should volume return and buyers reclaim momentum, the path toward $0.84 becomes increasingly probable. This resistance represents both a psychological barrier and a historical supply zone, making it a natural target for a bullish expansion. Breaking this level decisively could mark a trend continuation phase, opening up further upside opportunities.
What to Expect in the Coming Price Action
As long as KNC holds the $0.28 support, the technical bias remains bullish. If volume expansion accompanies the next move, traders can expect a rotation toward the $0.84 resistance in the short to medium term. A confirmed breakout from this zone would validate the broader bullish structure and likely attract stronger market participation.

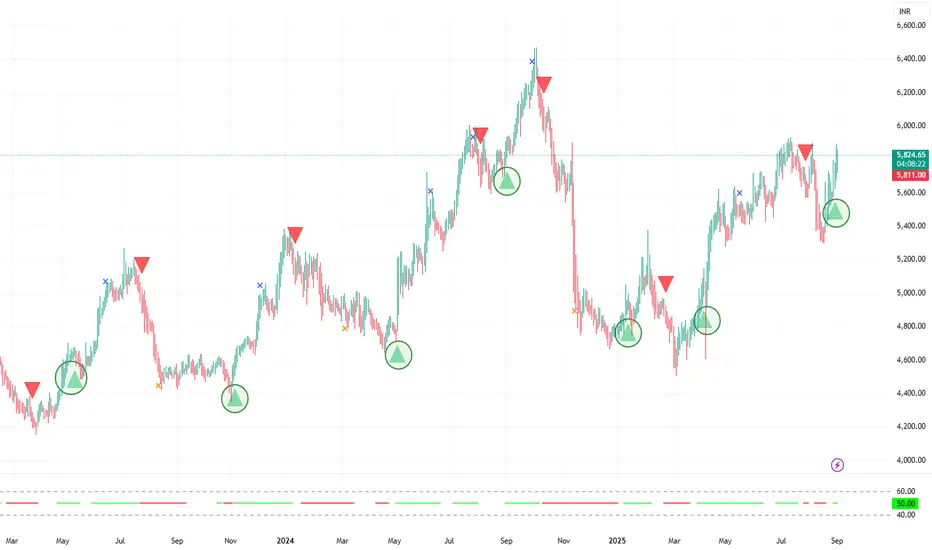
Britannia - Daily - fresh buy triggeredBritannia has triggered a fresh buy signal on the daily
Past instances are highlighted. It is a beneficiary of the recent GST rate cuts and likely Govt moves to spur consumption
QBTS under $13The current setup is neutral-to-bearish, with downside pressure dominating unless price can decisively move above volume resistance and show momentum indicator strength
Zone Type Trigger
15.63 Bullish Reclaim and hold as support after breakout
16.95–18.05 Bullish Retest and bounce above resistance
15.63 Bearish Fail to reclaim as resistance after breakdown
14.20 Bearish Retest and fail below former support

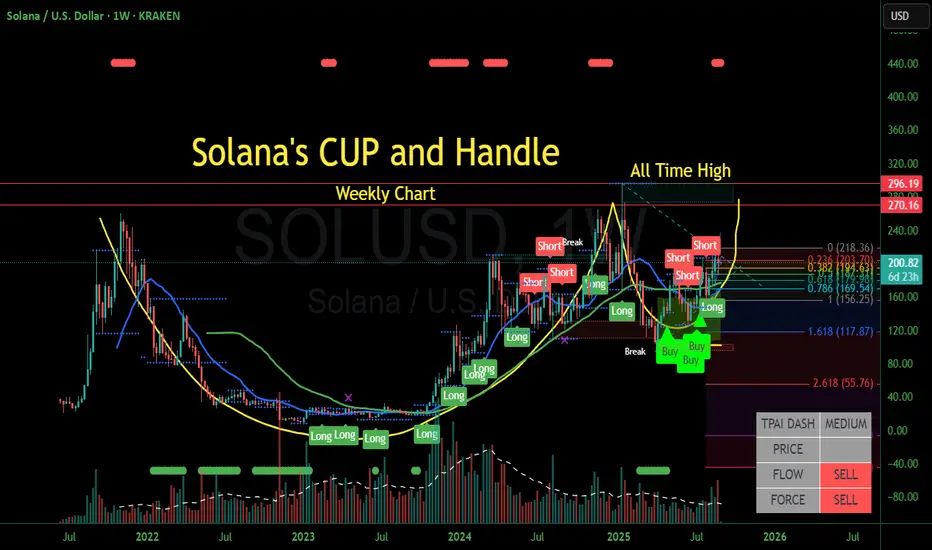
Solana Forming a Weekly Cup and Handle StructureSolana is now forming a cup and handle pattern with an impending breakout on the handle at $296. A measure move would suggest a target of around $526, based on the cup's average bottom of around $18.
#BTC Update – 31.08.2025🚨 #BTC Update – 31.08.2025 🚨
Bitcoin has entered a deep retracement phase after printing a fresh new high. 📉
We just saw a breakdown below our black support line, and now the price is sitting on a major support around \$108K.
👉 Key Outlook:
* If Bitcoin closes today’s candle above the yellow zone, the market sits at a 50/50 decision point – it could either recover upward or extend the retracement.
* A breakdown below \$108K would likely push us into a weekly deep retracement with targets around \$96K.
* On the way down, we’ll watch Arrow #4 & #5 levels closely.
* Arrow #4 is the key wave level 🔑.
* If that gives way, we could even see a retest of \$92K (Arrow #6) before reversal.
🔥 On the bullish side:
If Bitcoin manages to break back above the black resistance lines, this will be a very bullish signal – opening the door for another powerful rally and potentially a new all-time high soon. 🚀
📊 Summary:
* ✅ Above yellow = decision zone (watch closely).
* ❌ Below 108K = retracement targets \$96K → \$92K.
* 💎 Above black lines = bullish breakout → new highs ahead.
Stay sharp, fam! ⚡️ Big moves are coming – patience and discipline will pay off. 🙌

How a Systematic Approach Helps Maintain Control
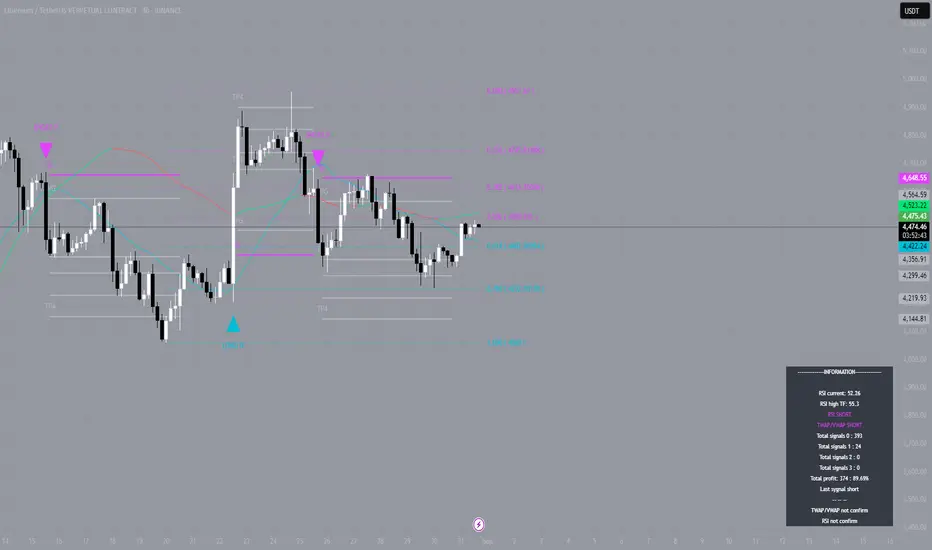
The crypto market has once again reminded us that price movement is never linear. Ethereum first moved down from the $4,614 level, hit TP1 at $4,369, then reversed upwards and took out stops at $4,660. It might seem like chaotic swings where holding a position is impossible. But it's precisely in such moments that the importance of a systematic approach to the market becomes obvious.
Most traders perceive these situations painfully. The price goes down — fear intensifies. Then a sharp reversal — greed emerges, along with a desire to "wait it out." As a result, the strategy breaks down: the trader closes too early or too late, and losses seem inevitable.
In reality, the market is not chaotic. It moves in stages: impulse, correction, consolidation. ETH demonstrated exactly that: a sharp drop, a test of the TP1 zone, a bounce, a stop run, and a return to the downward phase. To most participants, this looked like "randomness," but a careful look through an algorithmic model allows one to see the structure in advance.
The algorithm accompanied the trade step by step:
- It fixed profit zones as the price moved down;
- It reflected the moment of a potential upward reversal and limited risk with a stop-loss;
- It showed the resumption of the downward scenario and has kept the position open until now.
The key here is that decisions were made not on emotions, but based on structure and probabilities. The price can move in any direction, but when you have a management system, the trader controls the process, not the other way around.
No trader can predict the market with 100% accuracy. But you can predict your own behavior: set rules, exit zones, and acceptable risk in advance. Automating this process eliminates unnecessary doubt, helps maintain discipline, and allows you to work not on "intuition," but by algorithm.
ETH clearly demonstrated how the market shakes out weak hands and tests every participant's resilience. Those who acted spontaneously most likely lost. Those who worked systematically preserved their gains and continue to ride the trend.
This is where the true value of tools is revealed: not to guess the market, but to structure it, turning chaos into a sequence of steps. This saves time, eliminates emotional mistakes, and allows you to look at the price coldly, without panic.
#BTC.d Update – 31.08.2025📊 #BTC.d Update – 31.08.2025
After reaching all mentioned targets, dominance has now entered the range zone. 📉
The trend is still bearish and preparing to print another *fresh low very soon*!
👉 Possible levels for this next low are already marked on the chart – Arrow #4, #5, and #3.
⚠️ Key Point: If the weekly candle closes inside the current yellow area, it will be a powerful confirmation of the ongoing downtrend.
🔥 Remember: This scenario is super bullish for ALTs – exactly as I’ve been explaining in my previous analyses. But this bullrun is *different*:
* Not all alts will pump at the same time.
* Only specific coins will take turns to run.
* Recognizing these rotations is the key to maximizing gains. 🚀
📌 On the upside, a breakout above the black lines (Arrow #1 & #2) would signal a bullish reversal for BTC dominance. Until then, the market continues to favor ALTs.
✨ Stay sharp, stay motivated, and keep following us for updates on the next big ALT pumps. This bullrun rewards patience and smart positioning! 💪

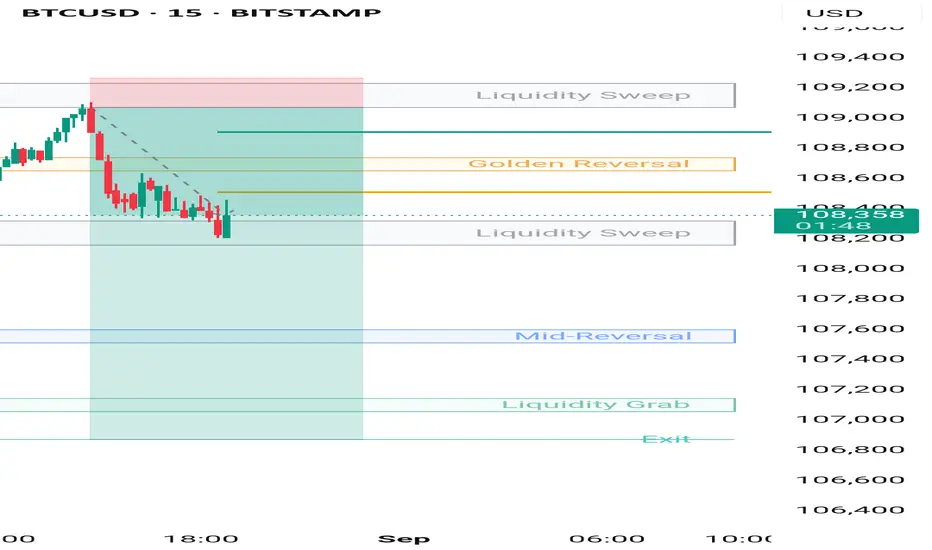
Bit coin target 1 doneBit coin sell extended target once price closes below liquidity sweep . We can see bearish moment continue till liquidity grab . Target 1 zone to zone done .. liquidity sweep to liquidity sweep.
EURUSD SetUp-Market Analysis
Areas of Interest and Macroeconomic Context
The EUR/USD pair highlights two key technical areas of interest that warrant attention for short- and medium-term trading strategies.
With the start of a new month, caution is advised, as initial price movements may involve significant pullbacks toward areas of higher liquidity or relevant support/resistance zones.
The latest Commitment of Traders (COT) report indicates an increase in long positions by large speculators, suggesting a bullish bias in institutional sentiment . This positioning should be evaluated within the context of both technical and fundamental analysis to anticipate potential market movements. Fundamental Factors Influencing Market Sentiment
Recent U.S. economic data has had a notable impact on the EUR/USD pair, reinforcing expectations of a weakening U.S. dollar : Weak Economic Data: The Chicago PMI and the University of Michigan Consumer Confidence Index fell short of expectations, fueling speculation about a potential interest rate cut by the Federal Reserve (Fed).
Pressure on the Dollar: Recent inflation data, combined with dovish remarks from the Fed, has heightened expectations of a more accommodative monetary policy, weakening the dollar against the euro.
EUR/USD Movement: As a result, the pair has approached the upper end of its recent range, driven primarily by dollar weakness.
#EURUSD #Forex #MarketAnalysis #Trading #Dollar #Euro #CurrencyMarket #COT
