GBPUSD General Overview When we look at the British Pound, we see that it is just below the resistance.
Although the negative trend of the US Dollar Index (DXY) out of the channel is a positive factor, I am keen to see that resistance is clearly supportive.
If the resistance is clearly exceeded and the US Dollar Index does not enter the historical channel again,
a strong upward movement can be expected.
If resistance is unbreakable and the US Dollar Index returns to historical channel, a strong downward movement may be expected.
For now, downward pressure may continue for a short time.
Because a high enthusiasm was pumped into the market in line with the election.
These are all I can see for now, with my best wishes.
Correlation

Silver Market Overview (TF = 1D ) When we look at silver prices, we observe that it is very close to resistance.
At the same time, the current channel is very close to the resistance.
When we look at the gold / silver ratio, the ratio, which has been in favor of gold for a long time, is turned into silver.
My personal thinking, both the transgression of resistance and support, as well as a clear downward ration of the ration, can result in a hard upward movement in silver.
On the other hand, if these situations do not happen, we are very close to the resistance, we can open a profitable short position in terms of risk / reward ratio, but in this case, let's make sure that the gold-silver ratio returns in the channel I have drawn.
Best wishes !

DXY: Alt Bat Pattern If 97.678 Is BrokenDXY: Alt Bat Pattern If 97.678 Is Broken
DXY's fall has pushed GBPUSD, EURUSD and AUDUSD higher this week.

UA HAS CROSSED BUY Like i anticipated from my previous chart, that UA would be shifting soon. Which it has. Buy while you can.
Check my other chart on UA to see.
Thanks

Gold Strategic Overview before new weekMy weekly views on gold are indicated on the presentation.
Even though the buy signal is coming, I think this is the only response buys for now.
The bull market continues on the main channel.
And in 2020, even though I expect higher peaks than 2019, I think that gold prices should fall slightly.
I expect gold prices to fall in the medium term.It is very important to have the position size to withstand this.
The USDJPY parity can give you the clue about when the due date will come.
This is because the correlation between the Japanese yen and gold price movements is very high in the weekly timeframe.
When we look at the gold / silver ratio, we see that the pair continues under the leadership of gold.
Here is a possibility Minor - trend line can be challenged.
Although I personally go over the net short position on a weekly basis, I am of the opinion that short positions will be opened on a daily basis.
Although it is a bit risky now, it is a good idea to follow it carefully and achieve the appropriate risk / reward ratio.
I wish success to all traders in the new week , regards.

S&P500 v DXYI'm throwing this up for discussion. The three key areas of the chart seem to show that a fall in the DXY is followed by sound recoveries in the S&P500.
Be careful though, because I'm NOT saying that the weak DXY causes the S&P to rise like a phoenix.
It's a community so I welcome different perspectives on this.


E-MINI RUSSELL 2000 INDEX : LONGThe Russell index is a SME-oriented index that mostly addresses the American domestic market.
This index should generally show parallel movements with the Dow Transportation index.
In this respect, we received a good confirmation.
Determine the position size in small amounts.
For this analysis:
STOPLOSS : 1542.5
GOAL : 1743.5
RISK REWARD RATIO : 1/3

EW: Corrective Bonds Indicate Resistance On StocksHello traders!
Today we will talk about the bond and stock market and their correlations.
As you can see, US and German Bonds are moving more or less together and the same thing is with US and German stocks. Of course, there are no perfect correlations, but overall looking they are in positive correlation.
At the same time bonds and stocks are also more or less in negative correlation and again, there are no perfect correlations, but at the end they always somehow get caught.
Well, what we currently see from Elliott Wave perspective is that both, US and German bond market might be finishing their corrections, which would be limited for the stock market. So, if we are on the right path, then stocks may face a resistance, at least a temporary. US stocks (S&P500) may see a decline from the upper ending diagonal line, while German stocks (DAX) may face a temporary resistance at the upper channel line.
However, this is not the case yet, but if bond market suddenly bounces and stock market declines in strong and impulsive fashion, then we should be aware of the potential risk-off sentiment that can lasts for some time.
Be humble and trade smart!
Disclosure: Please be informed that information we provide is NOT a trading recommendation or investment advice. All of our work is for educational purposes only.


Retracement ComingThis pair here hit most of its bull tps last week.
Bought we are now heading into the overbought area and bullish harmonics are forming on other JPY pairs.
We should see a retracement of the bull rally before continuing further up.
BEAR TPS:
• 82.230
• 82.753
• 82.239
• 81.895
BULL TPS:
• 83.992
• 84.405
• 84.889

ETH and BTC are perfectly direct correlatedAnalysis of Ethereum should always take into account current Bitcoin price action. If we look at the 1 day timeframe scale charts of ETH and BTC we would see that there are similar fractal repeats. Taking a closer look at the short-term timeframe scale reveals a direct and perfect correlation of the assets. We can see 7 similar price action formations which took place exactly at the same time. Deeper analysis shows that ETH replicates BTC movements with up to 5 minutes lag. This is a very long period to take action.
Taking into account the recent BTC analysis we see price action of this asset reached its top and currently should go down making a channel breakout rejection and another fractal repeat. Thus ETH will replicate this movement and it will be favorable to open short position. Target in such scenario will be a bottom of the channel around $168
Although there is still a chance that the breakout will be confirmed, it will happen once a 4 hour candle closes green above $8 118 level. In this case there are 2 long position targets for ETH
1: $178
2: $183
Carefully track the progress of the price action to take a decision. It is a good moment to earn profit with ETH

XAUUSD H4Price has broken out of the triangle formation after a rejection at weekly support level 1480 was made. Price has broken out of the long term descending trendline, showing that price may look to resume the long term uptrend & continue higher. Will be watching the orange zone below which aligns with the 50 fibonacci for a bullish reaction which also will align with a retest of the trendline & momentum can push price back higher.

EW Analysis: Bullish Emerging Markets May Push EURUSD HigherHello traders!
Today we will talk about emerging markets(EEM) and EURUSD.
As you can see in the first chart, there's a positive correlation between emerging markets and EURUSD. Of course, there are no tick by tick correlations, but the current wave structure it's telling us that we may see a bigger recovery in the upcoming days/weeks.
Emerging markets can be trading in a three-wave (A)-(B)-(C) recovery up to 61,8% Fibonacci retracement and 46 area, especially after that break out of the corrective channel, so in our opinion EEM may easily stay in the bullish trend.
At the same time we can see strong and impulsive recovery on EURUSD, which is telling us that the temporary bottom can be in place and a bigger three-wave (A)-(B)-(C) correction can be underway up to 1.15 - 1.18 area, mainly because of break out of the wedge pattern (ending diagonal).
Notice that these are daily charts and they may take some time to completely unfold, so don't get confused on the smaller time frame charts. We just want to give you an idea, where the markets can be headed long/mid-term.
Be humble and trade smart!
If you like our analysis, then please give us a like and share it!
Disclosure: Please be informed that information we provide is NOT a trading recommendation or investment advice. All of our work is for educational purposes only.

Negatively correlated assetsIn times of increasing instability investors tend to invest in gold and pass from the iShares MSCI Global Metals & Mining Producers ETF (PICK).
Note : Pick seeks to track the investment results of an index composed of global equities of companies primarily engaged in mining, extraction or production of diversified metals, excluding gold and silver.
It is always good to have in portfolio actives with negative correlation, so you dont lose wehn the market goes down. In our case, pick and brent have a negative correlation with Gold and viceversa.. Thus, using negatively correlated investments in his portfolio helps to reduce the overall volatility of the portfolio.

Anti-correlação USD.CAD / WTIBom dia a todos,
Neste gráfico junto o par USD.CAD em conjunto com o WTI.
Já é do conhecimento de todos de que são 2 activos que revelam algum grau de anti correlação.
As perdas no petróleo permanecem limitadas pela fraqueza generalizada do dólar americano e pelo aumento das tensões entre a Turquia e a Síria aliada ao Irão.
As tensões geopolíticas ameaçam interromper o fornecimento de petróleo dos produtores da OPEP.
Além disso, a agitação política nos dois produtores de petróleo da Opep, Iraque e Equador, agrava ainda mais os riscos de interrupção do fornecimento, com a produção de petróleo do Equador provavelmente caindo em um terço em meio a protestos.
Os mercados continuam focados nas negociações comerciais EUA-China e em novas actualizações geopolíticas do Oriente Médio para a próxima direcção dos preços.

SPX500USD H4Price has printed a double top formation today at key resistance level showing that buyers are failing to break higher. Trade war news today on china trade deal slow to come to a resolution. Watching for a move lower to the highlighted zones below, which will correlate with the forex market as well.

BTC | Correlation doesn't assume causationIt sure doesn't. But in BTC's case, it seems as though the two go hand in hand. And despite the rhetoric of BTC being a hedge against risk on assets, since 2011, BTC has a correlation coefficient of about r=0.78 compared to that with gold of about r= -0.14.
Go figure.
And then again, when all shit breaks loose, all asset classes converge to 1. But BTC has never experienced a macro econ recession. If it does, will it also be gaining? As CNBC's Thomas Lee once stated BTC is ambidextrous, we all hope so.
And although BTC is volatile as f*ck, compared to the S&P, BTC's Sharpe Ratio once again steals the show:
BTC YTD Sharpe: 42.9
S&P YTD Sharpe: 20.8
So what's is going to take for BTC to pump again? Do we need the S&P to also pump some? Well as the eve of the 70th anniversary of the People's Republic of China creeps up on us, it's easy to say getting a trade deal done will be the catalyst. But with comments from US officials on Friday threatening to delist Chinese stocks from US exchanges...HOLD on tighter.

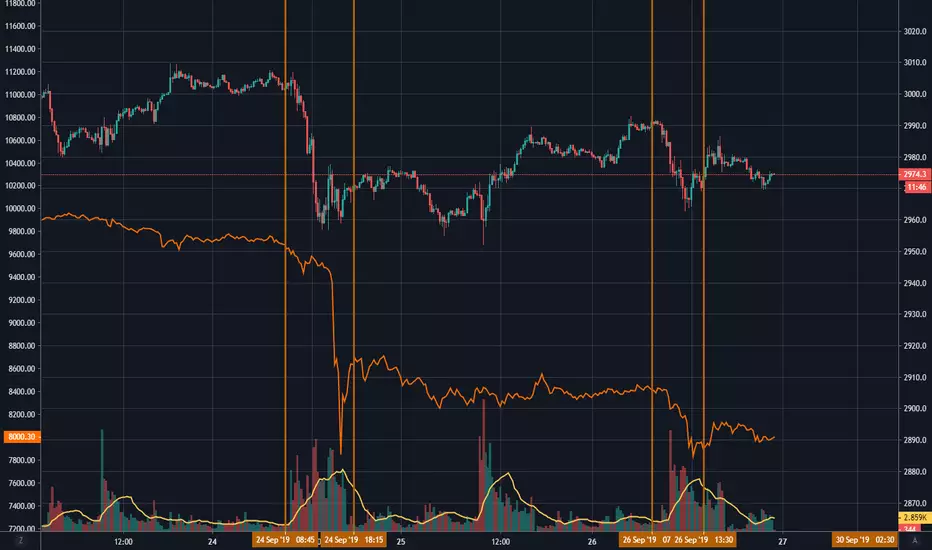
timing bitcoin with the market and vice versaThe correlation in volatility and direction is measurable. Confirmed with the opening of markets tomorrow which is bound to be volatile once again.
the orange line is bitcoin.
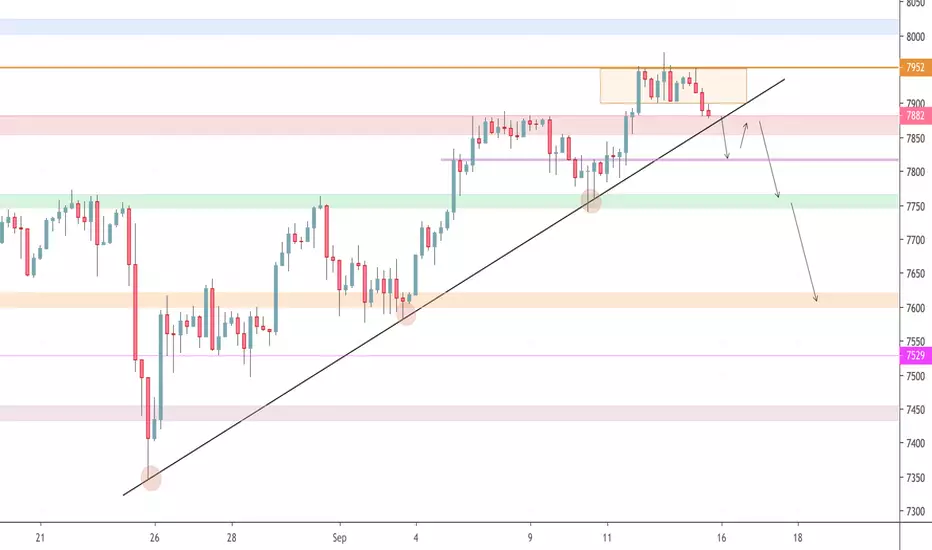
NAS100 H4Price has broken through the ascending trend line, after making a head on shoulders formation. price now is breaking through key level support with a strong bearish engulfing momentum candle through key level support / neckline. Will be watching for a slight pullback to retest broken support as new resistance, as price now looks ready for a new downtrend & has alot of downside potential ahead.

AUD/USD Divergence Timeframe: 4 Hour
Trend: Up
-AUD/USD has made strong gains over the last 2 weeks. Price is currently trading around the 0.50 fib level and is showing some rejection at the 0.50 fib level indicating that buying power is slowing down.
-Bearish divergence can be seen on the Stochastic RSI, indicating some pull back may be warranted to the 0.382 level. This would be good for the uptrend as old resistance is near that level and could act as support.
-Something else to look at is the correlation of NZD/USD (orange line) and AUD/USD, which has an approximate 90% positive correlation on the Daily TF and approximately 85% on the 4 hour TF. NZD/USD had a similar price action a few days ago and broke to the downside on Friday's session, taking a look some price action divergence can be seen there to. I am expecting AUD/USD to follow suite next week and break to the downside for a correction. Ideally NZD/USD would pull up a bit next week so the correlation between the two gets back into equilibrium.
-Look for price to possible correction to the 0.382 level (0.6830 area) and old resistance (0.6820 area).

NAS100 H4Price has made a triple top formation at resistance, along with a break of the consolidation box region. Price is now sitting on support, above the ascending trendline. Will be watching for a breakout of the ascending trendline along with support structure for a trend reversal on this pair..