🎾 Match Point 🎾 French open Stade Roland Garros 1983...
It is 45 to 55 that the bears make the match by turning the market around. We see a 55% chance for the bears to win the match by pushing down prices in the direction of $1900. However, with a 45% chance, the bulls are on the heels of the bears. We have highlighted a potential turnaround zone. Should the bears waste this opportunity and the resistance at $2001.2 is broken, price levels of $2120 are on the map. The next price movement will determine the direction of the upcoming weeks. A way to trade the scenario would be to plant entry orders above $2001.2 and below the purple trendline.
Happy Trading!
Decisionpoint

DECISION ZONE & UPTREND SUPPORTS IDENTIFIED -DASSAULT DSY- DAILYThank you for you likes and shares! Much Appreciated!
_______________________________________________________________
DSY DASSAULT SYSTEMES price have been bouncing several times on the pink decision zone. It is probably the best level for entry/exit in this market.
The blue uptrend line have experienced a strong pullback on it marking an amazing triangle with several elastic effects resulting in a break up above the decision zone.
Another shadowed uptrend line have found its existence and the market could use this invisible line to test again a rebound on it.
This chart helps to see this market in a simpler and uncommon way enhancing the logic behind price movements.

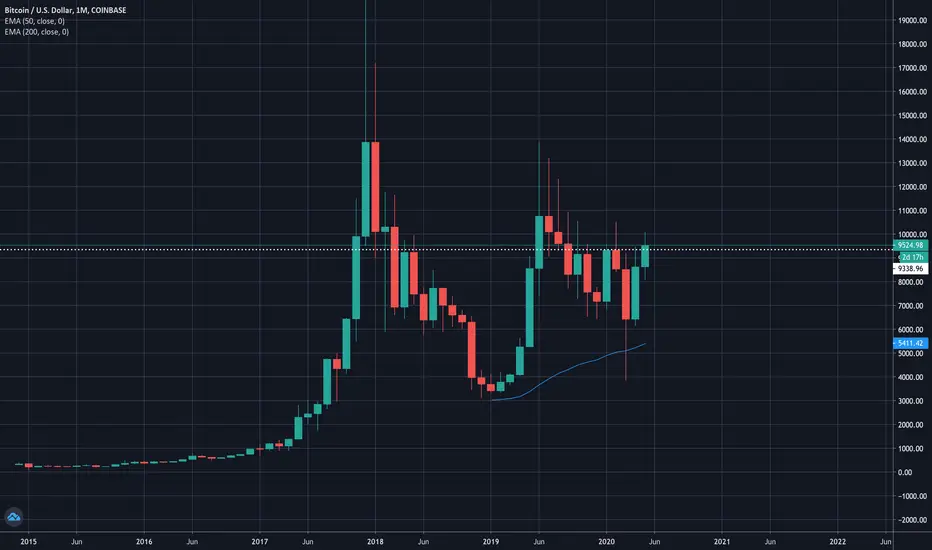
$BTCUSD - Watch the Monthly closeBefore we get into this idea, please note that performance is not guaranteed. I recommend doing your own research before entering any trade. Your upvotes & comments are appreciated.
Just a quick update on COINBASE:BTCUSD , on the Monthly timeframe. As I discussed in todays COINBASE:ETHUSD update, BTC has not closed above $9340 in 9 months. The upcoming monthly close (2 days & 17 hours from the time of writing this update) will tell us a lot about where the corn wants to go.
Previous failed attempts at closing above $9340 have resulted in drops to the $6300 and even $3700 region. The last time we did close a month above $9340, we saw the corn fly as high as the $13,000s.
Essentially, whether we close above or below $9340 is a big deciding factor for the coming months. Be sure you watch it closely.
Good luck traders.
- Jelle
GBP/USD KEY STRUCTURE LEVEL It can be seen on the 4 hour chart that the pair has reached a key decision level.
A massive horizontal structure that spans two months. The pair was moving in a downward channel, and now it has reached both the channel border line and the horizontal support.
On a 1h timeframe it can be seen that the pair is trading in a range of indecision.
I say, if the 1h and 4h candles both close below the level, I go short. If is bounces back, and breaks the range resistance, I go long.
I will say I am long biased, so I will post again, watching closely how it plays out.
Please, hit the like button, it really helps me if you do that!
Wish you luck.

EURAUD Long OpportunityThe market has violated most of our rules but still in drop phase market. We shall wait for the market to return back to the demand zone it created on the flip level and then from there we will look for our chance to buy the market and hold for a few days.

#ETHUSD Decision DayNo trade area for me. We must see the next move to make a decision. That is near to break descending channel. If it does at weekend, would be long opportunity

CADJPY - Decision Point?? #ForexWhere next for CADJPY
I'm inclined to wait for a break of the resistance and a re-test and go long due to the Carona Virus outbreak in Japan
But this will be interesting to see where this one will go

PLATINUM FUTURES REACHING SELL DECISIONS POINTPlatinum is reaching a selling decision point. Waiting any reversal candlesticks or reversal charts pattern or any divergence of any oscillators indicator.

USDJPY - Where to next? #Forex #ForexTraderWhere we heading next?
I'm really inclined to go short as the Fed are 95% going to cut rates, but i need a set up.
Let me know what you guys think

Bitcoin reaches crucial 8-7K Price-Zone as analyzed Bitcoin has now reached the 8000-7000 target zone like analyzed a while ago. This area will be a crucial decision point (like mentioned in the Bitcoin big picture scenarios). The Bullish case would be that the current correction is a corrective wave 2 in a bigger 5 wave impulse to the upside therefore we should turn to the upside around the 7K level to make new highs. However the Bearish scenario, which I personally prefer (but thats a subjective opinion), is that we will see a bounce from the 7K but ultimately break under the 7K area. Should this happen and we break the 7K for a while, then I am assuming the Bitcoin Hype to be finally over, as the last pop of the bubble burst. Should we stay under 7K for a while chances increase, that we will see another sharp sell out with time this sell out can bring the price until a price area of 1200-200 USD for a Bitcoin . So brace yourself as it should get very interesting in this decision area.
The Big Picture scenarios and the prior target analysis are linked on the bottom of this post.

BTCUSD - Possible Movement...2019-08-14 :
We've been following through with this pattern for a long time now and I think the point has finally come where we could possibly see some large movement in the coming weeks or days.


#bitcoin - Sideways continuesBitcoin barely making anything interesting, but as you know this can change fast, keep a good eye on the red diagonal and the break-down level for confirmations of short-term direction. Market dominance is stable and targets above and supports below remain the same. You should all use the time in between to do something cool! Set alerts and get away from the computer.
__________________________
Warm regards,
Neru

BTCUSD - Decision PointA possible continuation of our current upward trend, or an entrance downward back toward the 9k - 9.4k support zone.

Stock market at very critical resistance indicator!If we track % of stocks above or below their 200 day moving averages on a WEEKLY time basis - there are some very clear bull market reversal signals as denoted. We are back to a very critical resistance area that once break up, we could see a very sizeable extended multi-year stock market pump. This would in turn seal the deal I believe for a second presidential turn and the Trump re-inflation of the stock market which will eventually lead to a parabolic top most likely.

$FB Mr.Zuckerg I gotta good feeling about you. FB looking bullish here entered long position on bounce off 164.14 support. Targets 1 2 and 3 highlighted in green. Need to see how price reacts at 171 level. Break of that level for continued bullishness and 188 target. If rejected at 171 level may see retest of 152 level.
Bearish scenerio although is double rejection at 171.40 area. High probability of gap getting filled at 152 before any further bullish actions.
I personally am long. Let us see what is decided.


BTC ... choose your door, Red or Blue?Hello All,
I haven't posted an idea in a while. I've been working my trades hard ... averaging my base costs down to really good levels. My strategy has been to accumulate and work those base costs down to prepare for a bull run.
OK, here is what I see ... based on sub-wave count, and some possible interpretations ...
Blue wave in essence means the inverse head-and-shoulders you are hearing about from everywhere actually breaks out. This would almost certainly mark an end to the mid-term correction ... although I don't think we have hit the absolute bottom yet.
Red wave basically assumes we continue the pattern we've seen for months, being a double top and down. Bears are a bit worn out, so I see a possible correction somewhere between 5k and 5.4k ... less than that, although not impossible, will surprise me. Remember I am talking about a very local, short term bottom ... not the absolute bottom. I do feel the bears need to rest and allow the bulls to profit take before they can take BTC down to the final level ... which I believe will come in 6 to 8 weeks at around 4k to 4.5k.
Anyhow, this is a KEY point. We could break out ... and we could drop. My position is approximately 50% coin, 50% cash. No leverage. All my coin positions are close to or below the bottoms (sold partial positions to work base cost below lowest point on chart) over the past 4 weeks ... so I'm not afraid to hold. If we do dip to 5k, I'll add up to 1x leverage. Below 5k ... I'll start adding leverage. If we do go up instead, I have 50% coin and can decide where to cash out.
Remember only a fool relies on one potential outcome.
Do not use this information for financial/investment/trading decisions. For educational purposes only.

NEO - Elliot correction completed - LONGHi all,
Here is a overview of NEO daily chart.
- Set of 5 Elliot wave is being completed in this Bear Market
- NEO at key long term support
- RSI oversold at 27
- Falling wedge on RSI
- Price compressed between support and resistance lines.
/!\ Downward breakout - Target $25
/!\ Upward breakout - Target $83
This forecast is not a financial advice, study, exercise yourself, put into question your reasoning.
Well, strive to be a better trader tomorrow than we are today.
All the Best from the Crypto Space
Alteroc
AI Trader assistant, includes Bitmex (15% discount) --> app.aitrader.ai
twitter.com

S&P 500: Market at decision point between rally or mild pullbackIf the "S&P 500" breaks above 2815, then the rally is going to continue strongly higher for months. But if the "S&P 500" declines and stays below 2725 until the end of August then there remains a risk of a large stock market crash.
Short-term the market is oversold and could break out above 2800 or a little higher towards 2815.
Mid-term the market is way too overbought. Therefore there is a risk of a pullback down to 2750 or lower.
Long-term the market is neutral at a tipping point here. Due to this divergence between the short-term and mid-term trends.

LTC/USD at decision point - Bounce to $130 of sell off to $50Dear all,
Here is an update on LTC. Clearly undervalued and oversold. However further move downward is an option and is highlighted on the chart.
Here we sit, a bounce to $130 is necessary because below $95 next strong support is at $50.
This trade is driven by 3 main factors:
- LTC currently sitting at key support $95
- RSI is oversold
- RSI forming falling wedge
1st target is $130.
Of course this forecast is not a financial advice, study, exercise yourself, put into question your reasoning.
Well, strive to be a better trader tomorrow than we are today.
All the Best from the Crypto Space
Alteroc
AI Trader assistant, includes Bitmex (15% discount) --> app.aitrader.ai
twitter.com

BTC at key support - falling wedgeDear all,
Here is an update on BTC based on current downtrend and falling wedge patterns.
We can observe that the angle of each falling wedge (correction phases) is smoother and smoother which highlights that the bear cycle is closing to an end.
However BTC even with this triple bottom, can breakout downward this descending triangle to test $6,000 or $5,400.
This analysis is based on:
- Falling and rising wedge patterns
- Trendlines, support and resistance
- RSI
To enter a long term trade now the setup would be as follow:
- Stop loss $6,000
- Target Profits: $7,200 / $7,800 / $8,200.
This forecast is not a financial advice, study, exercise yourself, put into question your reasoning.
Well, strive to be a better trader tomorrow than we are today.
All the Best from the Crypto Space
Alteroc
AI Trader assistant, includes Bitmex (15% discount) --> app.aitrader.ai
twitter.com

BTC - 5 hours to close candle above $6,900 (long Term support)Dear all,
Short update on BTC, the rising wedge finally completed its retracement to the $6,700 area.
Now we have 2 options:
1 - BTC candle 12h candle closes within 5hrs above $6,900 to preserve long term support
In that case BTC will have performed a bullish triple bottom
2 - BTC candle closes below and it will visit lower supports highlighted on the chart
This scenario will be a bearish one since we won't be close to a bull market
Word of advice, always set stop loss, know when to take profit and let the correction clear technical indicators as well as allowing new buyers to enter the market.
Of course this forecast is not a financial advice, study, exercise yourself, put into question your reasoning. Well, strive to be a better trader tomorrow than we are today.
All the Best from the Crypto Space
Alteroc
AI Trader assistant, includes Bitmex (15% discount) --> app.aitrader.ai
twitter.com
