Predictions and analysis
Has this rally been the "complacency" rally? Jim Cramer recently tweeted how much BILLIONARES should be kicking themselves for not being part of this monster rally. Is this just a giant lower high/bull trap and are we already rolling over into the Great Depression 2.0 or ughem, a Great Rest?
Which way? Symmetrical Triangles are generally known as Continuation patterns. This means, when the price breaks out it normally moves in the trend of the prior direction... However, the trend has been sideways before this. It's been in the Twilight Zone for over a year. And it gets worse. When the price oscillates up and down in between the 200MA - You know...
The US Consumer Confidence Index (USCCI) does not look so good. Consumers (normal people) are feeling anxious about their future, and they have good reasons for that. The Bull Market did not last long after the Covid Pandemic and people don't feel optimistic about their future spending or wealth. If you don't know what the CCI is, no worries, I will briefly...
"When the VIX is low, look out below!" + FEDs motto "Higher for longer" = Fed rate hikes to go: 2-3 left it is pivot time, change of market dynamic from "bad news is good news" to "bad news is bad news". state of economy is not good and it will start sinking in to investors and public
All credit booms brought about by Central Bank-induced artificially low interest rates and loose lending standards end in busts. In the recessionary phase that follows the boom, credit becomes much harder to attain and many over-leveraged businesses end up going bankrupt. The recessionary phase reveals the malinvestments and unsound business decisions that were...
This is my expectation for how the XDB/USDT chart will play out for the rest of the year. As you can see, I am expecting an extended period of depression, giving us some huge buying opportunities. Somewhere between July/August we might hit the peak of this depression and capitulation, where we could see prices as low as $0.0004 at the absolute bottom. Then in...
I don't want to explain u +100500 reasons , why do we cannot go parabolic uptrend from now. (because i don't need too and i don't WANT to help u survive ) I just want this Vision to be Published. Just too much FOMO, too much people waiting TO THE MOON when the big Depression is very close. U can believe me or nor - I DON'T CARE I've closed ALL Longs from 16k here...
Greetings traders! I am sharing to you today one of my COINBASE:ETHUSD Elliott Waves analysis. That one is bullish until the summer '23 Fibonacci Extention from the bottom of the orange W to the orange X in order to find the orange Y Fibonacci Retracement of the purple WXY, in order to know where the objectives converges to be more precise Fibonacci...
Hey guys, Been a long time isn't it? I'm back for new analysis. Don't worry, the bull rally isn't over, we are just shorting hard in order to have a 50% of bullish variation just after. I will upload my Elliott Wave long term vision for the different chart that I analyse: SP:SPX ; NYMEX:CL1! ; COINBASE:BTCUSD ; COINBASE:ETHUSD ; FOREXCOM:XAUUSD ...
ETHUSDT prediction analysis using distances between important pivots and fibonacci retracement of ETHUSDT last cycle in the current cycle and the Wall Street Psychology of Market Cycle. We are currently in the Depression phase. Is Disbelief around the corner or in 2024? I think it is in 2024.
Personal Savings are at a historic low, Consumer Credit at highs, and Inflation hasn't popped. The United Kingdom and other leading Eurozone parties have proclaimed their Recession, as the Federal Reserve, BEA, and Executive Branch fight against Wall Street Banks, Wall Street Megacompanies, and basic economic equations contradict each other regarding the US's....
Recession to Depression. Inflation will not be the same.
!!!CAUTION ONLY BIG BRAINS FROM HERE ON OUT!!! White: US 10 Year Bond Yield Orange: US Debt to GDP Blue: US yoy inflation "Inflation transfers wealth from creditors to borrowers for all sorts of nominal debt, not just government debt." -- Christopher J. Neely, Vice President at St. Louis Fed. What is the Great Reset? Is it a new 1929 Crash, a new Great...
A timeline of the Great Depression for 1932 overlaid with the Dow Jones Industrial Average
A timeline of the Great Depression for 1931 overlaid with the Dow Jones Industrial Average
A timeline of the Great Depression for 1930 overlaid with the Dow Jones Industrial Average
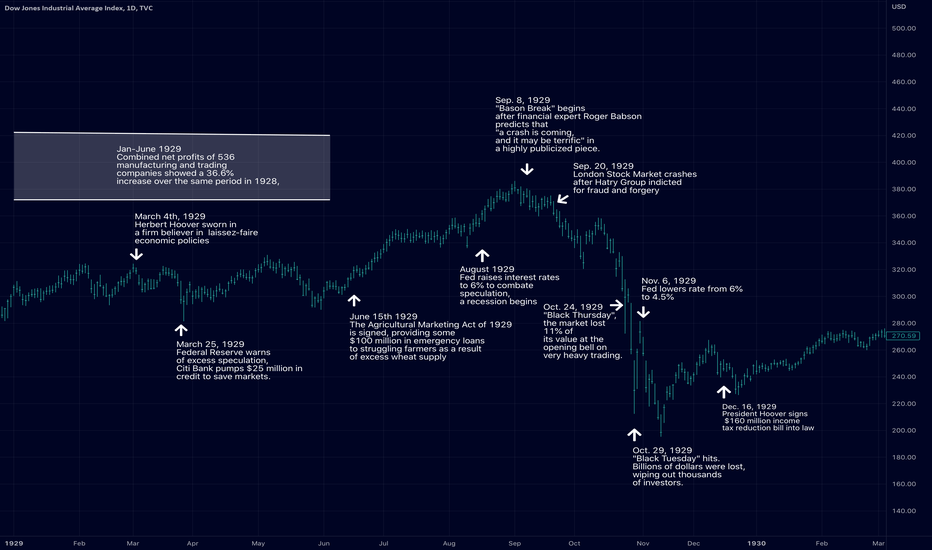
Timeline of major events of the Great Depression in the year 1929 overlaid with the Dow Jones Industrial Average
DXY has left the LAUNCHPAD and is unlikely to return home until its surpassed 160! From the chart we can see that DXY has... - Emerged from the falling wedge with a measured move target of +72, taking us upto 160 OR BEYOND - Has retested the falling wedge trend line and created a double bottom support - DXY has performed these feats before (1980-1985) and is...


