XAUUSD (Gold) 1H chartThe price action is forming a Double Top / Distribution structure near a key resistance zone.
Top 1 & Top 2 are clearly marked at almost the same price level.
This shows buyers are losing momentum and sellers are defending this zone strongly.
After the first top, price corrected, then retested the same zone → classic rejection behavior.
This pattern usually signals potential trend exhaustion if resistance holds.
🔴 Resistance Zone
Major Resistance:
5,085 – 5,100
Why this zone is important:
Multiple candle rejections
Double top formation
Price struggling to close strongly above it
Psychological round-number area
👉 A strong hourly close above 5,100 would invalidate the bearish setup and open the door for continuation.
🟢 Support Levels
Support 1 (Near-term):
5,030 – 5,040
This is the neckline / pullback base and dynamic support (near EMAs).
Support 2 (Major Target Zone):
4,860 – 4,880
This aligns with the projected move of the double top and previous structure support.
📈 Bullish Scenario
If price:
Breaks and holds above 5,100
Shows strong bullish candles with volume
Then:
Upside continuation is likely
Next bullish move can extend toward 5,150 – 5,180
📌 This would mean resistance has flipped into support.
📉 Bearish Scenario (Preferred if Resistance Holds)
If price:
Fails to break 5,085–5,100
Breaks below 5,030 support
Then:
Selling pressure may accelerate
Price can move toward 4,860–4,880 (pattern target)
This aligns with the double top breakdown projection shown on the chart.
Wait for confirmation, not anticipation
Double Top

ROOT: double-top short / shortable bounce set-up Stock's fundamentals, price relative strength, and group action look strong.
But the uptrend structure may have formed a mid-term top.
Weekly:
Downside potential remains as long as the price stays below the May 8th highs.
Ideal macro support zone: 90–70.
Daily:
Thank you for your attention and I wish you successful trading decisions!

Bearish diververgence. Sell in May and go awayI think gold is going down below 1700 next week. Looks like bearish divergence on the hour chart, plus lower highs, lower lows and a doubletop. On top of that the end of the month sell off and May is typically not a good month for gold.
Fundamentals are confusing the technicals so I'm sitting on the sidelines next week or at most scalping.
Good luck!

GBPUSD H1 Liquidity Grab and Bearish Pullback Setup📝 Description
FX:GBPUSD price has rallied into a higher-timeframe liquidity zone after a strong impulsive leg, tapping premium levels and reacting near prior highs. Current structure suggests the move is corrective rather than the start of a new bullish leg.
________________________________________
📈 Signal / Analysis
Primary Bias: Bearish while price remains below the H1 liquidity high
Preferred Setup:
• Entry: 1.3442
• Stop Loss: Above 1.3454
• TP1: 1.3420
• TP2: 1.3406
• TP3: 1.3386 (HTF draw / lower liquidity)
________________________________________
🎯 ICT & SMC Notes
• Buy-side liquidity taken near H1 highs
• Bearish displacement respected on lower timeframes
• Downside liquidity remains the primary draw
________________________________________
🧩 Summary
As long as price holds below the recent liquidity high, the structure favors a bearish pullback targeting lower H1 liquidity pools before any potential stabilization.
________________________________________
🌍 Fundamental Notes / Sentiment
With USD maintaining relative strength and no fresh GBP catalyst, short-term sentiment supports corrective downside rather than bullish continuation.
________________________________________
⚠️ Risk Disclosure
Trading involves substantial risk and may result in capital loss. This analysis is for educational purposes only and does not constitute financial advice. Always apply proper risk management, predefined stop-loss levels, and disciplined position sizing aligned with your trading plan.

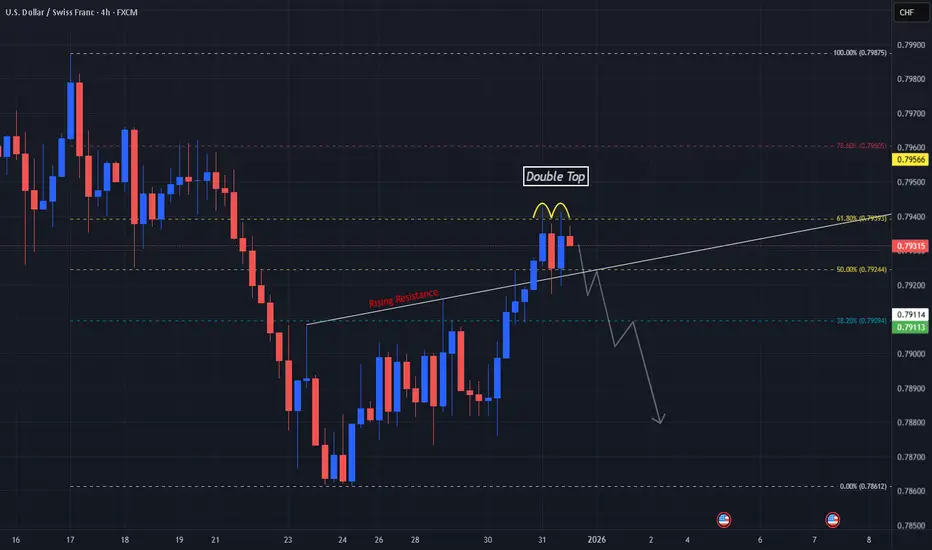
Potential Double Top @ Golden Ratio On USDCHFBefore the New Year, price on OANDA:USDCHF may have formed a strong reversal at a very vital level!
Since the Low @ .78612, price has made a retracement to the High @ .79875 and seems to have found some resistance at the Golden Ratio Level, 61.8% @ .79393.
In prices second attempt to break this level, we see it is again rejected down before markets closed for New Years.
If price breaks back below the 50% level @ .794244 where the Low of the Double Top sits, this will confirm the reversal pattern and generate Short Opportunities!
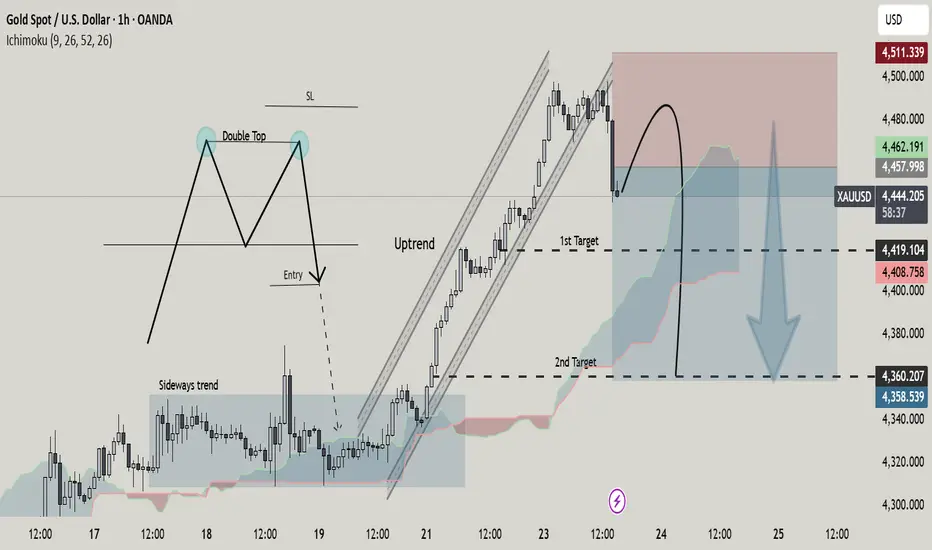
Double Top Reversal Signals End of Bullish MomentumPrice was in a strong bullish channel (uptrend), making higher highs and higher lows. A Double Top formed near the highs, signaling buyer exhaustion and a potential trend reversal.Price failed to hold above resistance and showed rejection near the top, aligning with the Ichimoku resistance / cloud reaction. After the double top, momentum weakens → bearish pullback / correction expected. 1st Target: Prior structure support (mid-range level)
2nd Target: Deeper support aligned with Ichimoku cloud base Invalidation is above the double-top highs (SL zone).
Below that, sellers remain in control.
Overall:
This chart illustrates a classic trend exhaustion → reversal setup, ideal for traders watching price action + Ichimoku confluence.
FTSE 100 stalls at record highs: Double top or breakout to 10k?The FTSE 100 is flirting with a potential double top at 9,950 as markets reopen after Christmas. While a bullish ascending triangle could be building on the 4-hour chart, heavy pressure on defence stocks amid new Ukraine peace talks is creating a battle between a breakout to 10,000 and a correction back to 9,600.
In this video, we break down the macro headwinds hitting BAE Systems and Babcock as investors price in de-escalation risks. Then, we map out the technical tug-of-war: a bullish continuation toward the psychological 10k mark versus a bearish double-top reversal targeting 9,770 and lower.
Key drivers
Defence sector drag : Reports of positive peace talks between Trump and Zelenskyy have triggered profit-taking in defence majors, weighing on the index. However, rotation into defensive sectors like pharmaceuticals is keeping the FTSE relatively stable.
Double top vs. ascending triangle : Price stalled again at the 9,950 record high, forming a double top. Yet, higher lows on the 4-hour chart suggest an ascending triangle—a continuation pattern that could fuel a breakout.
RSI divergence : The 4-hour RSI is showing bearish divergence and drifting toward the 50 line, signalling waning momentum. A reset to 30 could coincide with a deeper pullback if support fails.
Key levels :
Upside : A break above 9,950 targets the psychological 10,000 barrier.
Downside : Immediate support lies at 9,850. Below that, 9,770 is crucial structure. Losing 9,620 and finally 9,440 would confirm a trend reversal.
Trade plan :
Bearish : Sell a breakdown below 9,850 targeting 9,770 and 9,620.
Bullish : Buy a break above 9,950 targeting 10k, but beware of limited upside compared to downside risk at these levels.
Are you betting on the 10k breakout or fading the double top? Share your FTSE strategy in the comments and follow for more market updates.
This content is not directed to residents of the EU or UK. Any opinions, news, research, analyses, prices or other information contained on this website is provided as general market commentary and does not constitute investment advice. ThinkMarkets will not accept liability for any loss or damage including, without limitation, to any loss of profit which may arise directly or indirectly from use of or reliance on such information.

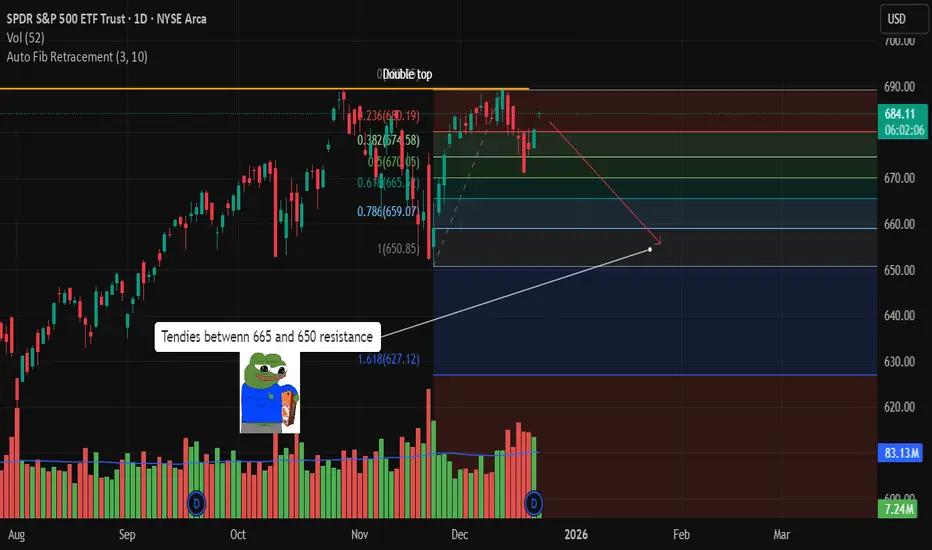
SHORT SPYShorting spy on a double top.
Bought 670 jan 9 puts.
Collect tendies between 665 and 650.
Good appetite.
DOUBLE TOP PATTERN – A CLASSIC BEARISH REVERSAL SETUP📚 DOUBLE TOP PATTERN – A CLASSIC BEARISH REVERSAL SETUP
The Double Top is one of the most reliable bearish reversal patterns, commonly appearing after a strong uptrend. Understanding its structure and confirmation rules helps traders avoid false signals and improve trade accuracy.
🔍 Structure of the Double Top
The pattern consists of three key phases:
1️⃣ First Top
Price rallies strongly and forms the first peak, showing strong bullish momentum.
Afterward, price pulls back, creating a temporary low — this level later becomes the neckline.
2️⃣ Second Top
Price attempts another push upward but fails to break above the first top.
This failure signals weakening buying pressure and early distribution by smart money.
3️⃣ Neckline Breakdown
The pattern is confirmed only when price breaks below the neckline.
This breakdown marks the shift from bullish control to bearish dominance.
👉 Important:
Without a neckline break, a Double Top is NOT valid.
📉 Market Meaning Behind the Pattern
- Bullish momentum weakens after the second top
- Buyers lose control, sellers gradually step in
- A neckline break confirms trend reversal
- When formed after a clear uptrend, Double Top is considered a high-probability reversal pattern
✅ Conditions for a High-Quality Double Top
For better reliability, the following conditions should be met:
✔️ A clear prior uptrend
✔️ Both tops are approximately equal in height
✔️ Volume is higher on the first top and lower on the second
✔️ Strong bearish candles or volume expansion on the neckline break
🛠️ How to Trade the Double Top
🔴 SELL Entry
The safest approach is to wait for a neckline break, then SELL on the retest of the neckline.
This reduces the risk of false breakdowns and improves risk-to-reward.
❌ Stop Loss (SL)
Place SL above the second top (or above both tops).
The stop must be outside the structure to avoid liquidity sweeps.
🎯 Take Profit (TP)
To estimate the target:
- Measure the distance from the top to the neckline
- Project that distance downward from the neckline break
⚠️ Common Mistakes to Avoid
❌ Selling just because price forms a second top
❌ Ignoring neckline confirmation
❌ Trading without volume or candle confirmation
❌ Not combining with other tools
📌 Pro Tip for Higher Accuracy
Combine the Double Top with:
- RSI divergence
- Fair Value Gaps (FVG)
- Trendlines
- Liquidity zones
This multi-confirmation approach significantly increases trade probability.

BTC/USDT: Double Top Pattern - Bearish Target $75k-$78kANALYSIS OVERVIEW
Bitcoin is showing a confirmed Double Top pattern at $108,000 level with a breakdown of the neckline around $92,000-$95,000. Current price action suggests a continuation of the bearish trend toward key support levels.
TECHNICAL STRUCTURE
Elliott Wave Analysis:
The price has dropped from $108k to $85k, representing a 21% correction. This appears to be an ABC corrective wave following the fifth wave completion at $108k.
Key Price Levels:
Resistance Zones:
R1: $90,000-$92,000
R2: $95,000-$98,000 (Broken Neckline)
R3: $100,000 (Psychological level)
R4: $108,000 (Previous ATH)
Support Zones:
S1: $82,000-$84,000 (Current range)
S2: $75,000-$78,000 (Double Top target - Strong support)
S3: $68,000-$70,000
S4: $56,000-$58,000 (Major support from previous Wave 4)
TRADING SCENARIOS
Scenario 1 - Bearish Continuation (60% probability):
Short Setup:
Entry: $88,000-$92,000 (on pullback to broken neckline)
Stop Loss: $95,000
Take Profit 1: $78,000 (R/R = 1:2)
Take Profit 2: $70,000 (R/R = 1:3)
Take Profit 3: $58,000 (R/R = 1:4)
Reasoning:
- Confirmed Double Top breakdown
- Break of market structure
- Strong selling pressure
- Multiple consecutive bearish weekly candles
Scenario 2 - Correction and Reversal (40% probability):
Long Setup:
Entry 1: $75,000-$78,000 (Medium risk)
Entry 2: $68,000-$70,000 (Lower risk)
Entry 3: $56,000-$58,000 (Lowest risk)
Stop Loss: Below $52,000
Take Profit 1: $90,000-$95,000
Take Profit 2: $108,000-$110,000
Take Profit 3: $130,000-$150,000
CURRENT MARKET STATUS
Warning: No buying recommendation at current levels. Wait for bottom confirmation.
For swing traders:
- Wait for bottoming pattern at $75k-$80k range
- Look for Hammer or Bullish Engulfing candlestick confirmation
- Confirm with increased buying volume
For long-term investors (DCA approach):
- 25% allocation at $75k-$78k
- 35% allocation at $68k-$70k
- 40% allocation at $56k-$58k
SHORT-TERM FORECAST (1-2 months):
- Primary scenario (60%): Decline to $75k-$78k
- Secondary scenario (30%): Range-bound $82k-$95k
- Alternative scenario (10%): Quick recovery to $100k
CONCLUSION
Current Signal: BEARISH
Primary Target: $75,000-$78,000
Timeframe: 2-4 weeks
Risk Management:
- Always use stop-loss orders
- Risk maximum 3-5% of capital per trade
- Wait for confirmation before entering positions
The Double Top pattern remains active until price reclaims $95,000 with strong volume. Until then, downside pressure is expected to continue toward the measured move target.

Why is $PG Procter & Gamble NOT good for Dividends nowFor dividends, companies need to have a relatively stable chart, or even some ups/downs are even better, but do NOT gamble (pun intended) on price.
P&G specifically MAY have reached the bottom of the fall, and get a short-term uptrend, but after that double-top and being within a descending channel, my feeling is that the downtrend will continue.
I would NOT get this risk for a little 3% dividend.
WHY?
I use dividends as an accelerator towards Financial Freedom.
FOLLOW me and check my profile if you want Templates and Reports to:
know the exact breakdown of your income to dedicate to Savings, Investments, Basic needs, etc.
Deep research of the best companies providing Dividends, 5-year Yields, with analytics and rationale.

Double Top Formed After 88.6% Retracement on AJHere on the Hourly chart, OANDA:AUDJPY has formed a Bearish Reversal Pattern, the Double Top.
Price attempted to make a Higher High but was cut short by the 88.6% Fibonacci level where we now see price dropped back down to the Confirmation or "Neckline" of the Pattern @ 103.836.
Once the Confirmation is broken, this will generate Short Opportunities to take price down to the next Support Level @ 103.344 - 103.198!

MSFT PullbackPattern Identified: Bearish Double Top pattern confirmed on Microsoft ( NASDAQ:MSFT ) with neckline break and clear measured move objectives. Neckline Break Triggers Measured Move to Gap Fill.
Key Confluence:
First Top: Initial rejection
Second Top: Failed breakout, lower high
Neckline: Support connecting swing lows between tops
Confirmation: Neckline break & retest completed
Measured Move Calculation:
TP1: Distance from highest top to neckline, projected onto the breakout zone = $430
TP2: Gap fill zone from May 1st, 2025 = $400
SL: Above Neckline at previous confirmation

Neutral Price-Action Analysis (ETH/USD – 15M)📌 Neutral Price-Action Analysis (ETH/USD – 15M)
1. Double-Top Structure
The chart highlights a double-top pattern, formed by two peaks around the 3084–3087 area:
TOP 1: Price reached approximately 3084 before pulling back.
TOP 2: Price returned to the same region near 3087, creating the second high.
This shows that price struggled to break above this zone on two attempts.
2. Neckline Zone
The lower boundary of the pattern sits near the 3060–3065 area, where price previously found temporary support.
This level acts as the midpoint of the structure.
3. EMA Context
The EMA 7, 9, and 21 are closely stacked under price, showing short-term momentum earlier in the move.
ETH is currently trading just above these EMAs but showing hesitation near the double-top resistance.
The EMA 50 at approximately 3048 sits below as a deeper support reference.
4. Price Reaction
After touching the second top near 3087, the latest candles show rejection from this zone, indicating reduced strength as price interacts with resistance.
The red arrow on the chart simply illustrates a possible continuation idea based on the structure, not a signal.
5. Summary
ETH reached the 3084–3087 resistance area twice, forming a double-top pattern on the 15-minute chart. Price is now showing rejection from this zone while holding above the 3060–3065 neckline region, with the EMA 50 near 3048 acting as a broader support reference.

GBPUSD wave 2 pullback? Buy the dip or sell the Rachel rally?Sterling surged over 1% last week on UK budget relief, the so-called "Rachel Rally", but profit-taking kicked in at resistance. With both the BOE and Fed now 90% expected to cut in December, the dollar is under more pressure, making Cable pullbacks attractive buying opportunities.
Key drivers:
"Rachel Rally" profit-taking after Sterling's best week since August led to double top at 1.3275 resistance.
BOE December rate cut priced at 90%, creating short-term headwinds.
Fed December cut odds surged to ~90% after ISM Manufacturing fell to 48.2, the ninth straight month of contraction, keeping dollar weak.
Both central banks are cutting, but USD is under more pressure right now, supporting GBPUSD on pullbacks.
Wave structure : Five-wave leg complete from 1.30 low, now in Wave 2 correction. Key support zone between 38.2% and 61.8% Fibonacci (around 1.3150–1.3130). If this holds, buying the dip for Wave 3 of Wave 3 (or Wave 3 of C) targeting 1.3275, then 1.3315 and higher.
Alternative : Losing 1.31 increases risk of continuation lower toward previous low and potentially 1.2847.
Looking to buy the GBPUSD dip? Share your Wave 2 entries in the comments and follow for more macro-plus-technicals trade ideas.
This content is not directed to residents of the EU or UK. Any opinions, news, research, analyses, prices or other information contained on this website is provided as general market commentary and does not constitute investment advice. ThinkMarkets will not accept liability for any loss or damage including, without limitation, to any loss of profit which may arise directly or indirectly from use of or reliance on such information.

$BTC 200DMA Date With Destiny & ISM PMI RelationshipIn every prior cycle when CRYPTOCAP:BTC lost the 200DMA it retested it well into the midterm year.
Everyone still believed in the 4-year cycle even with this failed relief rally.
But all of a sudden this time is supposed to be different 🤓
My base-case is that we do finally see a proper business cycle in 2026.
I would give it a 50% probability that CRYPTOCAP:BTC does see a higher price IF that does occur.
My hesitation here is that BTC got a higher high in November 2021 with a declining ISM vs March.
Additionally, in April 2014 and February 2018 the ISM printed a slightly higher high, but BTC printed a lower high.
This is the conundrum ₿itcoin has with the ISM, and part of the Twin Peaks thesis (pinned tweet).

Double Top: The Pattern That Warns You Before the Crash📘 Mastering the Double Top Pattern: A Complete Educational Guide for Traders
The Double Top is one of the most powerful and reliable reversal patterns in technical analysis. When understood and applied correctly, it helps traders catch the early phase of a trend reversal — often leading to high-reward opportunities with strong risk control.
1 . Understanding the Structure of a Double Top
A Double Top consists of three essential components:
🔸 First Top
- Price pushes upward in a strong bullish trend.
- It forms a peak at a key resistance zone.
- Price then retraces downward → creating the neckline.
🔸 Second Top
Price rises again but fails to break above the first peak.
This failure indicates:
+ weakening bullish momentum
+ growing selling pressure
This is the first warning of a potential reversal.
🔸 Neckline Breakout (Confirmation)
- When price breaks below the neckline, the pattern is confirmed.
- This confirms that buyers have lost control and sellers have taken over.
- This is where professional traders begin to look for short opportunities.
2. What the Double Top Really Tells You (Market Psychology)
A Double Top is psychology in motion:
- Buyers attempt to break resistance twice
- The first attempt succeeds (forming Top 1)
- The second attempt fails (forming Top 2)
- This failure shows exhaustion
- Once the neckline breaks → confidence shifts to sellers
- A new downtrend is likely to start
This pattern is especially powerful after a strong uptrend, because a reversal has more room to move.
3. Requirements for a High-Quality Double Top
To filter out fake signals, look for:
✔️ A strong bullish trend before the pattern
✔️ Two tops of similar height
✔️ Second top usually forms with weaker volume
✔️ Clear and decisive neckline breakout
✔️ Retest of the neckline increases probability
This helps you avoid low-quality setups and false reversals.
4. How Professional Traders Trade the Double Top
1️⃣ Entry Strategy
- The safest and highest-probability entry: SELL on the neckline retest after the breakout.
Entering early (at the second top) is risky — no confirmation yet.
2️⃣ Stop Loss Placement
SL should be:
- above the second top or above the structure that failed
- This protects you from false breakouts and liquidity grabs.
3️⃣ Take Profit Strategy
To project your target:
- Measure the height from the top → neckline
- Project the same distance downward
- This becomes your TP zone
Simple, clear, and effective.
5. Pro Tips to Avoid Traps
⚠️ DO NOT enter just because price forms a second top
⚠️ Wait for the neckline break
⚠️ Watch for decisive bearish candles
⚠️ Combine with:
- RSI divergence
- Trendline breaks
- FVG imbalance
- Liquidity sweeps
These confluences dramatically increase your win rate.
🧠 Final Thoughts
The Double Top is a classic pattern for a reason — it reveals clear market psychology and provides precise entries when used correctly. Mastering it allows you to catch early reversals with confidence and discipline.
If this lesson helped you, let me know in the comments 🚀📉📘

Anticipate Movement Inside of a Range EnvironmentA large portion of crypto price action does not trend. It ranges. And for many traders, this is where the most capital is lost. A range environment feels simple on the surface price moves between two boundaries, but inside those boundaries, liquidity builds, traps form, and false signals appear constantly. Understanding how ranges behave is a core skill for developing consistency.
A range forms when the market fails to create meaningful higher highs or lower lows. Buyers and sellers balance out, and price oscillates between defined support and resistance. This compression is not random. It reflects indecision, accumulation, or distribution depending on the higher-time frame context. Traders who treat a range like a trend are the ones most often punished.
The first step is identifying the boundaries. Equal highs at the top of a range and equal lows at the bottom reveal where stops accumulate. These stops become liquidity pools. Price frequently sweeps one side of the range before moving to the other, trapping breakouts and fading momentum traders. A clean sweep is not the breakout; it is the intention-revealing event before direction is chosen.
Inside the range, structural signals lose reliability. Traditional trend tools cannot be applied. Instead, focus on behaviour at the edges: rejection wicks, failed breakouts, displacement after a sweep, and reclaim patterns. These reactions show whether a sweep is simply clearing liquidity or if a genuine expansion is developing.
Patience is critical. Entering in the middle of the range exposes you to noise, uncertainty, and poor reward-to-risk. The edge comes from waiting at the boundaries where liquidity sits and confirmation appears. A range can persist far longer than expected, so forcing trades inside it leads to frustration and unnecessary losses.
The real purpose of studying ranges is not just to trade them but to anticipate what follows. A compression phase often precedes expansion. When liquidity on one side is taken and price breaks structure with intent, the next directional leg becomes far easier to participate in. Ranges are where future trends prepare themselves.

TESLA IS ENTERING A CRITICAL ZONETesla currently remains in an uptrend while moving inside the existing ascending channel. The most recent reaction came from the trendline, but an important structure has formed above: a clear double top pattern . After the pattern completed, price declined and is now retesting the neckline, which has already acted as resistance. The 50 EMA is also positioned at this same level, adding confluence.
According to the mechanics of the double top, the expected downward projection is typically equal to the distance between the top of the pattern and the neckline. That measured move aligns almost perfectly with the lower support zone and the 200 EMA , forming a strong confluence area.
Additionally, there is an imbalance inside that lower region, which commonly pulls price back to fill it. RSI has formed a downtrend and is moving toward the 30 level, which supports the likelihood of a continued decline.
If price breaks above both the RSI downtrend and the neckline, the move back upward along the channel becomes possible. However, the bearish confirmations remain strong unless a significant positive catalyst invalidates the setup.

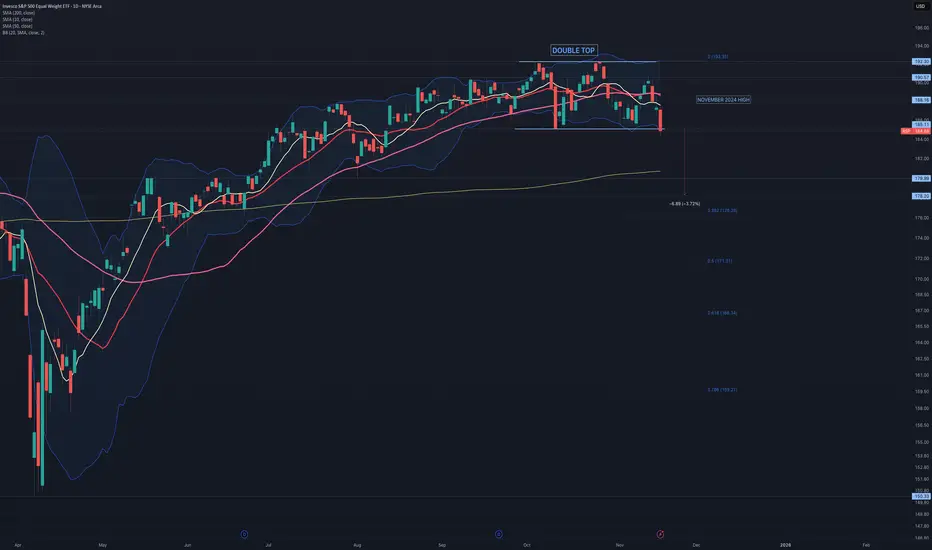
$RSP: Double TOP formation It is concerning that AMEX:RSP has formed a double top. If confirmed, the target price is set at 178. A breakdown of AMEX:RSP will face no obstacles until reaching 180, which is a demand zone and coincides with the rising 20-day simple moving average.
UK100 DOUBLE TOPHey awesome traders! Hope you’re snagging pips. FTSE just printed a clean Double Top—first peak near 9,790, second swing failed beneath it, and price is hovering under the short EL ~9,739.7. This puts sellers in control if we confirm below the neckline.
Key Levels
Peaks: 9,788–9,790
Short EL: 9,739.7
Mid level: 9,679.8 (0.5)
Neckline / Trendline break: 9,571.2
200-SMA: 9,488.3
Measured move T1: ~9,355.7
Trading Plan
Aggressive short: Fade the second top / EL 9,739–9,745 on bearish rejection (engulfing/pin).
Stop: above 9,795 (beyond tops).
TPs: 9,680 → 9,571 → 9,488 → 9,355.
Conservative short (confirmation): Wait for a 4H close below 9,571, then sell the retest as resistance.
Invalidation: sustained reclaim back above 9,571, or especially above 9,740–9,790.

Chart Talk - Nifty it not yet Complete Bullish Hey Guys Welcome to Chart Talk
Today Nifty opened Gap-up and sustained went upside but after that the resistance came so market down over all trend looks down for tomorrow I have explained my View
Thank you

Bitcoin looking bearish in the short termBTC is still in the long-term bullish. But in the short term, it has formed a double top and is currently at an area of interest, the point where it could break the neckline of this double top downwards. It has also begun forming what could be the descending channel that drives this bearish move. If the breakout below the neckline does happen, it'll likely move toward the 90k area, which coincidentally also happens to be where a fair value gap is currently waiting to be filled on a 4H. At this point, it would've broken out of the long-term bullish ascending channel and will likely form a structure that suggests reversal of the short-term bearish move, back into the channel to continue the longer-term bullish trend.
What do you think? Let me know in the comments.
