SP500: Wave Estimation via FibsRegularities
Common angle
To estimate where it's heading to we use those recursive patterns and map them through fib scaling. Overall systematic wave expands in similar geometric narrative but with a compressed cycle.
Economic Cycles

WHAT IS THE EXPECTED RETURN and DURATION of this GOLD Bull Run?Well, when measured against the DXY index, a clear trend becomes apparent.
A Golden Bull typically lasts about 40 quarters, which is essentially 1 decade (give or take a quarter).
Similar to #Bitcoin and its cyclical bull markets within a larger secular bull, the returns tend to decrease over time.
However, it seems that a triple-digit Gold price relative to the DXY is on the horizon at the very least.
What would that look like if the DXY were to hit a new low around 69? This would suggest a Gold price of $6900 at a ratio of 100:1.
A Gold price of $12K with a DXY of 80 only requires a ratio of 150...
Thus, a five-digit Gold price is certainly within the realm of possibility.
I have forecasts that extend as high as $12K.

Descending channel and second-step trapn the descending channel that has formed, the candles indicate a downward move
OANDA:GBPNZD

Expecting a pullback to test the channel’s floorA strong candle without follow-through is a sign of trend weakness, and from where the channel has formed, a pullback to the channel’s floor is logical
OANDA:EURUSD

SSYS to 50A victim of the 2013 bubble has finally bottomed out and remains a leader in the 3D printing industry. As robotics and advanced materials advance, 3D printing will become the standard in manufacturing.
A very beaten down stock for almost 10 years can go back to 50 and possibly higher. Has government and corporate contracts in: Medicine, aerospace, defense, and cars.
- Break over 12.50 makes 50 inevitable given overall markets continue to perform well
- If earnings were to see a large jump through sudden increased demand, new ATHs are absolutely in play

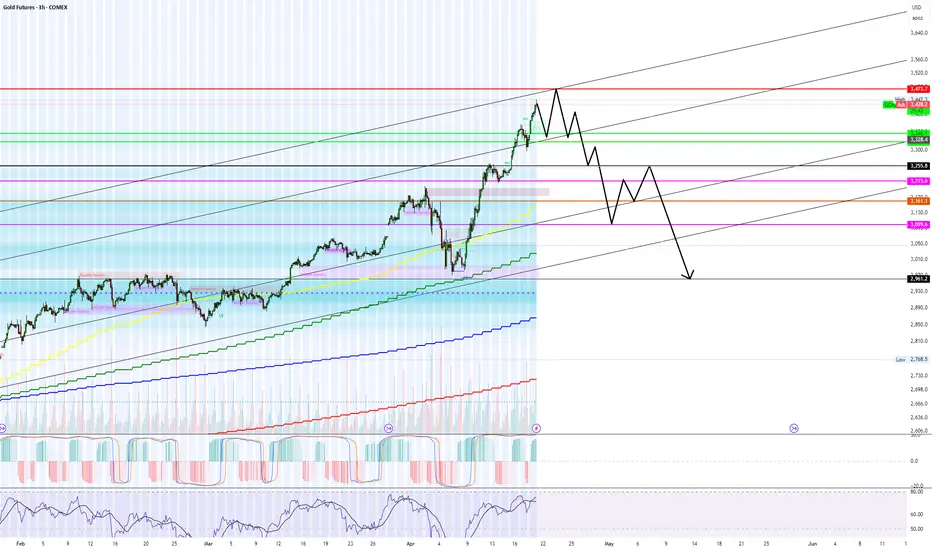
Agree to disagree... Gold is topping right now.My price path seen above is a complete guess but it stems from long term trend lines and more importantly order flow from last week.
On Thursday there was a #1 trade on AMEX:PHYS for $200+ Million at the green levels in my chart above (Equivalent levels). PRICE WILL 100% go to my green lines by end of this week 04/25.
We are over shooting the dark pool sale but a lot, however, this is always to trap retail and create fomo/peak fear.
In the correction/recession cycles, gold ALWAYS TOPS LAST before the crash...
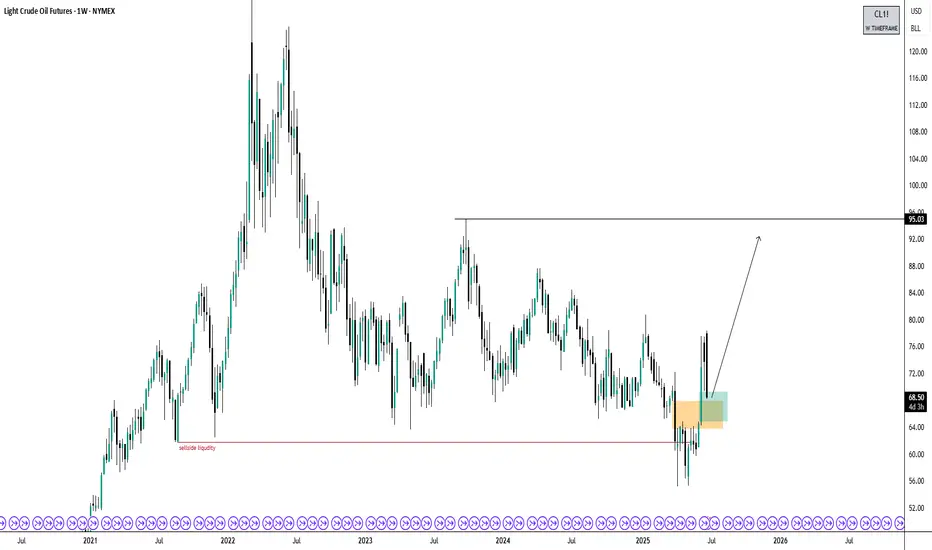
Crude Oil Bullish BiasThree years ago, I predicted that oil would trade below $61 when the price was around $118. Price traded to $55 and is now up to $68. I now believe price has exhausted sell-side liquidity and will trade higher, possibly seeing $95 and beyond.
*Not financial advice
ADA | BTC | ET | Why ALTSEASON is COMING SOONAfter a -34% retracement, ADA is ready to go higher alongside with the rest of the alt market.
We see a very interesting phenomena here, were ADA also represents a large part of the larger alts: BTC pulls back, ETH is starting to increase or trades sideways (before the increase) whilst the alts dip.
This is actually BULLISH for alts, showing the very clear rotation between BTC, ETH and top 15 alts.
If we look at the macro of ANY of the alts I've been working through recently, a similar pattern appears - a clear bottom, followed by a sideways trade. This is usually the point just before the big ALTS season.
We actually see this pattern at the end of the 2018 rally, as well as after the 202- Covid dip:
The bottom line -
ADA and other alts are gearing up for their ALTSEASON. With patience, we will soon see some great gains across the markets.

$BTC Leading Macro Indicator Chart Predicted the Nuke to The DayYet again this chart predicted the nuke to the day 💣
I know I shouldn't be surprised at this point, but I'm still fascinated by how accurate technical analysis can be 🤓

GBPUSD - Technical Outlook (Long + Short Term)In this article, I’ll share my current outlook on GBPUSD, highlighting both higher time frame (HTF) and intraday considerations.
Higher Time Frame Analysis
The overall trend remains bearish. Price is still trading within the previous structural leg, with the key level at 1.42500. Unless we see a decisive break above this level, my bias will remain bearish for this pair.
Recently, we’ve witnessed what looks like institutional manipulation to the upside, followed by a sharp bearish reaction from the weekly supply zone. This price action aligns with a classic Wyckoff distribution cycle, which often signals that the prevailing trend is likely to continue.
Intraday Advice
For short-term traders, it’s best to wait for lower time frame (LTF) pullbacks and signs of manipulation before considering short positions. If price continues to push lower, there should be opportunities to ride the trend down over the coming weeks, with multiple entry points along the way.
Trading Considerations
If this analysis plays out, there’s potential to maximize gains through both swing and intraday trades. However, patience and risk management are key. Losses are inevitable - what matters is managing risk and staying disciplined.
Key Points to Remember:
Wait for clear pullbacks before entering trades.
Stick to your risk management plan.
Stay patient and let the market come to you.
This is an exciting time to trade FX:GBPUSD , but always assess if the risk is worth the reward before entering any position.
Happy hunting predators...
Apex out!

XAUUSDExpecting price to open and decline a bit to then buy possibly for the rest of the week. Looking for Bulls to take over for as long as price respects the lows below after Monday headings candle formation the direction might be validated. If not right after Mondays open and low. If not then we might expect the opposite direction.

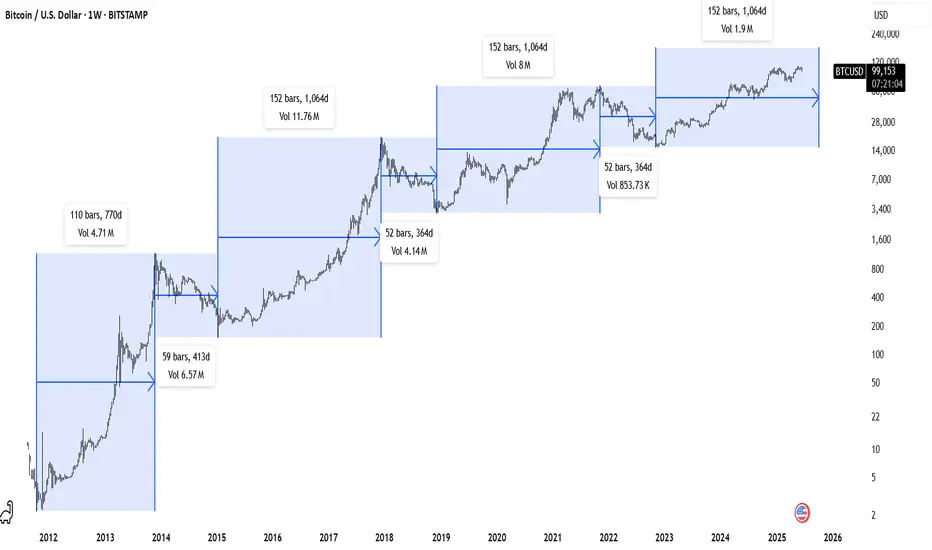
BTC Weekly - Time PatternsBitcoin Weekly Chart
52 Wk & 152 Wk Patterns // Diminishing returns
For my own personal logs.
BTC/USD - The Bitcoin Cycle TopBTC has recently broken below a key uptrend line that had been guiding price for some time. I’m watching for a potential backtest of that broken trendline, a rather classic move that could set the stage for a final upwards squeeze, possibly printing a quick higher high to trap late longs.
I’m watching the circled area closely as a potential exhaustion zone. Key levels and price action around the trendline will be critical, breaking of upwards trendlines after backtesting may mark the beginning of the larger unwind.
We could see multiple backtests of the broken trendline over time, with the trendline now likely acting as resistance.
Note: I’m publishing this idea simply to have a timestamped record. This post is my way of putting a clear marker in the sand. I’m not looking to debate or go deeper into the reasoning, and I generally won’t be responding to comments.

Geopolitical Tension May affect Gold's Outlook!Gold is traditionally considered a safe haven, with prices often rising during geopolitical tensions as investors seek safe security.
Will this scenario play out with the U.S. involvement in the Israel-Iran conflict? Gold is currently trading at a high of 3,368.75 and remains in a range. However, in times like this, technical analysis might take a back seat, as geopolitical developments could overshadow any technical setup.
N.B!
- XAUUSD price might not follow the drawn lines . Actual price movements may likely differ from the forecast.
- Let emotions and sentiments work for you
- ALWAYS Use Proper Risk Management In Your Trades
#gold
#xauusd

SET's 4th time RSI(50m)< 30 since it's inceptionEvery time the SET Index enters the RSI "red zone" (oversold territory), the long-term outcome has consistently been positive. Historically, the following 8–10 years have delivered strong returns, with some bull markets reaching over 15% annually.
The duration of time spent in this red zone has also been decreasing—21 months during the 1997 crisis, 6 months in 2008, and just 3 months in 2020. Currently, we are 5 months into this oversold zone.
But unlike developed markets, Thailand’s stock market is largely liquidity-driven rather than purely fundamentals-driven. That means prices can often disconnect from actual economic conditions due to capital flows and investor sentiment.
When liquidity dries up, prices fall sharply—but that also creates mispricing and higher information asymmetry, which can lead to alpha opportunities. This is exactly why we need to pay even closer attention now.

[ TimeLine ] Gold 17-18 June 2025📆 Today: Tuesday, June 17, 2025
📌 Upcoming Gold Signal Dates:
• June 17, 2025 (Tuesday) — Single-candle setup
• June 17–18, 2025 (Tuesday–Wednesday) — Two-candle combined range
🧠 Trading Plan & Notes
✅ Gold recently posted a strong bullish rally of ~740 pips, breaking through the key psychological resistance at 3400.
🔁 Several re-entry opportunities emerged, especially around Fibonacci retracement levels, which served as reliable reaction zones.
⚠️ As of writing, the June 17 Hi-Lo range appears relatively narrow (~300 pips). It may be wise to wait for June 18 to form before committing to a trade, to avoid false breakout risks and gain clearer directional bias.
✅ I will personally trade both signals (June 17 and June 17–18) as part of my live research and strategy development.
⚠️ If you're feeling cautious, it's perfectly valid to skip the June 17 signal and prioritize the 2-day setup (June 17–18) instead.
📋 Execution Plan
🔹 Wait for the Hi-Lo range to fully form from the selected candle(s):
▫ Initially marked with purple lines on the chart.
▫ Additional levels (Fibonacci, buffer zones) will be added after market close.
🔹 Entry Rule: Triggered only on breakout beyond the range, with a 60-pip buffer.
🔹 Recovery Rule: If SL is hit, cut/switch and double position size on the next valid breakout setup.
📉📈 Chart Reference
🔗 Copy & paste into TradingView: TV/x/Zg1X1vHF/
Stay tuned for the post-market update and range breakdown once the June 17 and 18 candles are closed. Let the chart guide you, and manage risk smartly.

BITCOIN TO 193000!!!!EVERYONE IS WRONG!it has been 5 years that i have been studying the btc and linkusdt cycles, and what i know is that a bull market is coming this summer, starting in july—maybe on the 4th or 7th.

AMD: Mapping Cycle via 3 FibsWaveform
High To High cycle Fib interconnection
Extension to the right matches recent bottom.
Expanding and anchoring the structure on L2L cycle
Levels around 3 intersections expose highest probability density.

NAS100 (US100) Mid Week Reversal - Bullish Order FlowA Half Batman presents itself during the Asian session and seems to be ready for LDN opening. This Peak Formation could be seen as the reset, to turn NAS100 bullish and ready to break the structure high.

TOTALCAP — The Next Trillion Crypto Move: Are You Ready?When people analyse the crypto market, they often default to Bitcoin and for good reason. It’s the one and only, the king. But sometimes, to see the forest instead of just the tree, you need to zoom out and study the broader picture.
That’s where the Crypto Total Market Cap (TOTALCAP) chart comes in. It’s essentially the mirror of Bitcoin, but it offers powerful macro insight — not just price, but scale. Looking at trillions instead of dollars changes how you frame support, resistance, and overall sentiment. Let’s dive in.
🧠 Why TOTALCAP Matters
TOTALCAP aggregates the value of every coin and token — the complete valuation of the entire crypto industry.
And while it often moves in sync with Bitcoin, it carries a different weight.
Shows the “big picture” of institutional and retail money flow
Offers clearly defined round-number zones (Trillions) as psychological S/R
Removes coin-specific anomalies and focuses on collective momentum
In bull and bear markets, these trillion-dollar thresholds act like major checkpoints. Watching how TOTALCAP interacts with these levels can give early signals that BTC or alts alone can’t.
Historical Key Levels & Structure
Let’s break it down by macro phases:
✅ November 2021 — Peak of Last Bull Market:
TOTALCAP peaked exactly at $3 Trillion.
This level acted as a ceiling — once hit, the market reversed sharply.
This marked the top of the 5-wave impulsive move (Elliott Wave theory).
📉 November 2022 — Bear Market Bottom:
TOTALCAP dropped below $1 Trillion, bottoming at $727 Billion.
This was almost a 0.786 fib retracement from peak — similar to BTC’s historical retracements.
The $1T mark was retested as resistance before being reclaimed as support.
📈 2023–2025 — The Bull Awakens:
$1 Trillion flipped into solid support throughout 2023.
A clear sign the macro market structure had shifted bullish.
Once $2T was breached, things moved fast.
🚀 Current State:
The market surged above the previous $3T ceiling.
TOTALCAP has hit a new ATH: $3.73 Trillion
Now, the question is: Is this the start of a new leg higher, or a bull trap before a correction?
🔍 Fibonacci Confluences — Why $3.7T Was Key
The sharp rejection at $3.7T wasn’t random. It aligns with:
1.0 Trend-Based Fib Extension: From 91.24B → 3T high → 727B low = 1.0 = 3.65T ✅ precise hit
1.272 Fib Extension of the macro move
Upper Pitchfork Resistance
Channel Top Rejection
→ All signals converged to mark that level as major resistance
🌀 Elliott Wave Macro Count
Looking at the weekly timeframe, we can see a clear impulsive 5-wave movement from the 2022 lows:
Wave 1: $727B → $1.26T
Wave 2: Correction to $975B ($1T) (support confirmed)
Wave 3: Massive rally toward $2.72T
Wave 4: Pullback toward $1.69T (VWAP retest)
Wave 5: $3.73T ATH
What does this imply?
According to classical Elliott Wave theory, after a full 5-wave move, the market tends to enter an corrective phase.
🔍 Some key levels to watch:
$3T: Historical S/R (was the 2021 top, now acting as a key level)
$2.31T: Recent swing low
$2T: Psychological and structural support
📌 Zone of Interest for Longs: $2.31T–$2T
This zone holds:
Previous consolidation zone from mid-2024
Fib retracement confluence
Likely forming Wave C bottom if this is a full ABC
🎯 Upside Targets — What If We Continue Higher?
Looking ahead:
🔸 1.618–1.666 Fib Extension = $4.42T–$4.53T
🔸 1.618 TBFE from previous cycle = ~$5.45T
📌 Rounded Targets: $4.5T, $5T and $5.5T
These are the next likely macro cycle targets — but only after a healthy correction and consolidation.
☀️ Macro Context & Summer Seasonality
Historically, summer tends to be a weaker period:
Lower volume
Institutional rebalancing
Geopolitical and macroeconomic uncertainty
📚 Educational Insight: TOTALCAP as a Tool
Treat TOTALCAP like the S&P500 of crypto.
Use round trillions as psychological levels: 1T, 2T, 3T, etc.
Always check if BTC’s price is aligned with where TOTALCAP is on the macro structure
Helps judge market strength even when BTC dominance is shifting
It’s especially useful when altcoins pump or dump out of sync with BTC — you can use TOTALCAP to track the real flow of money.
💡 Final Thoughts
We are likely in a corrective phase after a complete 5-wave cycle.
The area between $2.31T and $2T offers high-probability long entries
Watching how TOTALCAP reacts to these levels will help us anticipate the broader market’s next move
Summer slowdown could mean chop — but this also creates opportunities
💬 Let me know your thoughts: Are we entering a deeper correction? Or will TOTALCAP surprise us with a new leg higher?
Don’t forget to zoom out. The charts always tell the story.
_________________________________
💬 If you found this helpful, drop a like and comment!
Want breakdowns of other charts? Leave your requests below.

[ TimeLine ] Gold 9 & 11 June 2025📆 Market Update: Signal Timeline – Gold (June 9 & 11, 2025)
📌 Delayed Journal Entry — Trade Review & Breakdown
📍 Hi-Lo Ranges (with 60-pip buffer)
• June 9, 2025: 3287 – 3344 (Single-candle setup)
• June 9-10, 2025: 3287 – 3355 (Two-candle range)
• June 11, 2025: 3294 – 3366 (Single-candle confirmation setup)
💡 Interestingly, these price patterns showed consistency, and I executed trades based on all three signals.
✅ June 9 – Buy Signal(s)
🔹 Trigger Points:
• 3344 (Single-candle setup)
• 3355 (Two-candle range)
🔹 Price Action:
Strong bullish breakout toward 3451, but experienced significant retracement depending on entry point.
• Drawdown: Up to 50–70% of the range based on entry.
• Gain Potential: Approx. +960 to +1070 pips
⚠️ Fibonacci Note:
Retracement to around 3310 aligned well with the 60% Fibonacci zone, providing a textbook re-entry opportunity.
✅ June 11 – Buy Signal
🔹 Trigger Point: 3366
🔹 Price Action: Continued bullish move to 3451, this time with less volatility and smaller pullback.
• Gain Potential: Approx. +850 pips
📈🧠 Key Takeaway
The June 9 signals required more patience and better handling of retracement, while June 11 offered smoother momentum with cleaner execution. Those following the Fibonacci strategy were well-positioned to catch the continuation.
📉📈 Chart Reference
🔗 Copy & paste into TradingView: TV/x/MyAsl0Gx/

[ TimeLine ] Gold 2-3 June 2025Hello everyone,
📆 Today is Friday, May 30, 2025
📌 Upcoming Gold Signal Dates:
• June 2, 2025 (Monday) — Single candle setup
• June 2–3, 2025 (Monday–Tuesday) — Two-candle range
🧠 Trading Plan & Notes
✅ Gold recently made a bearish move of ~780 pips, breaking below the prior key support at 3323, down to 3245
🔁 Multiple re-entry opportunities were identified using Fibonacci retracement levels, which provided solid price reaction points.
⚠️ If the June 2 Hi-Lo range appears wide and sideways, we may consider holding off until June 4 for confirmation of clearer directional bias.
✅ I will be trading both signals (June 2 and June 2–3) as part of my ongoing research and strategy
⚠️ If the range is narrow or shows false breakout risk, it's okay to skip the June 2 signal and focus instead on the June 2–3 combined range.
📋 Execution Plan
🔹 Wait for the Hi-Lo range from the selected candle(s) to fully form.
▫ These will be marked initially with purple lines on the chart.
▫ After market close, I’ll update the chart with additional indicator levels.
🔹 Entry triggers will be based on breakouts beyond the range, with a 60-pip buffer.
🔹 If the trade hits SL, the plan is to cut/switch direction and double position size on the next valid signal as part of the recovery strategy.
📉📈 Chart Reference
Copy & paste this code into your browser and add TradingView URL:
🔗 TV/x/iQrX0gJW/
✅ Stay alert and follow the signal flow — upcoming entries could offer solid reward potential if executed with discipline.
📌 I'll post the final Hi-Lo levels and updated chart after the June 2 and June 3 candles close.

USDT Dominance SHOWDOWN INCOMINGAfter a full liquidity sweep at 4.50%, USDT.D is now pressing into the EMA cluster from below…
📊 What does that mean?
➡️ Stablecoin dominance is rising = risk-off behavior creeping in
➡️ But we’re STILL under trend — and that green dot sweep could mean a fakeout bottom
🧠 If USDT.D breaks above EMAs → altcoins bleed
🔥 If USDT.D gets rejected here → altcoins pump hard
This is the pivot. Watch closely.
