XAU USD - Corrective wave ABC?Updte to previous post.
Still long, awaiting the corrective structure to occur - firstly to break and hold under $4000 (key level).
Downward channel - to $3800 which is another area of interest - reason being, it holds high volume at a structure point under $3800. So, we sit tight and await the corrective pattern to emerge and complete.
Daily chart image shows my thought pattern and an opportunity I am waiting for price to revert to.
I'm referring to the Daily price chart and key counts are in line with Wave counting and supply and demand curve trading levels based on fair value gap intervals of weekly trading sessions plotted to a daily chart at intervals of 60.
Current wave - 3 of 5 in the Elliott wave count.
Experiencing ABC corrective structure.
Master Key for zones
Red = Three Month
Blue = Monthly
Purple = weekly
Pink = Consolidative box example (Daily)
Orange = Daily
Risk Warning
Trading leveraged products such as Forex, commodities and CFDs, carries with it a high level of risk and so may not be suitable for every investor. Prior to trading the foreign exchange, commodity or CFD market, consider your investment objectives, level of experience and risk appetite. You should never risk more than you can afford to lose. If you fail to understand or are uncertain of the risks involved, please seek independent advice and remember to conduct due diligence as criteria varies to suit the individual.
Below are some of the take aways from the video - please listen again incase any detail is missed.
Do you enjoy the setups?
Professional analyst with 8+ years experience in the capital markets
Focus on technical output not fundamentals
Focus on investing for long term positional moves
Provide updates where necessary - with new updated ideas tracking the progress.
If you like the idea, please leave a like or comment.
To all the followers, thank you for your continued support.
Thanks,
LVPA MMXXIV
Economic Cycles

Bitcoin / #Russell2000 📝The index of small companies is known for being highly dependent on bank financing. Therefore, of course, he is the main beneficiary of cheaper money after the rate cut.
👀What we see about correlations, CRYPTOCAP:BTC bull markets, coincide with the movement of this index as you can see, in the green zone on the Spearman indicator,
💡We can also see that Russell 2000 is far from its ATH, which is also a bullish sign, because small companies in the stock market grow quite predictably with GDP growth and increased liquidity, and in the current state is far from overheated.

S&P 500 — Sector Performance Analysis (1Y, EUR)Over the past year, only 3 sectors have outperformed the index (+11.2%):
🔺 Technology ( AMEX:XLK +26.9%)
🔺 Communication Services ( AMEX:XLC +17.0%)
🔺 Consumer Discretionary ( AMEX:XLY +14.3%)
Meanwhile, 8 out of 11 sectors underperform the benchmark, and 5 of them are even in negative territory — including Energy, Health Care, and Materials.
💭 This highlights the narrow market breadth driving the S&P 500: a handful of mega-cap tech names are carrying the entire index while most sectors lag behind.
📈 Chart: TVC:SPX sectors — 1-year total return in EUR

Price Action: Long Term, Mid Term, Short Term Trend Explained
In this article, I will teach you the basics of market trend analysis.
We will discuss Long Term, Mid Term and Short Term trends.
I will show you how to identify and apply them properly.
Please, note that we will execute the trend analysis strictly on a daily time frame.
For the trend identification, we will rely on classics price action analysis rules.
We will say that the trend is bullish if the price forms at least 2 consequent bullish impulses with a retracement leg between them, so that the price would set at least 2 higher highs and a higher low between them.
We will say that the trend is bearish if the price forms at least 2 consequent bearish impulses with a retracement leg between them, so that the price would set at least 2 lower lows and a lower high between them.
If none of these conditions are met, we will say that the market is consolidating .
Long Term Trend
Long term trend is based on the analysis of a price action over 1 year.
To identify a long-term trend, start by analyzing the price action over a period of one year from the current trading day.
Analyze highs and lows.
According to the rules, the long term trend on USDCAD is consolidation.
Mid-Term Trend
Mid-term trend is based on the analysis of a price action over the last 5 months.
To identify a mid-term trend, start by analyzing the price action over a period of 5 months from the current trading day.
Analyze highs and lows.
According to our rules, the mid term trend on the pair is bearish.
Short Term Trend
Short term trend is based on the analysis of a price action over the last 2 months.
To identify a short-term trend, start by analyzing the price action over a period of 2 months from the current trading day.
Analyze highs and lows.
According to our rules, the short term trend on the pair is bearish.
According to our trend analysis,
long term trend is a consolidation,
mid-term trend is bearish,
short term trend is bearish.
Combining these 3 trends, we can derive that the pair is trading
in a huge range . After the price reached a resistance of the range, the price started to trade both in a short term and midterm bearish trends.
We can anticipate a bearish continuation till the price reaches a support of a long term range.
That is how you execute a trend analysis with price action.
❤️Please, support my work with like, thank you!❤️
I am part of Trade Nation's Influencer program and receive a monthly fee for using their TradingView charts in my analysis.

XRP is about to skyrocket XRP is about to skyrocket, this is where the BIGGER INSTITUTIONS🏦 ACCUMULATED LONG POSITION,BUY XRP NOW

Cardano - Realistic take4 separate times that RSI Divergence has occurred in oversold territory has hinted and displayed positive upside shortly after.
*Bullish Shark harmonic could be forming.
My current price to add more: ~.45 range.
No current TP at this time.

BITCOIN BuySince bitcoin has been bullish this goes with trend. Price sweeped an internal low that was a POI as well. The inducement is what giving me confirmation to buy bitcoin.

Currently corrected in daily timeAfter hitting the lower range of 101 to 98
Price
If the price does a good floor and no other news shakes the market
The previous ceiling will be easily hit, of course (if Trump doesn't start a new game)

Cocoa Crash: From $12,000 to $6,000 — Over 50% Drop in 2025After hitting record highs above $12,000 per ton in April 2024, cocoa futures ( NYSE:CC ) have plunged more than 53%, now trading near $6,000.
The selloff comes as supply pressures ease in West Africa, speculative longs unwind, and better weather improves harvest outlooks.
Still, chocolate prices haven’t followed — showing how slow consumer prices react even when raw materials collapse.
#Cocoa #Commodities #Futures #Inflation #Deflation #Softs #OrbisInvestment

GOLD GATHERING MOMENTUM TO RETEST RECENT HIGHA close above (b) will confirm gold's price readiness to rise after creating a HH and HL.
N.B!
- XAUUSD price might not follow the drawn lines . Actual price movements may likely differ from the forecast.
- Let emotions and sentiments work for you
- ALWAYS Use Proper Risk Management In Your Trades
#gold
#xauusd

EURUSD buydaily cycle. lit cycle. POI. Liquidity sweep. Volume diminishment. retracement is very corrective which is liquidity thats going to get taken out.


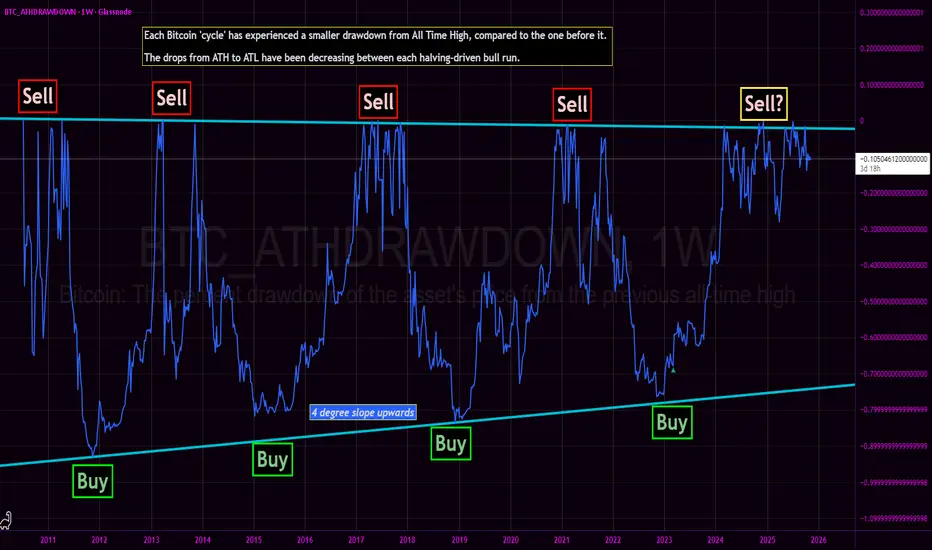
Bitcoin All Time High Drawdown - Bottom nowhere in sight?We revisit the Bitcoin All Time High Drawdown chart originally published in March 2023.
The core thesis of the BTC_ATHDRAWDOWN chart remains intact: each subsequent market cycle has exhibited a diminishing drawdown from its prior All-Time High, with generational cycle bottoms resting squarely on a discernible upward-sloping diagonal support (the 'Buy' line). The 2022-2023 bear market bottomed perfectly on this structural trendline, confirming the '4 degree slope upwards' trend.
Current Cycle Progress: The Sawtooth Fractal
Following the decisive breakthrough of the 2021 All-Time High, price action has entered an unprecedented and structurally complex phase. We are currently witnessing a prolonged high-frequency sawtooth waveform of continuous All-Time Highs.
This action represents the longest sawtooth fractal near ATH of any cycle prior.
This is a stark deviation from the swift, parabolic ascents that characterized previous blow-off tops:
Contrasting the 2017 Pattern: The 2017 bull run culminated in a sharp, almost vertical run-up to $20,000, immediately followed by a steep and rapid crash. That was a classic V-top.
The 2024/2025 Pattern: Instead of a quick V-top, the market is engaged in an extended, messy distribution/consolidation phase right at the very peak. The continuous setting of new, marginal ATHs followed by sharp, shallow pullbacks creates a dense, high-frequency signal in the ATH Drawdown chart.
This structural evolution—a prolonged struggle to hold and marginally exceed previous peaks—suggests that the market is either building a much larger, more resilient base for an extended super-cycle, or undergoing a slow, drawn-out distribution that fundamentally alters the historical BTC cycle cadence.
This is not financial advice, and presented merely as conjectural musing.
Low High High pivot called 2017 TopFib time of Low High High pivot called the 2017 top to the EXACT DAY. I have similar fib time that predicted our local BTC top to the exact day. Keep in mind that the pivots are based off of the respective current cycles starting from the low that was put in at the previous bear cycle. These fib times were not taking from just the higher time frames such as monthly or weekly but from the EXACT day the pivot was put in. I’ll share the current fib time in my next post.

Bitcoin Setting Up a Bullish Megaphone Toward $160KBTCUSDT has completed its previous falling wedge pattern, fully reaching its projected target.
Price is now consolidating within a developing bullish megaphone structure, suggesting continued expansion and volatility.
If structure holds, the next projected upside target points toward the $160K zone over the medium term.
Meanwhile, there’s a CME gap around the $110K level, which could attract a sharp move toward that zone aligning with our buy-back region. If price revisits this area, it could present a strong buying opportunity before the next major upside leg.
Share your thoughts in the comments don’t forget to like and share if you find this analysis helpful.
Drop your altcoins below, and I’ll review and analyze them for you!

BTCUSD - Spring Loading (Wyckoff Accumulation in Progress)The current BTC structure resembles a classic Wyckoff accumulation phase.
After the Selling Climax (SC) and Automatic Rally (AR), the market forms a sequence of Secondary Tests (ST), showing absorption.
A final Spring could complete the structure before the SOS → LPS → Markup sequence unfolds.
In FRL terms, the AR level represents the neckline = start of the last impulse, confirming structural symmetry between Wyckoff and FRL logic.

4 year cycles for NoobsSo far the 4 Year Cycle is intact.
If the FED cuts rates today, which means QE begins, ALTs will rally. But if FED gives a hint that QE only begins in Jan 2026, the next BTC rally may be the LAST & FINAL rotation.

Alt Coin SeasonAlt season has not started yet. Probably it is about to start.
The red lines mark important 2021 support levels for BTC dominance (Blue line).
Purple line is the alt coin dominance.
Black line is the BTC price in USD.
It would be easy to jump to the conclusion that ALT coin season is starting, upon this chart, because the critical support level on BTC Dominance, from 2021, has been broken. Nevertheless a warning:
Warning: Alt coin season truly depends on BTC price going up. If BTC price drops marking the end of the cycle, so it is for Alt coins too. It would be over. Therefore, one must keep a careful eye on BTC/USD price action, to ensure not to fall into a bull trap!
FED cut rates impact: I expect Sept. 17th, to be bearish on the FED cutting rates, for a short time. This would be a "Buy the rumors, sell the news" type of event. I think, but I may be wrong of course.
However, in the middle term (Oct-December) it wold mark the last bull run of this cycle, for everyone, alts and BTC, hopefully.
Disclaimer: this is not a financial advice. Do your own research. I own several cryptocurrencies and this idea and plot represents only my mere opinion. I hold no responsibilities for misinterpretations from this material.

$NEAR short setupJust one more before the drop. 4:1. I dont really like trading lower caps because of volatility but this one, if we get the entry, might be a good one!

BITCOIN to 160kAccording to the 2 parallel long-term trend-lines , there is a chance the top one at 160k work as resistance again like 2024

ETH Daily Technical Overview — Cycle & Box AnalysisCycle Structure:
HWC (Higher Wave Cycle – Long-Term): Bullish 🔼
MWC (Middle Wave Cycle – Mid-Term): Range 🔁
LWC (Lower Wave Cycle – Short-Term): Bearish 🔽
Market Context:
The first step is to assess the market from a cycle and wave perspective 🧐. Recent sharp down moves are ignored as they are emotional reactions.
The current support is a box 📦 that has been tested for around 35 days with four significant touches. My bias is long here 🚀.
Long Setup:
Weakness in the short-term MWC 🔁 could trigger a bullish move if 4232 resistance is broken and confirmed ✅.
The next resistance at 4757 🚧 could turn all cycles bullish 🔼🔼🔼 if broken, offering strong upside potential 📈.
Short Consideration:
The market is unpredictable ⚠️, so short scenarios should be considered too.
Until price reaches 3708 ⬇️, I won’t consider shorts ❌.
Shorts require more structure and confirmation.
Remember, downside moves are still possible ⚡, so risk management is key 🛡️.
📌 Signature:
If you want a specific coin analyzed, drop a comment 💬👇 and I’ll cover it.
⚠️ Without proper risk management, you're just a ticking time bomb 💣

Gold 4H — Bearish Control With FVG Above
Gold continues to trade under bearish structural dominance, currently ranging between 4,161.535 (local supply) and 4,004.280 (structural support).
The market remains in compression, forming a potential redistribution range within a broader downtrend.
If price breaks below 4,004.280, it confirms a bearish BOS, opening the path toward the 4H Demand Zone (3,960–3,944) — where a reaction or further continuation could occur.
Above, two unmitigated Fair Value Gaps (FVGs) remain at 4,240–4,320, serving as potential retracement targets if the market shows a corrective pullback after internal CHoCH.
However, as long as 4,161 holds as resistance, bearish dominance stays intact.
Range → Break → Mitigation → Continuation → Expansion.
Until structure shifts, rallies are just liquidity grabs.
Technical Outlook Summary:
Dominant Bias: Bearish
Range: 4,161 – 4,004
FVGs Above: 4,240–4,320
Demand Zone: 3,960–3,944
Break Below 4,004: Bearish continuation
Break Above 4,161: Temporary retracement, not reversal
NFA | AI generated | Educational Purpose Only
OANDA:XAUUSD FXOPEN:XAUUSD

EurUSD 100% Fibonnacci MoveHi Traders,
Todays EURUSD trade
Entry 1.16350
Profit Target 1.17700
Stop Loss 1.15800
