ETHUSD: Where Price Could Go?4h tf
ETHUSD has bounced back strongly from around $3,826 after completing an A-B-C wave pattern. Right now, the price is testing resistance near $4,756. It could drop a little to around $4,440 before moving higher again. If the uptrend continues, the next target levels are $4,955, $5,300, and $5,500.
Stay tuned!
Thank you,
@Money_Dictators
Elliottwaveforecasts

NQ TradesB wave is in. Currently within 1st minutte wave of the intermediate C wave down, of the current 4th wave. Entry of the 382 retracement of the most recent 3rd wave, SL coveres upto 618. Looking for just 161.8% trend based fib of the 1-2 waves. Effectively predicting the terminus of the 3rd wave, we then allow a 4th to occur, then 5 to complete the first wave down of the C wave. Bosch.

TSLA – Watching for Wave 3 Extension Toward 455–460 Zone Tesla (TSLA) is completing a contracting triangle (ABCDE) as wave (iv), setting up for a potential wave (v) of 3. With delivery numbers scheduled for Thursday, momentum could build into the report, creating a rally toward the 455–460 zone, which also aligns with channel resistance and the 1.618 extension. This would complete a ABCD harmonic pattern.

EURUSD last leg of ending diagonalWe're observing the last leg of a leading diagonal wave 5 of $FX:EURUSD. Waiting for a strong movement of USD after that.

Nifty 50: Genuine Rally or Selloff Setup?The Nifty 50 Index went up, but this upward move was likely just a temporary correction, not the start of a new, long-term rise.
Bottom (Wave W): The index first hit a low around 24,377
Bounce (Wave X): It then went up to a high near 25,448. This rise was a clear, three-part corrective move (like an ABC pattern) that stayed inside a rising channel .
Clue: Because the move from the bottom (W) to the peak (X) was corrective, it suggests the overall trend is still bearish (downward).
Points to look at:
1. Reversal: The index is currently around 24,836 and is starting to turn down from the top of that rising channel. This suggests the temporary rise is over.
2. Projected Drop (Wave Y): The main prediction is a significant drop (Wave Y) that will likely break the previous low of 24,377 .
3. Target: This decline is expected to head toward the lower blue trendline on the chart, completing a larger WXY corrective pattern.
4. Projection: Ending point of wave (Y) can act as the ride for the new impulse cycle.
5. Bearish Stance: Traders should be cautiously bearish (expecting the price to fall).
6. Price action perspective: Previous swing is bearish, better to look at short positions for safe entry.
7. Selling Opportunities: Any small upward movements (retracements) are seen as good selling opportunities (betting on the price going down), as long as the price doesn't break above the recent highs or the channel ceiling.24,300 is indeed a strong demand zone.
Stay tuned!
Money Dictators :)

AUDJPY - Impulse wave underway?• Following a 3-wave corrective decline from July 2024 to April 2025, I’ve identified what appears to be a 5-wave impulsive move to the upside. There are multiple ways to count this structure, but treating wave (iv) as a running flat gives the most balanced outcome from both a Fibonacci retracement and extension perspective.
• From a higher-degree view, I believe Wave 1 and Wave 2 of a larger impulsive sequence are now complete, and we may currently be in Wave 1 of Wave 3 which is a high-probability rally zone.
• I entered the trade at 97.40 on Monday, 8th September, following a breakout above recent swing highs. Since then, price may have completed a Wave 2 retracement, and my stop loss remains at 96.30; the start of the current Wave 1 leg so the trade thesis is still valid.
• Key risk to this setup is upcoming inflation data, which could influence the Fed’s interest rate decision and impact global risk sentiment (AUDJPY being a risk-sensitive pair).
• View Daily Count for Broader Context -

1H Chart Outlook on MP Materials Corp.On this 1H Chart outlook of NYSE:MP MP Materials, im still looking for the wave v in green to play out. but the outlook puts forward a couple of different paths. The orange zone holds and this marks the completion of wave (ii) in orange and price heads higher in wave (iii). Alternatively price could tag the 'Alternate Outlook Structural Level' at $61.41, before a potential reversal to make the wave V. We will soon find out which path it takes.
Recent position taken is shown on the chart.

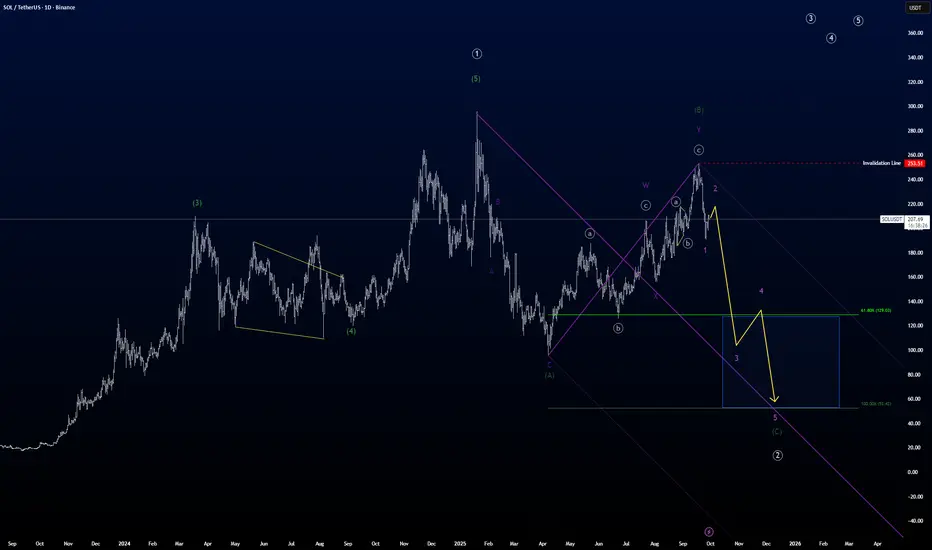
SOL is messy but is going through a correction.SOLs last move up in white primary ((1)) was not as large compared to the move up prior to that, which we can't see on the picture. So I guess we still have a large 3rd of a 3rd to come in a move up.
But first we still need to finish this correction SOL is in right now.
I believe SOL is doing a flat correction in a primary degree, so it takes some time to get through.
It looks like the green (B) wave is finally done, and now we just need the green intermediate (C) to finish. The 1st wave of that c-wave is almost over if not already, so anticipate a correction up in purple 2nd wave.
When that 2nd wave is done, SOL will move into a strong move down in wave purple 3 following the yellow path.
double (()) indicates circle on chart.
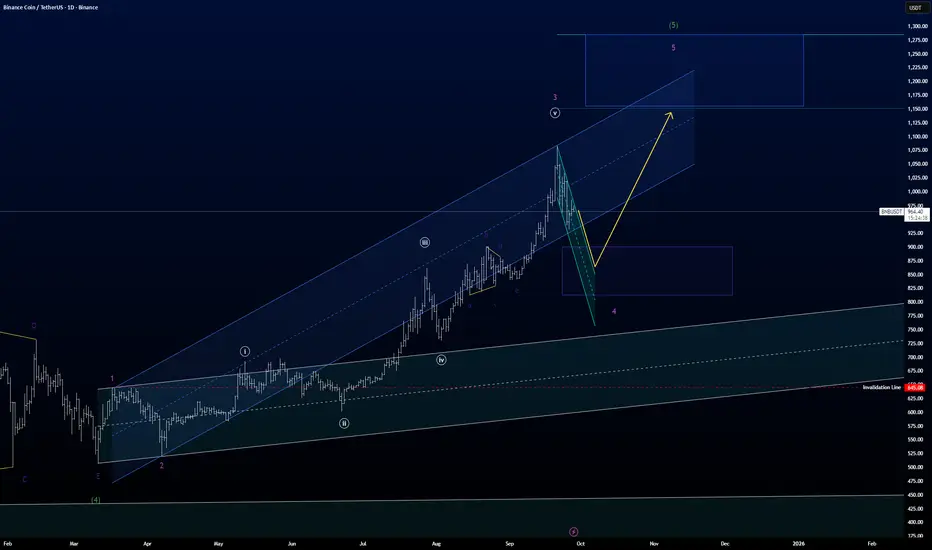
BNB does not completely obey, what BTC commands..In a count I did yesterday I wrote about BTC has started the decent, but from what I can see here, I still believe BNB need a little push up before going into a correction of a higher degree.
Right now BNB is in what I count to be purple wave 4.
And there is a chance purple wave 4 has already finished, and we therefor have started the move up in purple wave 5.
One of the guidelines in Kennedy channeling technique, which is a powerful tool in counting Elliott Waves, is that price has not completed wave 4 before tagging the bottom of the acceleration channel. (the blue channel).
Another guideline in Elliott Wave is that wave 4 often retraces down into wave 4 of the previous lower degree. (This area I have marked in the Purple box)
Therefor we could have a little downside left before starting the purple wave 5.
Being optimistic purple wave 4 is done, since I can count an simple zig-zig correction.
A confirmation of wave 4 is done and the purple wave 5 has started, is to wait for price to break the deceleration channel. (the green channel.)
But in either case, I believe BNB still has a wave 5 to finish before the correction down in a higher degree.
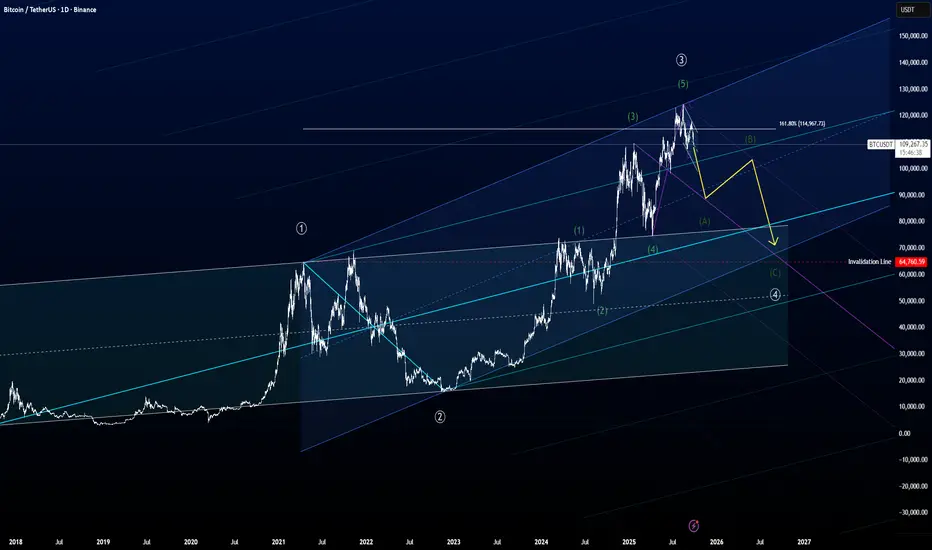
BTC has started going down the slope..I can easy count 5 green intermediate waves up.
Last top was just above the 161,8% fib level of primary white ((1)).
It's outside of the pitchfork, it's outside of the white base channel indicating the primary white 3 was underway.
By having a good 5 wave structure in the last wave up, I believe this is the intermediate green 5 wave done, and hereby primary white 4 has started.
How low can it go? By a rule from Elliott, wave 4 cannot enter the territory of wave 1, so this would mean the absolut low of wave 4 would be at the 64,760 level.
After we had, what I counted as a primary white wave 2 formed as a flat, it will be fair to presume we will have a relative quick primary white wave 4, because of the guideline of alternation. Also as a guideline we can lean to a Kennedy Channeling Technique, which states that wave 4 is usually not done before touching the bottom of the acceleration channel, which I have colored in blue.
The simplest path of wave 4 would be a zig-zag, which I have drawn in yellow. And I anticipate the first wave down, intermediate green A, not to end before around $90.000, then we will have a intermediate green B, then intermediate green C.
A choice could very well be that it will form as a triangle, because so many still believe the surge of BTC never stops. But still my anticipation of intermediate green wave A will be around the $90.000 level.
This is the most optimistic count I feel I could do on BTC. Another, but not as likely, count could be that we already have seen the wave 5, and then there is no absolute bottom other than 0.
Because this would mean we have seen the top of wave 1 of a higher degree, and wave 2 can retrace all the way back to the start of wave 1 without invalidating anything.
But this pessimistic count is not my preferred count at the moment.
Daily Outlook On YCA Yellow Cake PLCThis is my Daily time frame outlook on LSE:YCA . In the weekly view I posted recently I was looking for a breakout of the consolidation in wave 3, so far this looks to be playing out. I'm again looking for a continuation higher. I did add to my position shortly after posting the weekly outlook, declared on X but forgot to mention here, entry is shown on the chart. Spot uranium looks to be moving higher, potentially in a wave 3, and again in line with my outlook. So as mentioned on the chart comments, the levels of the impulse could get stretched if spot really gets moving.

Equinox Gold 4H Chart Outlook Bullish ImpulseHere is my current take on AMEX:EQX Equinox Gold Corp. The 4H chart shows an unfolding bullish impulse. I hold this stock and have added to this position numerous times as shown on the chart. As the outlook suggest we could see a pull back in green wave iv at some point, which could provide another potential point to add to the allocation once it has played out. It's correlation to gold hasn't been very strong recently, but that can always change, I'm of the opinion that gold is overdue a pull back, I have linked one potential outlook on OANDA:XAUUSD , I have some other variations which I will work to post out soon. so keeping a close eye on Gold at these levels. More comments on the chart.

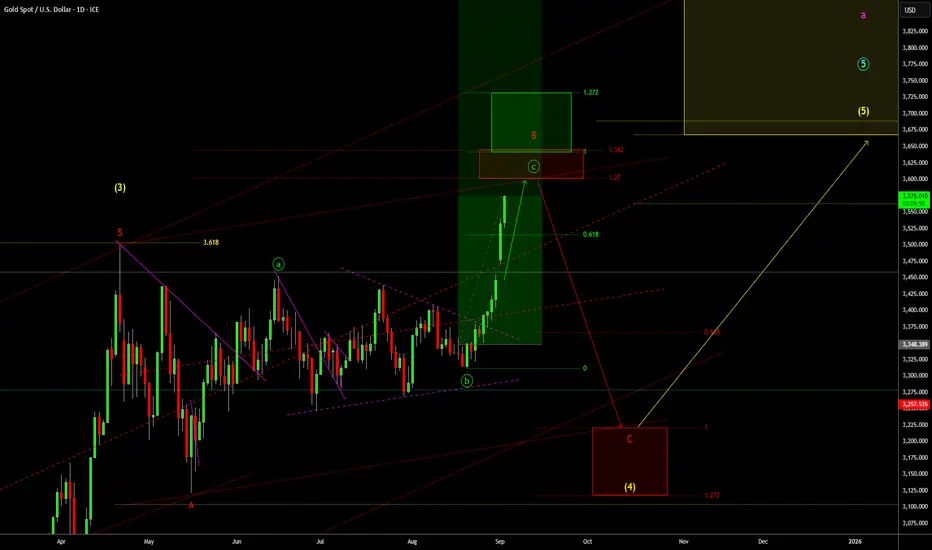
Anticipation of GC / Gold over the next couple of weeks.For those who might have interest in a Elliott reading on gold:
In this post, everytime I write gold, I mean GC. This is just for info, since GC and gold doesn't have same prices, but the movement is very much the same.
If you follow along on a gold spot or similar, just translate the levels to there.
The picture is very messy for those who doesn't know what the lines and numbers are for, but please follow along.
I have a strong believe that with current PA the 3rd (white iii) wave is over, and now we will look for price to search for the bottom of the blue channel.
The blue channel is an acceleration channel, which is used to see if 4th (white iv) wave is under way. When the 4th (white iv) has developed some more, we are able to put another channel on, called the deceleration channel. This we will use to spot the end of the 4th (white iv).
Until now, it seems gold is respect the white 161 fib level, which is a very typical 3rd wave level to end.
The reason I started this post, was to tell you about my thoughts on when the 4th (white iv) is going to end, or at least how long it's going to be.
A typical scenario is that wave 4 is longer in duration than wave 2. For ease of spotting, I have put up these purple boxes, so now we do not anticipate gold to end the correction, before it has exited the purple box to the right.
The depth of wave 4 (white iv): I believe we are going to see prices in the level between 3600 and 3550 (the green box).
Reasons for the levels of the green box: when prices wave 2 (white ii) goes beyound the 61.8 fib level (in this case below), we tend to see a retracement between 38% and 50% in the 4th (white iv). And this is the area the green box indicates.
Timewise it is places outside of the previously mentioned purple box.
4th wave also tends to respect the base channel . Either the upper line or the middle line.
The lower line of the blue channel and the middle of the grey channel ( base channel ), the green box, outside of the purple box is all seeming to fall in the same place. So I like all the confluences falling together here, so that's why I feel pretty certain that, that is where the white iv wave is likely to end.
Timewise it'll be about 1st of october.
The white v wave i have also done a forecast on that fits if wave white iv retrace to the green box.
Normally the 5th wave is going to end in the area between 38% and 61% of the wave 1 and 3. This level is indicated with the blue fib.
Usually wave 5 is equal to wave 3. But can be extended if wave three isn't. Have indicated the 100% fib of white i wave with the cyan fib.
This 100% level falls between the blue fib, right around the yellow line I have talked a lot about before in previous post. So I also have a lot of confluences for price to go here in the white v wave.
If the white v is extended it could go to the blue 100% level, which also is confluenced with that cyan upgoing line. This is a pitchfork drawn from previous waves.
let's see where gold will take us.

Gold Daily Short Term Outlook - Running Flat CorrectionI will more than happy for TVC:GOLD to blow past this typical running flat correction zone between 3600-3643 and head higher. However if it stalls at this zone and reverses then this is one possibility of how the wave (4) correction could to play out, one that ill be watching closely.
CRYPTO: ETHERIUM (H1)CRYPTO:ETHUSD
Wave Count:
- The larger impulse (labeled (1) → (5)) appears complete, with the top marked at wave (5).
- Current structure is unfolding as a corrective pattern following the top.
- Subwaves labeled (a) or (1), B, and C suggest that the market is now in a decisive corrective phase.
There are two potential corrective scenarios being tracked:
1. Expanded Flat / Running Flat correction.
2. Impulse move down unfolding as wave (3).
Targets:
Upside (retracement / correction before continuation):
- 4,400 – 4,600 USD (Expanded Flat target zone).
- 4,961.2 USD is marked as the Recent Count Invalidation level – any move above here would invalidate the current bearish count.
Downside (continuation of correction / start of larger wave (3)):
- 3,573.0 USD – first bearish target (wave (c) or (3)).
- 3,362.7 USD – extended bearish target if downside momentum accelerates.

Cable: Texbtook Elliott Wave pattern is pointing higherCable stabilized at the 1.3350 area as expected, from where we’ve seen a nice intraday rebound that could even be a small impulse, signaling continuation within the uptrend. This fits the textbook Elliott Wave 8-wave pattern, with five waves up from the August lows followed by an A-B-C, 3-leg setback. Such a structure suggests bulls are yet to lift the price toward and beyond the 1.36 area, though we may have to wait for tomorrow’s NFP release, which could be the key catalyst for markets this week.
GH

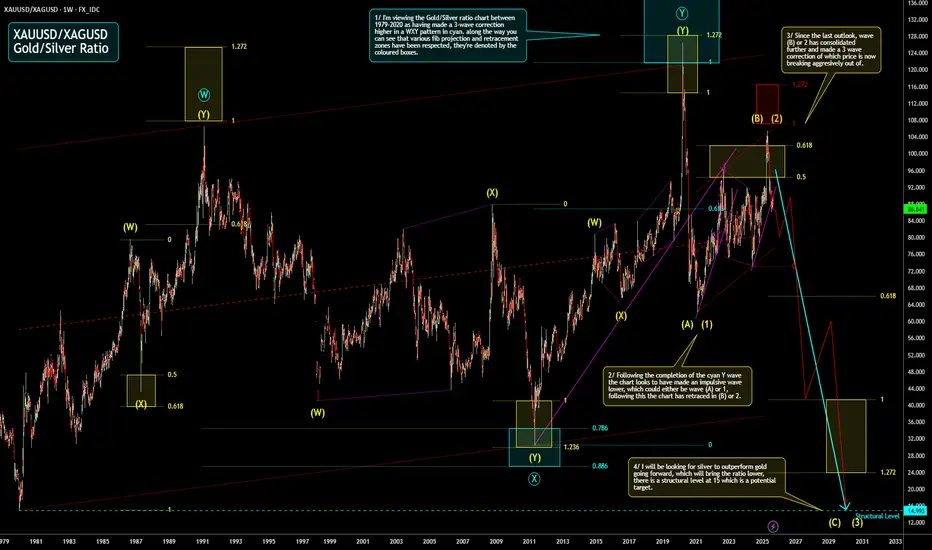
Gold/Silver Ratio Weekly Outlook Here is my weekly outlook on the TVC:GOLD TVC:SILVER ratio. I'm expecting the ratio chart to continue to drop which will mean silver will continue to outperform Gold. I have highlighted a structural level at 15 which is a potential target.
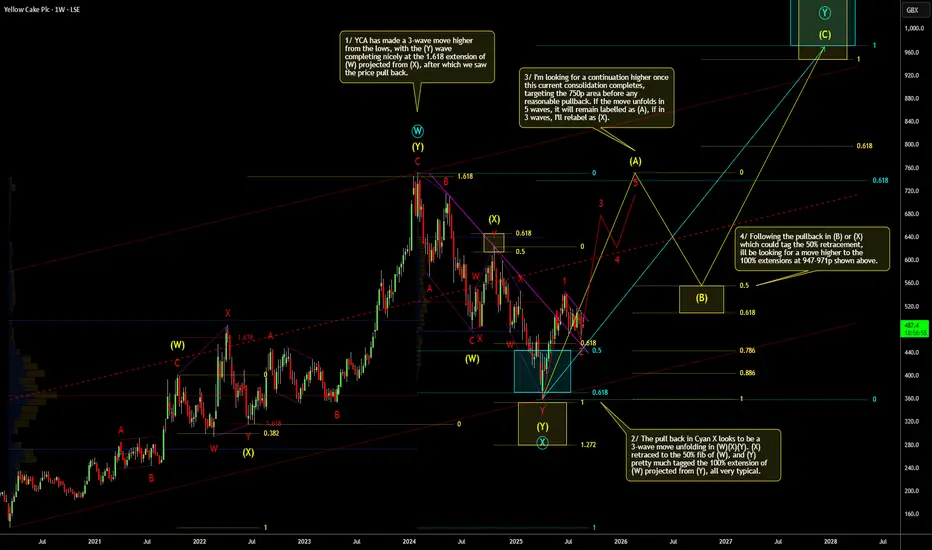
Weekly Outlook On YCA Yellow Cake PLCThis is my outlook on LSE:YCA I'm expecting a continuation higher once this consolidation breaks. Already have a decent position in YCA, but may add some more around these levels. More comments on the chart.
GOLD(XAU/USD): 27 AUG, 2025 Conclusion: Medium term, gold may be moving higher.
Key Points: Gold is set to move much higher, after completing the Triangle pattern.
On the other hand, the other wave count scenario for wave 4)) has ended, and we are moving higher.
No difference, just whether the uptrend is permanent or needs a little more time.
A move above 3,409.040 will trigger wave count #2, and eliminate wave count #1. While price must remain above 3,312.195 to keep both views valid.

ASX STOCKS SCAN: PLS - 27 AUG, 2025 - BULLISH POTENTIALConclusion: Wave v))green may be moving higher.
Key Points: Wave v))green is extended and subdivides into waves i,ii,iii)purple. Wave iii)purple may now be moving higher, targeting the nearest target at the high of 3.12. While price must remain above 2.07 to maintain this view.
Invalidation Point: 2.07

ASX STOCKS SCAN: S32 - 27 AUG, 2025 - BULLISH POTENTIALConclusion: Wave 3-red may be moving higher.
Key Points: Wave 2-red may have ended as a complex corrective wave, and since 2.84 wave 3-red may be unfolding to move higher. Target a high of 3.59 or higher. While price should remain above 2.84 to keep the weight and confidence for the bullish market view.
Invalidation Point: 2.47

ASX STOCKS SCAN: MIN - 27 AUG, 2025 - BULLISH POTENTIALConclusion: Wave 5-red may be moving higher.
Key Points: Wave 5-red may be extending and subdividing into waves i,ii,iii))green. And its wave iii))green may be moving higher, targeting 48.60 or higher. While price should remain above 34.81 to maintain confidence, the weight of this bullish view.
Invalidation Point: 27.45.

CRYPTO: LUMIA (1D)Following a request to do an analysis of CRYPTO:LUMIAUSD , here are my thoughts:
This chart is looking good for now. It is currently completing wave C of (2), a regular flat corrective variation. To confirm this idea, there should be a break a major trendline. To strengthen it more, a break of resistance will mean an uptrend with potential targets reaching 0.86.
If it doesn't turn out to be a regular flat variation, there is a target below to hit the resistance at around 0.234. This case would mean a potential completion of an inverse H&S pattern potentially hitting targets slightly lower than the plotted target (0.86).
Once this count gets invalidated (break the low of 0.194), there would be a need to reassess this outlook.
For now, these are the cases for me.
