Probable move of BitcoinAfter the drop, I can see a formation of new uptrend, if we pass 92 k region , we will have the target, other wise continue to down trend
Elliott Wave

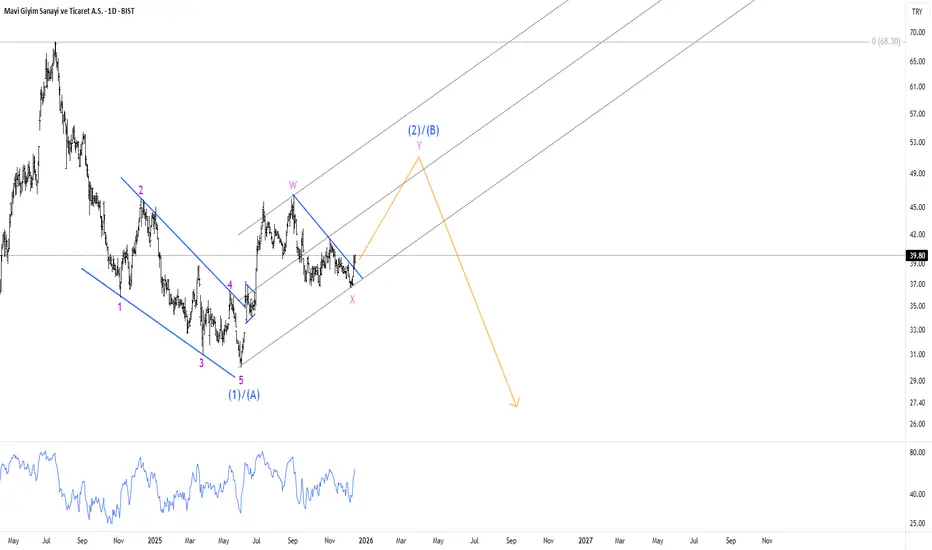
Mavi in a correctionmavi seems completed a diagnoal which may be Wave A or Wave 1 after the correction ends it should make new lows.

TSLA Impulse After Multi-Year Correction?Looks like Tesla completed a multi-year correction at $215 in the form of a Running Flat.
If so then the move from $215 to current price could be wave 1 of 3 that could eventually end up around the $900 level.

BTCUSD bullish analysisTechnical analysis for BTCUSD.
This Elliott Wave count has bottom completed at 80524.65, leading diagonal (1) complete, corrective wave (2) ongoing, 80524.65 needing to hold as support.
Big picture, BTCUSD looks to be in wave ((5)) of supercycle of its entire history.

GBPCAD: Bearish Momentum Building Up
▶️ GBP/CAD is struggling with the gray support zone around 1.83, but the trend is turning bearish.
▶️ RSI divergence is present on the daily chart, supporting a downside bias.
▶️ Wave structure suggests a strong leg down for wave 1/A, with current price action likely being a corrective 2/B.
▶️ A downside break is expected, with the first target at the 100% extension near 1.807, aligned with the next strong blue support zone.

CRK - Movement PotentialThe correction is continuing, and wave C has started to develop.
Wave C is expected to unfold as an impulsive move, pushing well below the end of wave A , while also being approximately equal in length to wave A.
Primary target: 10.3
Intermediate target: 17.1
---
Please subscribe and leave a comment.
You’ll get new information faster than anyone else.
---

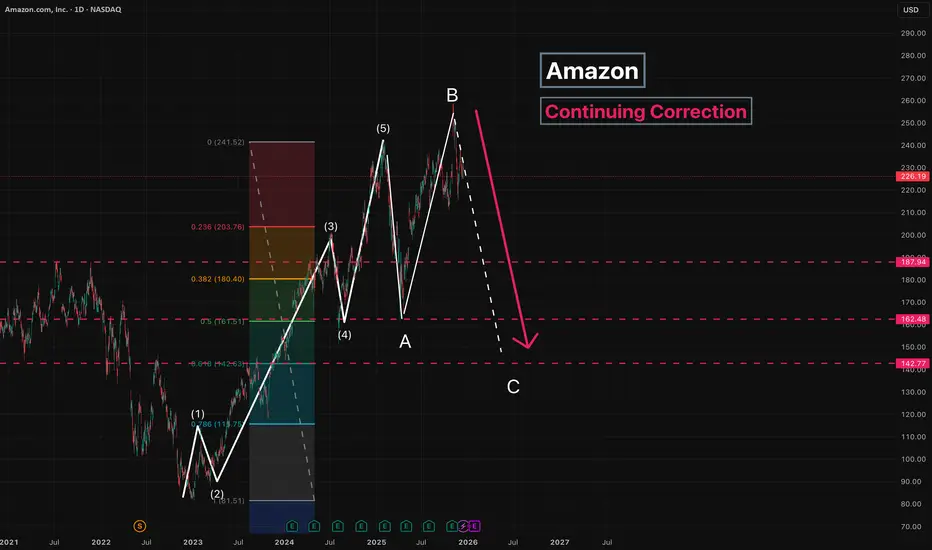
Amazon - Continuing CorrectionThe correction is ongoing, and wave C has started to form.
Since wave B is longer than wave A , wave C is expected to move below the low of wave A .
Main target: 142
Intermediate target: 187
---
Please subscribe and leave a comment.
You’ll get new information faster than anyone else.
---
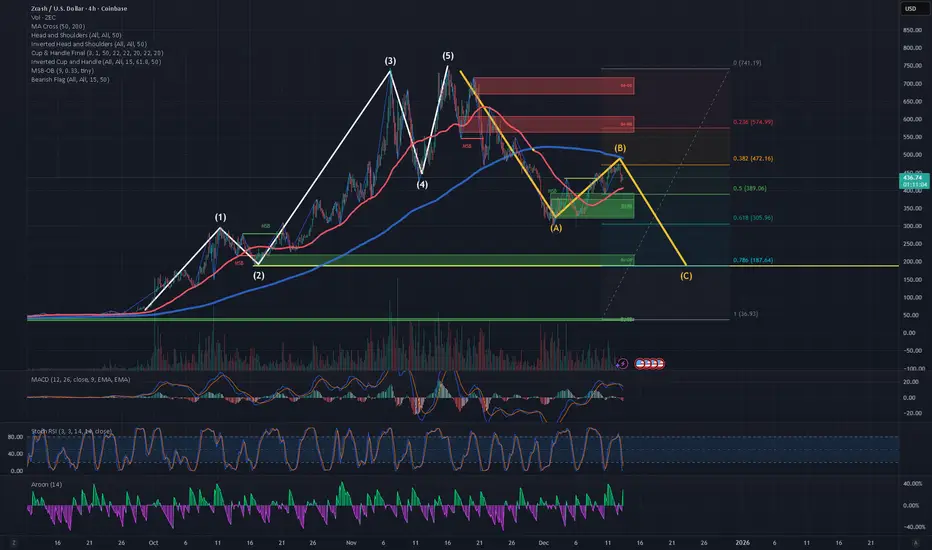
ZEC starting wave C of correctionOn the four-hour time frame, the Aroon indicator is positive and showing green because of the recent strong upward price movement. The Aroon is reflecting the impulsive advance that occurred between December 1st and December 12th, which I am interpreting as Wave B.
Prior to this, there was a clear five-wave impulsive move upward, and price now appears to be in a three-wave A–B–C corrective structure. I believe that Wave B of this corrective move is nearing completion, and that price is now beginning the decline associated with Wave C.
I believe the likelihood of further downard movement to fullfil wave C of the current three wave A-B-C structure is high, like 60 to70% based on the following reasons:
Four-hour and twelve-hour structure is corrective / weakening
Momentum (MACD) has rolled over
RSI is not resetting bullishly
Aroon suggests trend strength is fading, not expanding
Elliott interpretation of Wave B nearing completion is plausible
In theory, the chart says "down to $200", but the reality is that buyers have been very active, both humans and algorithims. It seems like any price below $400 is good buy for ZEC.
$200 represents a tail-risk scenario
$330 - 350 represents a behaviorally supported zone
In my view buyers will defend the $330 to 350 price point.
This analysis represents a probabilistic scenario rather than a guarantee, and invalidation would occur if price reclaims key resistance with expanding momentum.
This post is Not Financial Advice.
GOLD - Distribution phase. Target - ATH (4380), 4400...FX:XAUUSD is rallying after breaking through consolidation resistance. The fundamental background is positive, with the train heading for an all-time high.
Expectations of a soft Fed policy remain, with the market pricing in two rate cuts in 2026. India's pension fund regulator has allowed investments in gold and silver ETFs. An increase in US unemployment claims (+44,000) has heightened fears of a slowdown in the labor market.
A reversal in the Bank of Japan's policy (rate hike) and a pause by the ECB are boosting the appeal of gold.
Any correction is likely to be short-term and will be met with support from buyers. The baseline scenario remains bullish amid soft monetary policy and a weakening dollar.
Technically, it is dangerous to sell in the current market; it is worth looking for buying opportunities after corrections or pullbacks...
Resistance levels: 4325, 4335, 4380
Support levels: 4300, 4285, 4265
The rally phase is quite aggressive due to the long period of consolidation that the market has been in. All possible factors are supporting growth. In such a market, one can only buy on pullbacks. I expect a pullback from the indicated zone, within which growth to ATH can be considered.
Sincerely, R. Linda!

BITCOIN → Downward trend pressure. 86K - 84K?BINANCE:BTCUSDT.P sold off all the gains associated with Tuesday and Wednesday's news. Technically, a false breakout of resistance is forming against the backdrop of a downtrend. There is no fundamental support.
Bitcoin failed to consolidate above 91800 - 94200, a false breakout was formed, and the price returned to the range. There is an imbalance zone on the chart, which the price may test before falling (weak technical and fundamental background).
The trend is downward in the medium term. A countertrend correction is forming, within which the market is facing pressure in the 94K - 95K zone. Zone of interest is 91850. I expect a retest, liquidity capture, and another phase of selling down to 88K - 86K.
Resistance levels: 91850, 92500
Support levels: 89550, 87980, 86260
The price is in the trading range of 84K - 94K. Resistance has been tested, and a double top reversal pattern has formed. Currently, a distribution phase is forming relative to the specified pattern and consolidation at 91850 - 94200. A retest of the nearest resistance could trigger a rebound and cause the price to fall further to the next zone of interest.
Best regards, R. Linda!


AUD/NZD: Signs of a Pullback Ahead
▶️ AUD/NZD looks ready for a pullback after been climbing for a while.
▶️ RSI shows clear bearish divergence, which usually means weakness ahead.
▶️ Price is still inside the green ascending channel, so cautious traders might wait for a break.
▶️ That said, I’m expecting the channel to break soon.
▶️ First target is the strong 1.117 support zone, which acted as resistance all through 2024.

Coforge Limited 4th Wave Contracting TriangleCoforge Limited 4th Wave Contracting Triangle
The larger trend remains bullish, and the current structure fits well as a Wave 4 correction unfolding as a contracting triangle (A–B–C–D–E). Waves A, B, C, and D are already in place with clear overlaps and decreasing volatility, which is typical of a triangle in Wave 4. The ongoing dip looks like the final Wave E, holding above the rising support line, suggesting correction is nearing completion.
Once Wave E finishes, a decisive breakout above the triangle resistance should trigger Wave 5, which is usually sharp and impulsive, often carrying price beyond the previous Wave 3 high.
(Educational view only, not a trading recommendation.)

Gold Short: Ended Corrective Move upOver in this analysis, I point out 2 ways that the Gold Elliott waves can be plotted and I went through the breakdowns as well as 2 interesting Fibonacci extensions that both points to where the recent high of Gold ended.
The idea is invalidated at the recent high so stop should be placed above that.
Good luck!

MP shortDowntrend + Wedge (continuation pattern ), near resistance
Looks like Wave 12345 + Wave ABC
Stop 67,
Short entry 63
Target 45
Risk management is much more important than a good entry point.
I am not a PRO trader.
In my trading plan, the Max Risk of each short term trade should be less than 1% of an account.

ethereum enters into the "santa rally"gm!
ethereum just performed a very bullish move - way more bullish than whatever i was expecting.
it liquidated all of the longs this morning, with just a tiny fraction of them remaining at 3k.
this makes me believe that ethereum is gearing up for "the santa rally"
- santa rally is a mythical move in the market which causes assets to move up in price into the christmas holidays.
---
let's talk about the technicals as simply as possible.
i believe the low in december was a "truncated 5th" - aka "inorganic low"
everything after appears to be a leading diagonal. to put in wave (1).
wave (2)'s in elliott wave theory are usually very sharp,
which makes me think we are currently in a bullish 1-2.
---
if my theory is correct,
ethereum will tap the all time highs before december is over.
🎯 = 5k+

AAVE ANALYSIS (1D)Hello everyone.
Today I'm going to examine AAVE.
As you can see after a five upward impulsive wave, AAVE has faced a double Zig-Zag correction.
The reason why this pattern is a Double Zig-Zag is simply because the first A-B-C correction was not enough. Therefore another Zig-Zag correction was needed.
This kind of corrections only appears in the market when the main correction wave is not enough to balance the price according to the last impulsive wave.
There are two scenarios comes forward;
First: If it's a double Zig-Zag correction, there is always another possibility that this pattern could turn itself into a triple Zig-Zag. In this case, the mini wedge pattern you see on the chart will break the last low and create a way deeper correction. Target of a possible triple Zig-Zag is marked on the chart.
Bullish scenario: If the double Zig-Zag has ended which is what I'm seeing at the moment, the 4H ascending wedge you see on the chart will create a leading diagonal and a higher high, which will be seen as wave 2 for another five wave upward impulsive move. That's the opportunity you can't afford to miss.
Fortunately, the risk management comes very easy when Elliott patterns are clear.
If you're looking for a swing long position in here your stop-loss should be last low, just below the Wave Y. To make it better, wait for a daily candle close below it, so you won't be hunted for liquidity grabs.
Target of the possible wave 3 is marked on the chart as well.

Gold Alternative RoutesGold updated routes, elliot wave is not one constant but it is variety of possibilities and as we go along we update and eliminate some of the wrong tracks at the end what we get is the right entry and right exit.
So now for our search of next entry there is a buy trade with small stop loss here but the real wave we wanna catch is the big impulse correction so i will be looking into sell when it goes up.
short term targets 3280-3310-3330 mid term targets are down at 4080-3920-3850 and long ter target is at 4700+ i expect it to go above 4700 in next 6-9 months time.


Swing short for BTCAfter finishing a complex and tricky wave 4 yesterday, finally last night we entered the wave 1 and this setup will be my trading plan for a swing short.
Always DYOR !

AVGO: mid-term trend structure If price is to hold above 209-198 area of support, next resistance zones are: 287-303 and 320-330-360.
Macro trend structure also assumes higher targets for the uptrend since 2022 bottom (Monthly):
Thank you for your attention!
