XLMUSDT → End of correction. One step away from a rally BINANCE:XLMUSDT follows the flagship currency in forming a rally and breaking out of the correction. The trend is bullish, but news is ahead. Will the bulls be able to keep the price above the risk zone?
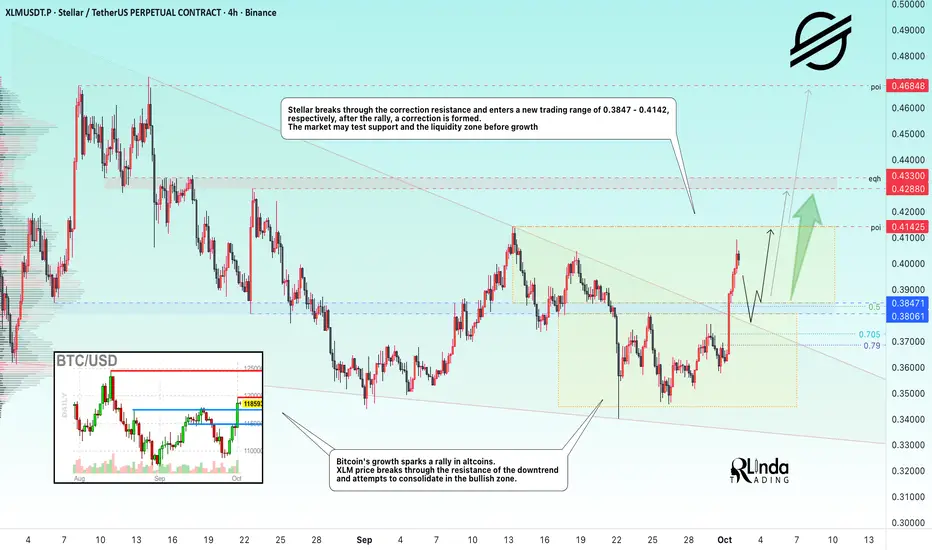
Bitcoin's growth is provoking a rally in altcoins. The price of XLM is breaking through the resistance of the downtrend and trying to consolidate in the bullish zone.
Stellar is breaking through the resistance of the correction and entering a new trading range of 0.3847 - 0.4142, respectively, after the rally, a correction is forming. The market may test support and the liquidity zone before rising.
Resistance levels: 0.4142, 0.4288, 0.433
Support levels: 0.3847, 0.3806
As part of the correction, I expect a retest of the 1/2 zone of the formed impulse or the support zone of 0.385 (previously broken consolidation and descending wedge border).
If the bulls keep the price from falling even after the news, the coin may continue its medium-term bullish run to 0.4685.
Best regards, R. Linda!
Elliott Wave
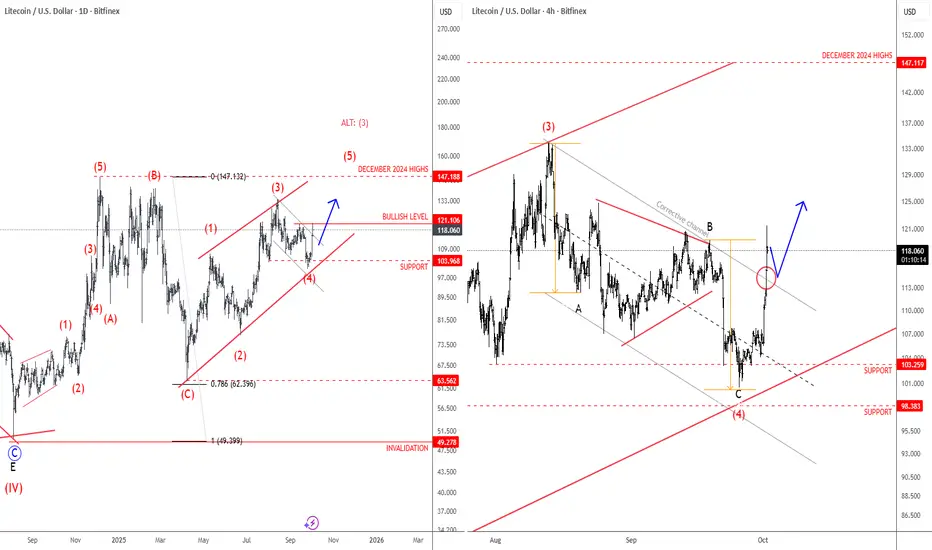
Litecoin Is Still Eyeing December 2024 HighsLitecoin turned lower recently, but we believe this is just another corrective retracement within a broader bullish trend, which has been showing higher swing lows since the rebound from the 78.6% Fibonacci level back in April. We expect that retracement down from the December highs will be fully retraced, meaning there’s room for a push up toward 147 as illustrated on a daily chart. It can be looking for wave (5) of a diagonal pattern, or alternatively, maybe even wave (3) if it extends decisively above upper diagonal line and goes for 200 area. In the 4-hour chart, we got a sharp rebound from projected support and back above channel resistance line after we noticed an ABC correction, so bulls are back, and we may easily see more gains toward December 2024 highs, just watch out for short-term pullbacks.
CoinbasePrice continued its advance today. This is a spot we should expect to see some type of reaction. Should being the keyword as it is not a requirement. The reaction I am referring to is either wave b of (c), wave 2 of (c), or wave c of (b). All three point lower. If you look at MACD, it appears to be resetting as of now too.
If you saw my trade alert today, then you know I sold my COIN. This is not due to a lack of confidence by any means. However, I thought it pertinent to lock in the profits on my scalp and wait for another consolidation lower for re-entry. If you recall my prior trade, I bought @ an average of $310 and sold right around $340-$350. Add that to the trade I closed today, and I have made around $2500 profit in only 2-3 weeks from Coinbase. This is all from the same minor B wave. Patience along with not being greedy is key. Sure, $2500 isn't a ton of money by any means. When repeated over and over again though and it adds up over time.
In short, I await a consolidation lower for re-entry. If price moves above $351.90, you know that (b) is extremely likely to be over. Fingers crossed for my sake we can start the consolidation I am expecting in the next day or two and give me another chance to hop in one more time before heading to the box.

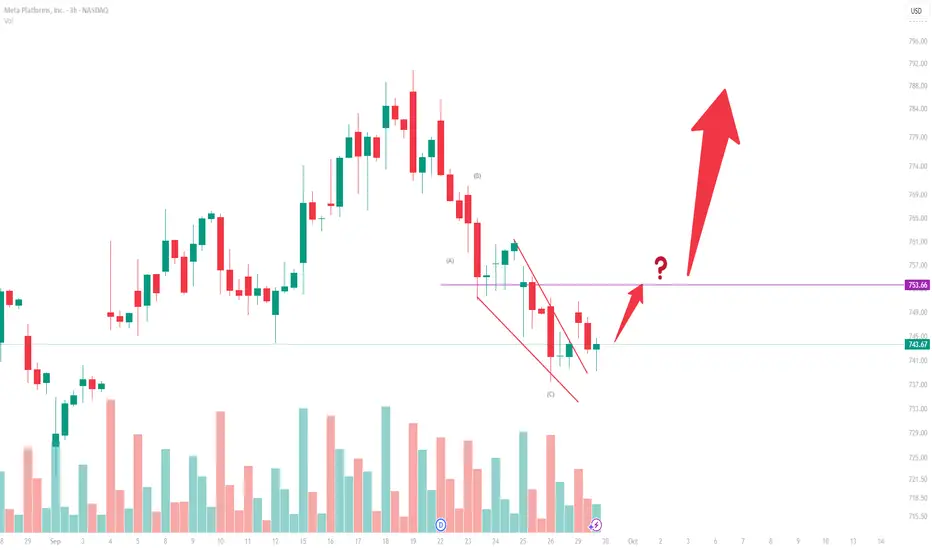
META (3H) — Elliott Wave AnalysisStructure
The chart displays a zigzag corrective pattern labeled (A) → (B) → (C).
Wave (C) unfolds inside a falling wedge (ending diagonal), a common terminal structure at the end of corrections.
The breakout attempt from this wedge suggests that Wave (C) may be complete.
Wave (A)
A sharp, impulsive decline in five subwaves.
Defines the start of the correction.
Wave (B)
A three-wave upward retracement.
Retraces roughly 0.38–0.50 of Wave (A), consistent with zigzag proportions.
Wave (C)
A five-wave structure contained within a converging wedge.
Subwave (v) shows diminishing momentum, typical of an ending diagonal.
The upward break through the wedge top signals the potential termination of Wave (C).
Key Level
753.66 is the critical resistance.
A confirmed move above 753.66 validates that the (A)–(B)–(C) correction has ended and a new impulsive sequence may be starting.
Failure to reclaim 753.66 leaves the risk that the bounce is only a temporary rally within a larger correction.
Alternate Scenario
A new low beneath the Wave (C) termination point would invalidate the completion view, implying the correction is extending.
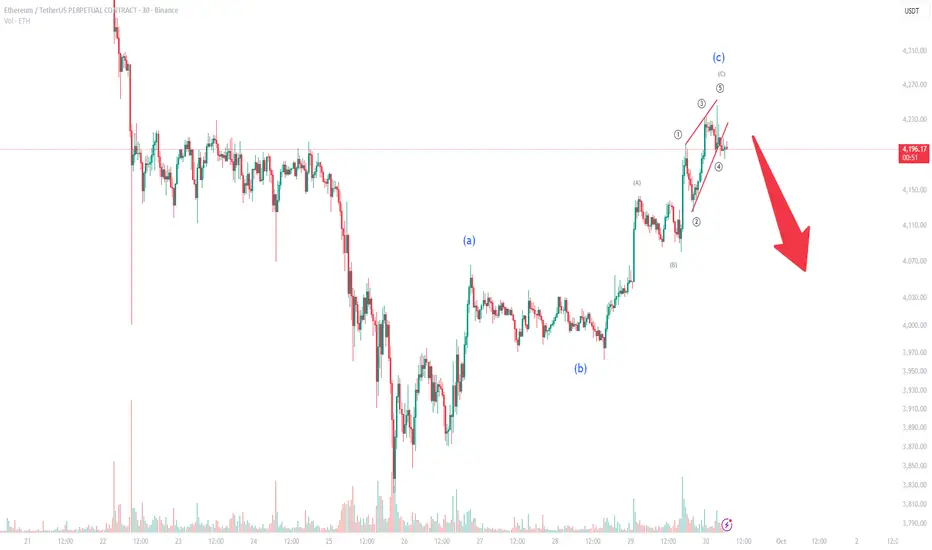
Ethereum Elliott Wave Update: Correction Ahead?Ethereum has recently completed the final leg of its ABC corrective structure, with the C-wave forming as a clear ending diagonal. This technical pattern often signals exhaustion in the current upward move and hints at a potential reversal.
With the structure now completed, a corrective move is likely. Current price action suggests that Ethereum could retrace toward the $4,000 support region, which aligns with both technical targets and key psychological levels.
📉 Trading Outlook:
Short-term traders should be cautious of potential downside volatility.
A corrective wave into the $4,000 zone may offer opportunities for repositioning or new entries depending on market reaction.
Risk management remains essential, as invalidation of the diagonal would occur if ETH pushes significantly higher without correction.
In summary, Ethereum’s Elliott Wave count points toward a possible short-term pullback before the broader trend becomes clearer. Traders should keep a close eye on the $4,000 level for signs of support and potential bullish re-engagement.
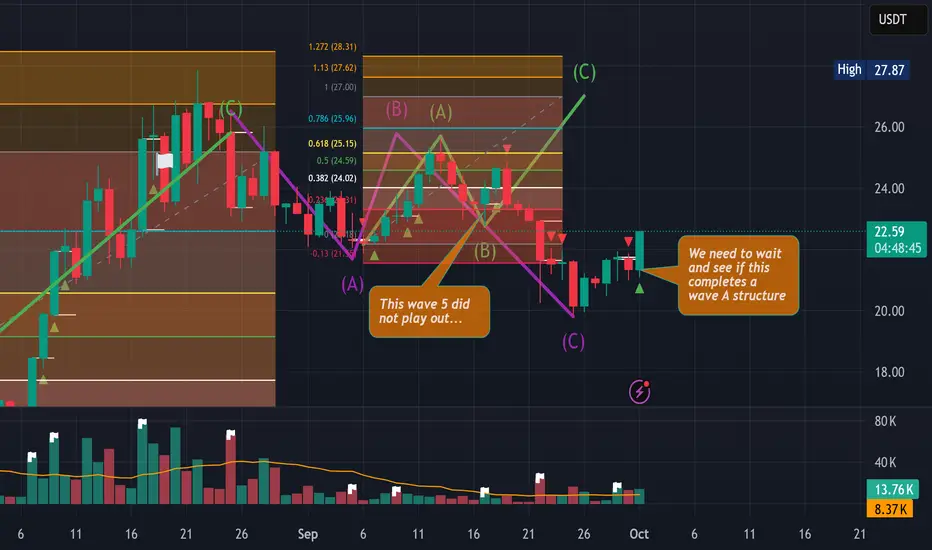
Watching for wave A structure on LinkOur target of $27 did not play out as I thought with an extended wave 5. I think too much hype and too many leveraged long positions caused a breakdown in the play but we look good if we stay moving in the next few days to see a move to the upside with the same target likely.
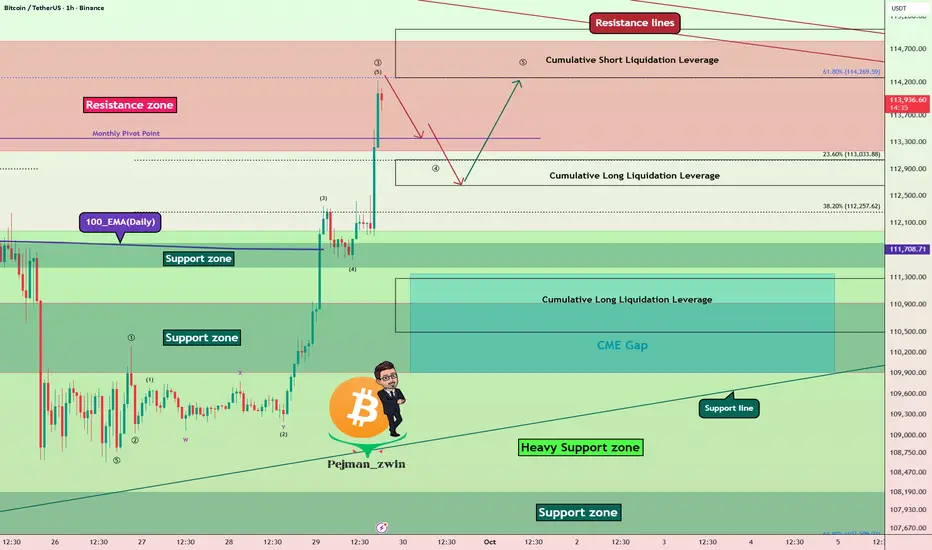
Bitcoin Resistance Zone Battle – ATH or Fakeout?Bitcoin ( BINANCE:BTCUSDT ) has shown strong momentum over the past 5 days , liquidating many traders in both Long and Short positions .
Bitcoin has now entered the Resistance zone($114,820-$113,170) and is moving near the Cumulative Short Liquidation Leverage($115,000-$114,272) and Resistance lines .
From an Elliott Wave Theory perspective, given Bitcoin’s strong bullish momentum over the past 24 hours, it appears to be completing Wave 3. This Wave 3 seems to be of the extended type.
I expect Bitcoin , after a correction , to make another attempt toward the Resistance zone($114,820-$113,170) and potentially test the Resistance lines .
Do you think this bullish move could lead to a new all-time high (ATH) for Bitcoin?
Cumulative Long Liquidation Leverage($113,037-$112,650) + Near Monthly Pivot Point($113,356): An area where Bitcoin could start rising again (if there is a correction, of course).
Cumulative Long Liquidation Leverage: $111,100-$110,500
CME Gap: $111,355-$109,915
Note: Also, Bitcoin approaching the 61.8% golden Fibonacci level could lead to a Bitcoin correction.
Please respect each other's ideas and express them politely if you agree or disagree.
Bitcoin Analysis (BTCUSDT), 1-hour time frame.
Be sure to follow the updated ideas.
Do not forget to put a Stop loss for your positions (For every position you want to open).
Please follow your strategy and updates; this is just my Idea, and I will gladly see your ideas in this post.
Please do not forget the ✅' like'✅ button 🙏😊 & Share it with your friends; thanks, and Trade safe.
USDJPY Elliott wave analysis 1/10 /2025I think that there will be wave 5 to to finish the cycle. The wave IV can be WXY so we have to aware the alternative count. The target is around 169$ - 180$.This derive from Irregular Flat and the resistace form 1978.After the 30 years correction is end, we expected the crash.The invalidation is that the price go below 115$.

EURUSD last leg of ending diagonalWe're observing the last leg of a leading diagonal wave 5 of $FX:EURUSD. Waiting for a strong movement of USD after that.

Amazon Can Stabilze Near $210Amazon has been pulling back lately, and I’ve been tracking this as a potential wave four flat correction, with wave A and wave B already completed and wave C now eyeing the support around 210. That zone also lines up with the 0.382 Fibonacci retracement and previous breakout levels, so it could attract buyers and provide stabilization. The retracement is quite deep at around 12 percent, but since the stock has not yet retested February highs, it looks more like a consolidation, a pause rather than a new bearish trend. I assume there is a chance for a nice bounce into wave five, still this year.
GH

USDJPY Testing 147.800 as US Govt Shutdown Pressures DollarHey Traders, in today’s trading session we are monitoring USDJPY for a potential selling opportunity around the 147.800 zone. USDJPY is trading in a downtrend and currently in a correction phase, with price approaching this key support/resistance level.
Structure: Market bias remains bearish after the recent trend shift, and the current pullback could set up continuation lower.
Key level in focus: 147.800 — acting as resistance within the correction.
Fundamentals: The US Government has officially entered a shutdown, a development that historically weighs on the US Dollar. This event adds to bearish USD pressure and could further favor downside in USDJPY.
Trade safe,
Joe.

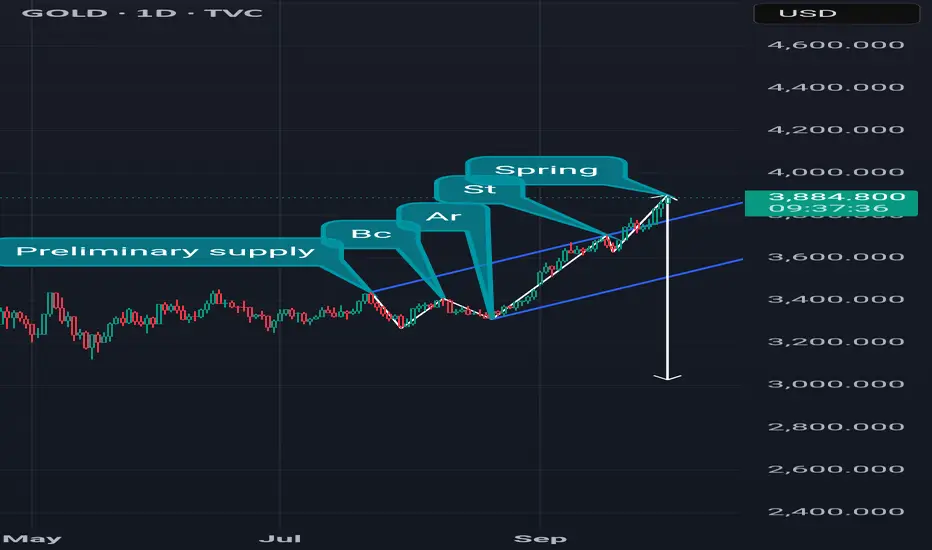
Wyckoff Distribution in gold?This count is based on my assumptions so anything can happen not a trading or financial advice just for educational purposes only kindly do your own ta thanks trade with care good luck.
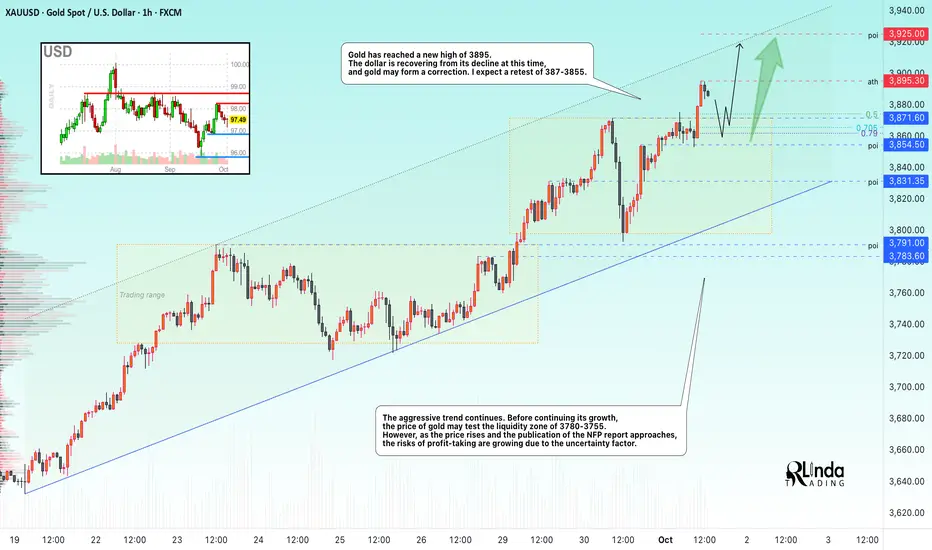
GOLD → Correction before growth and breakthrough of 3900...FX:XAUUSD has reached a new high of 3895. The dollar is recovering from its decline, and gold may form a correction. As prices rise, economic risks associated with NFP and the US government shutdown are increasing
The suspension of NFP publication deprives the Fed and markets of a key benchmark for the labor market, increasing demand for defensive assets. The probability of a rate cut in October is estimated at 100%. Mixed JOLTS data (weak hiring) and fiscal risks are weighing on the USD, which in turn supports gold.
Thus, the shutdown creates ideal conditions for gold to rise — uncertainty about Fed policy, a weaker dollar, and a flight to safety. Breaking through the $3900 level seems a likely scenario.
Resistance levels: 3900, 3925
Support levels: 3871, 3854, 3831
A correction is forming after a small rally in the European session. Before continuing its growth, the market is entering a correction/consolidation phase. I have indicated the key support levels on the chart. If the bulls manage to keep the price above these zones, then we can expect continued growth in the short and medium term
Best regards, R. Linda!
NZDCAD → A false breakthrough will trigger a decline FX:NZDCAD is forming a countertrend correction with the aim of retesting key resistance and the liquidity zone amid a global downtrend.
A reaction to the support zone is forming. The price is recovering, but within the global downtrend. The countertrend movement may end in the resistance zone of 0.811 - 0.8125
The global trend is downward, but we are seeing a rebound within the retest of the channel support. There is a fairly large pool of liquidity ahead, which is capable of stopping the price from rising at a high speed. A false breakout of 0.811 - 0.8125 could trigger a decline.
Resistance levels: 0.811 - 0.8125
Support levels: 0.8056, 0.8030
A false breakout, consolidation below the specified zone, and a price close below the level could trigger a further decline.
Best regards, R. Linda!

BTC/USDTI think wave 2 of C has completed, I will open a short position for wave 3 of C with this setup.

Gold (Rose ) and SPX ( Jack ) relationship. 1/Oct/25XAUUSD ( Rose ) and SPX ( Jack ) since dunno when they are in closed relationship on "Titanic Ship".. But.. That "shxx" is obviously tilting heavily into 1 side.untill early/mid Oct at 7000 and 4000 nautical And when.Jack and Rose probably have to perform "you jump I jump"..But after that they will "ride" different "ships"..Where one still on sinking ship , the other is riding into "Titanic" sky ship"...

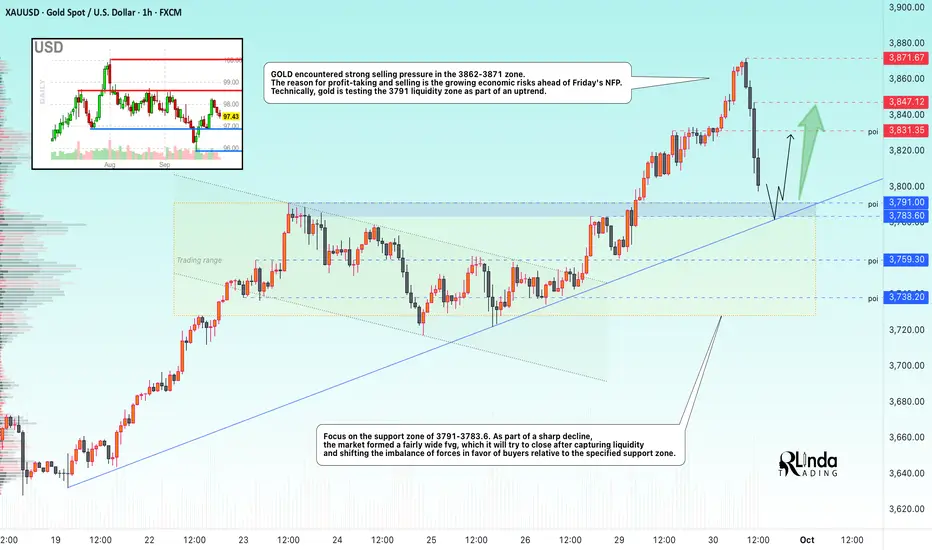
GOLD → Liquidation, but there is still a chance for growth...FX:XAUUSD has reached a new all-time high of 3871.6, marking its best month in 14 years (+12% in September). However, against the backdrop of high risks, the market is experiencing profit-taking and a deep correction. What next?
The high probability of a shutdown from October 1 is weighing on the dollar. The probability of a Fed rate cut in October is 90%, despite cautious comments from the Fed.
New tariffs on timber and furniture (from October 14).
Data from China: PMI growth (Manufacturing to 51.2). All this supports the bullish trend in gold. However, the end of the quarter, anticipation of NFP (but in the event of a shutdown, the publication of employment data will be suspended).
Technically, as part of the correction, the price is testing the upward support line, and the price reaction to the 3790-3780 zone will give hints about further movement...
Support levels: 3791, 3783
Resistance levels: 3831, 3847
A false breakdown and the formation of a reversal pattern relative to the specified support zone could trigger a recovery phase within the bullish trend. However, a quick return to support could trigger an attempt to break through and correct to 3759-3738.
Best regards, R. Linda!
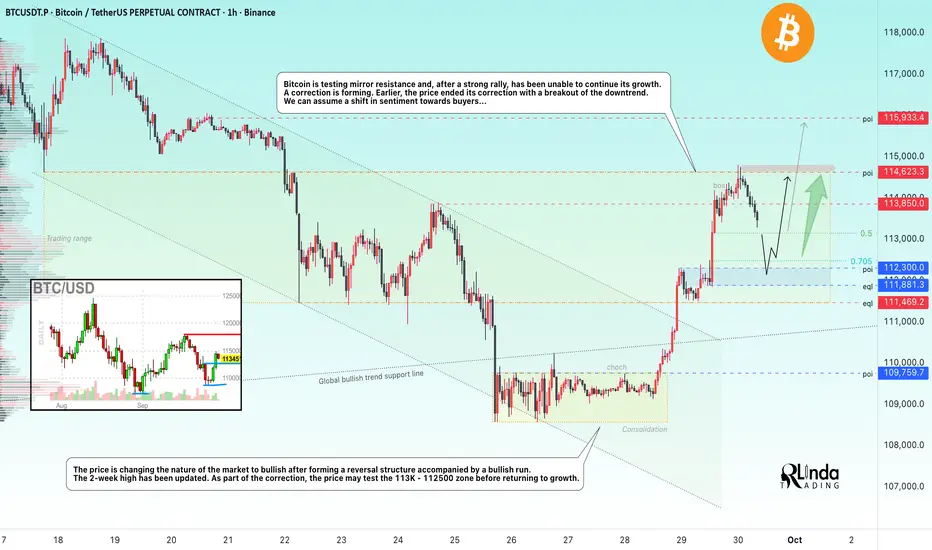
BITCOIN → Correction before the breakout of 114.5KBINANCE:BTCUSDT , after the end of the correction, is forming a 3.5% rally and testing the important milestone of 114,600. It was not possible to break through the level without consolidation and at such a high speed. How long will the correction last?
Bitcoin is testing mirror resistance and, after a strong rally, was unable to continue its growth. The reason for the halt is a huge liquidity pool above 114,600. A pullback is forming. Earlier, the price ended a 3-week correction by breaking through the downward resistance. We can assume a change in sentiment towards the buyer...
Technically, the price is changing the nature of the market to bullish after the formation of a reversal structure accompanied by a bullish run. The 2-week high has been updated.
Resistance levels: 113850, 114620, 115900
Support levels: 113100, 112300, 111800
As part of the correction, the price may test the 113K - 112500 zone before returning to growth. If the market holds the price above 112K - 113K, it will confirm the bullish sentiment, and the positive fundamental background will support further growth.
Best regards, R. Linda!
Wave 3 Breakout – Targeting 1.18600 w/Elliott Wave ConfirmationOverview
This idea is based on a completed Elliott Wave impulse sequence (1)-(5) followed by a corrective ABC structure, suggesting the start of a new bullish impulse wave, likely Wave (3) of a higher-degree cycle. The breakout above the H4 high and consolidation near the Daily High supports this bullish continuation.
Technical Breakdown
Wave Structure: The chart shows a full 5-wave impulse up, followed by an ABC correction. Price is now pushing above the corrective high, suggesting Wave (3) is underway.
Support Zones:
H4 Low: 1.1728
Daily Low: 1.17122
Weekly Low: 1.16456
Resistance Zones:
Weekly High: 1.18200
H1 High: 1.18600
The breakout above the H4 High and Daily High confirms bullish momentum. The wave count aligns with a textbook Elliott Wave setup, where Wave (3) is typically the strongest and longest.
Trade Setup
Entry Zone: Between 1.17450–1.17500, after breakout confirmation.
Stop Loss: Below 1.17220 (Daily Low), allowing room for volatility but protecting against invalidation of the wave count.
Take Profit 1: 1.18200 – aligns with minor resistance and a conservative Wave (3) projection.
Take Profit 2: 1.18600 – based on Fibonacci extension and upper range of the Weekly High zone.
This setup offers a risk-reward ratio of approximately 2.5:1, ideal for swing or short-term momentum traders.
Wave Theory Context
Wave (1): Initial breakout from base structure.
Wave (2): ABC correction, now complete.
Wave (3): Currently unfolding, expected to extend beyond TP2 if momentum continues.
Wave (4) and (5): To follow, but not yet visible.
Final Notes
Watch for a retest of the breakout zone (1.17450–1.17500) as a potential secondary entry.
If price fails to hold above 1.17220, consider the wave count invalidated and exit the trade.
Keep an eye on macroeconomic news that could impact EUR/USD volatility.

That's good.Looking at this story I tend to believe that the full cycle of growth and correction has been completed, which should in theory open the way for a new impulse wave one.
August just closed with a bullish indication (3s bull) and we have a second green candle in a row (Heikin Ashi). That said, the OTHERS itself is rather treading water for now.
But I tend to think that growth has already started and now triggers are needed. As I have said many times, Powell's statements (alas) are such a trigger. Although the crypto market should have sent the US monetary authorities to hell a long time ago.

1H Chart Outlook on MP Materials Corp.On this 1H Chart outlook of NYSE:MP MP Materials, im still looking for the wave v in green to play out. but the outlook puts forward a couple of different paths. The orange zone holds and this marks the completion of wave (ii) in orange and price heads higher in wave (iii). Alternatively price could tag the 'Alternate Outlook Structural Level' at $61.41, before a potential reversal to make the wave V. We will soon find out which path it takes.
Recent position taken is shown on the chart.

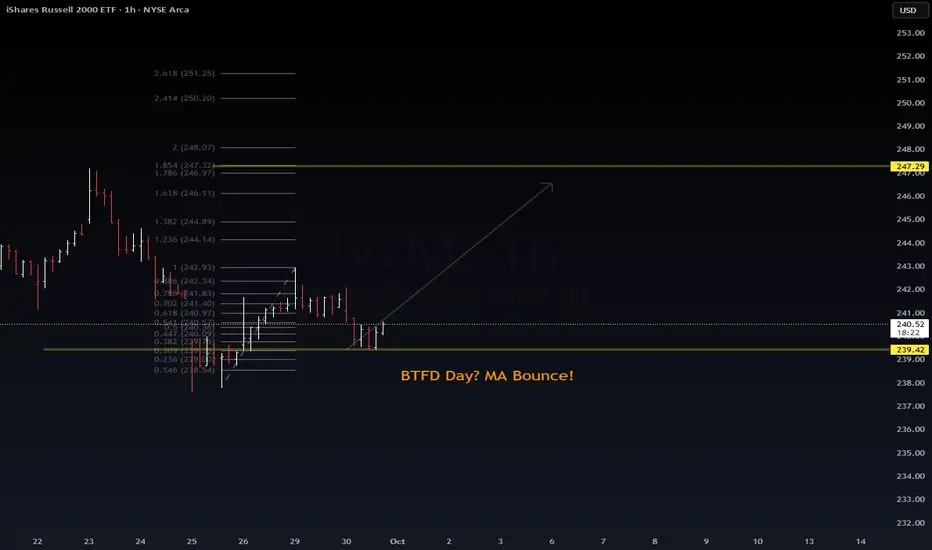
$IWM – Small Caps at Bounce Zone📊 AMEX:IWM – Small Caps at Bounce Zone
Chart Context:
AMEX:IWM pulled back into Fib 0.382–0.5 zone (~239–240).
Price found support exactly at 239.4 pivot → matching MA bounce on daily.
Intraday structure = higher lows forming → possible reversal leg.
🔑 Key Levels
Support: 239.4 (pivot) → 237.6 (strong demand).
Upside Targets:
242.9 (Fib 1.0)
244.9 (1.382)
247.3 (Fib 2.0 extension)
Invalidation: Break below 237.6 negates bullish setup → back toward 234–232.
📈 Trade Bias
Bias: BTFD / Bounce Play while above 239 support.
Scalp Targets → 242–244.
Swing Target → 247–248 if momentum extends.
Risk Management: Tight stops below 237.6.
🧩 Takeaway
AMEX:IWM showing resilience at Fib support. If small caps confirm this bounce, it could spark a broader risk-on move across equities. Watch 239 → 247 range closely.
#IWM #Russell2000 #SPY #Trading #VolanX
ETH Elliott wave analysis 1/10 /2025In my point of view , The wave (IV) is end and we are going to finish the wave (5).The new wave ①, which has surpassed the top of wave (4) with a strong impulse, indicates that the beginning of wave (V) has likely started. Wave (IV) appears to have formed a b-failure flat, where wave C slightly exceeded 132.8%. Based on the Butterfly harmonic pattern from the higher time frame ETH analysis, the target price is projected to be in the range of $5,900–$6,400.
An alternative count is that the recent abc structure may represent waves 1, 2, and 3, with the current correction being only a minor retracement. This scenario requires further observation. However, the overall Elliott Wave structure still suggests that one more upward wave is needed to complete wave (5).
