Corrective up for BitcoinHi traders,
Bitcoin moved exactly as I-ve predicted in my previous outlook.
After it finished the first downmove we saw the start of the next corrective upmove.
Now we could see the corrective upmove continue to the orange B area.
Let's see what the market does and react.
Trade idea: This is not the right time to trade Bitcoin.
If you want to learn more about trading FVG's with wave analysis, please make sure to follow me.
This shared post is only my point of view on what could be the next move in this pair based on my analysis.
Don't be emotional, just trade your plan!
Eduwave
Elliott Wave

Still more upside for goldHi traders,
Last week gold moved exactly as I've said in my previous outlook. After the open it continued the upmove to a new ATH. So I hope you've made some profit.
Next week we could see a small correction down but after that more upside for this pair.
Let's see what price does and react.
Trade idea: Wait for a small correction down on a lower timeframe and a change in orderflow to bullish to trade longs.
If you want to learn more about trading FVG's & liquidity sweeps with wave analysis, please make sure to follow me.
This shared post is only my point of view on what could be the next move in this pair based on my technical analysis.
Don't be emotional, just trade your plan!
Eduwave

SPX500USD is still going up slowlyHi traders,
Last week SPX500USD finished the correction (Flat) and went up again just as I've said in previous outlook.
Price is not very impulsive. It looks like it forms an ending diagonal.
So next week we could see this pair slowly going up some more.
Let's see what the market does and react.
Trade idea: Wait for a small pullback and a change in orderflow to bullish on a lower timeframe to trade longs.
If you want to learn more about trading FVG's & liquidity sweeps with Wave analysis, then please make sure to follow me.
This shared post is only my point of view on what could be the next move in this pair based on my technical analysis.
Don't be emotional, just trade your plan!
Eduwave

USDJPY, Elliott wave analysisOutlook for USDJPY on 3Days chart.
I think we are in sub-wave (ⅱ) of the wave 3.
The market remains volatile.
The corrective wave may continue for a while.
If it can break through channel line, it will probably become bearish.

We will see - MANA weekly update Sep 6 - 12thThe high of Minor Wave 1 has been broken — but not sustained. Price has already fallen back below this level, suggesting that the correction of Minor Wave 2 is still ongoing. On the positive side, the low of Minor Wave 2 has not yet been breached. On the negative side, MANA failed to extend the first impulse of Wave 3.
That said, the structure still leaves open the possibility that the final pump represented a Wave 1. For the alternative 1–2 setup to remain valid, it is crucial that support around the 1.0 extension level holds, allowing price to transition into Minute Wave 3. The liquidity heatmap supports this scenario, as a large cluster of liquidity sits at this level, which could act as a buy wall. Conversely, if support at the 1.0 extension fails, price could drop further toward the 2.0 extension level in search of additional orders.
Derivative data currently presents a slightly bearish sentiment, with only mildly positive funding rates and stagnant open interest.
For now, I will wait and observe how price reacts at these key levels before taking action.

More upside for EUHi traders,
Last week EU went up very slow to finish (red) wave 5. This could be the last impulse wave up.
So next week I think price will go higher to the bearish Weekly FVG above.
Let's see what the market does and react.
Trade idea: Wait for the finish of a correction down and a change in orderflow to bullish on a lower time frame to trade longs.
If you want to learn more about trading with FVG's, liquidity sweeps and Wave analysis, then make sure to follow me.
This shared post is only my point of view on what could be the next move in this pair based on my technical analysis.
Don't be emotional, just trade your plan!
Eduwave

CRYPTO: ETHERIUM (H1)CRYPTO:ETHUSD
Wave Count:
- The larger impulse (labeled (1) → (5)) appears complete, with the top marked at wave (5).
- Current structure is unfolding as a corrective pattern following the top.
- Subwaves labeled (a) or (1), B, and C suggest that the market is now in a decisive corrective phase.
There are two potential corrective scenarios being tracked:
1. Expanded Flat / Running Flat correction.
2. Impulse move down unfolding as wave (3).
Targets:
Upside (retracement / correction before continuation):
- 4,400 – 4,600 USD (Expanded Flat target zone).
- 4,961.2 USD is marked as the Recent Count Invalidation level – any move above here would invalidate the current bearish count.
Downside (continuation of correction / start of larger wave (3)):
- 3,573.0 USD – first bearish target (wave (c) or (3)).
- 3,362.7 USD – extended bearish target if downside momentum accelerates.

SOLUSDT | 1 DAY | SWING TRADING Hey friends!
I’ve put together a detailed analysis on Solana just for you. The harmonic pattern has completed, and we’ve already seen some strong buying from that exact zone. 📈
Now, I’ve got two targets for you:
🎯 Target 1: 170.00
🎯 Target 2: 219.00
🔴 STOP: 75,81
"Just a heads-up — since this is a swing trade, the target might take some time to hit. Good to keep that in mind."
Remember, the more love and likes I get from you, the more motivated I am to keep sharing these analyses. All I ask is for a simple like to show your support. 💙
Huge thanks to everyone supporting with their likes — I truly appreciate it!

SOLUSDT → Stronger than the market. Correction before growthBINANCE:SOLUSDT updated its maximum to 218 and entered another phase of correction for consolidation. The altcoin looks quite strong against the backdrop of the rest of the cryptocurrency market...
Bitcoin continues its aggressive decline after yesterday's trap (false breakout of the trend line). Despite relatively positive fundamental and technical developments, the cryptocurrency market is in the red. Against this backdrop, SOL stands out as a strong altcoin compared to Bitcoin, which has been falling for two weeks. SOL updated its maximum and entered a correction phase. Within the current structure, the price may test the liquidity zone of 202.5 - 195.3 before continuing to grow to 220 - 240.
The reaction to false breakouts of local highs is weak, there is no reversal, and the nature of the current structure is “consolidation.” If the bulls keep the price above 200 during the correction, the further outlook will be positive.
Resistance levels: 216.5, 220, 244
Support levels: 202.5, 198.0, 195.3
Focus on the current correction. We need to wait for a slowdown and the end of the structure. Focus on the specified support zones, from which the market may resume bullish trading, which in turn may lead to a breakout of intermediate resistance and growth to the specified targets.
Best regards, R. Linda!

elliot waves in LODHAElliott Wave Setup: Correction Nearing Completion, Impulse Loading
Verdict: Bullish bias intact—Wave 4 correction is maturing, Wave 5 impulse setup is in play.
What’s Good
Waves 0→1 and 2→3 show clean, unmitigated impulse structure—trend strength confirmed
Wave 4 is unfolding as a double flat, a classic corrective pattern with predictable exhaustion
Upside targets are mapped at 1.1011, 1.1258, and 1.659—clear tactical levels for breakout traders
What’s Bad
Wave 4 remains unresolved—no confirmation of exhaustion yet
A breakdown below 1.0650 would invalidate the bullish count and shift bias to neutral
Tactical Checklist
Wait for Wave 4 to complete—look for breakout above 1.0750
Enter scaled longs near 1.0650–1.0750 on confirmation
Target 1.1011, 1.1258, and 1.659 with stops below 1.0650

A great Buy Opportunity for HONYFLOURThis is a momentum-forward stock with strong fundamentals and explosive past performance—but caution is key, given its extreme volatility and low free float.
Risk-tolerant traders can enter now with tight stops.
Long-term investors may prefer to wait for a pullback to lock in better average cost.
Wave watchers should be alert to signs of corrective structures emerging, especially in line with Elliott Wave theory.

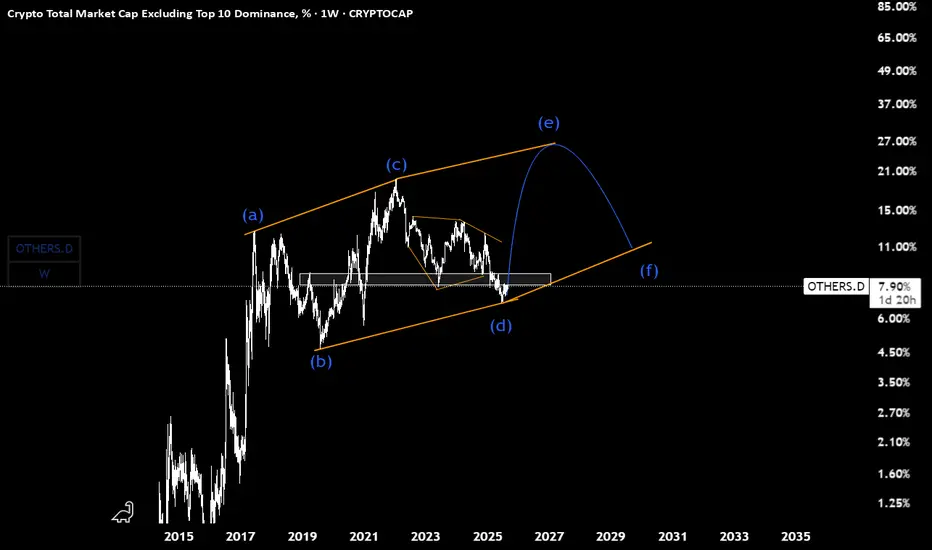
Others.D(based on NEo wave)there is 2 ways for wave E
its E of diametric or E of triangle.
we should wait for it but triangle makes a sharper wave E.
confirmation is breaking the white box on W timeframe.
in short... Short SPOTTechnically we are in a distribution phase.
Price battling around 50MA, once it fails it gonna test 200MA and bounce a little but gonna continue slide further more
Target 1 - 600
Target 2 - 500
Stop Loss - 760
No wonder if it goes further down to 400 or 300, we'll revisit this later.

Dejitaru Tsuka: A Puritan of Decentralized Finance?I've made other UNISWAP:TSUKAUSDC_67CEA3 posts prior to this one. The targets are all over the place. This is partly due to TradingView's Fibonacci tool sometimes acting erratically, but also due to premature assumptions on my part.
re: $777 target
This one was very much wild, especially in near term. This was due to my belief that TSUKA would be printing an impulsive wave (I was still growing in my Elliott Wave studies, as I am now too). My belief is now different, and I think the chart has confirmed the same.
re: sub $100 targets
These were totally due to a glitching Fib tool. Thanks TradingView.
re: targets between $100-$130
These are fully expected to be in order based on the Fibs and form of TSUKA's macro fractal. The only thing that could negate such targets in my opinion is Bitcoin breaking below $75,000 before October - December 2026 . I think this would be a strong and decisive indication that altseason is officially over (and the first major fractal for Bitcoin's macro chart).
Between today and the end of altcoin season, I expect that Dejitaru Tsuka will outperform 99% of all available tickers, of all available markets .
*Key price levels and expected periods of transitional moves are very likely to change. Surf carefully/closely.

TAO BINACNE This is a TAO chart on Binance. I want to publish this chart so that anyone who would like to upload to chatgpt can do so

(Alchemy Markets) Silver Sees 45 Year Trend LineSilver has rallied nearly 45% from the April low reaching $41/oz. Silver prices can now see a very long-term trend line connecting the 1980 and 2011 price highs , a 45-year trend line in the making. (red line)
If Silver were to rally that high, a bearish reaction would likely be felt.
However, Silver has a wall of Elliott wave relationships and market geometry it needs to contend with first.
The rally from the September 2022 low is quite mature from an Elliott wave perspective. The rally is unfolding as an impulse wave pattern labeled 1-2-3-4-5 and it appears Silver is in the late stages of wave 5.
Wave 5 would need to subdivide as 5-waves and current prices appear to have completed wave ((iv)) at the July 31 low.
If this wave labeling is correct, then Silver is in wave ((v)) of 5 of (C)...an ending wave at 3 degrees of trend.
We can use common wave relationships and market geometry measurements to estimate where this current up wave may travel to.
There is a cluster of wave relationships between 41.59 - 44.92 plus a parallel price channel to help hold down Silver.
Lastly, there is some histogram divergence noted on the MACD indicator.
All of these symptoms mixed together suggest rallies in Silver may be limited with the bulk of the trend behind it.
IF this is correct, then another down-up sequence may finish silver off and lead to a decline back to the wave 4 extreme, near $29.
Though not expected, if silver does plow above $44.92, then the 1980 trend line will likely offer a bearish reaction.

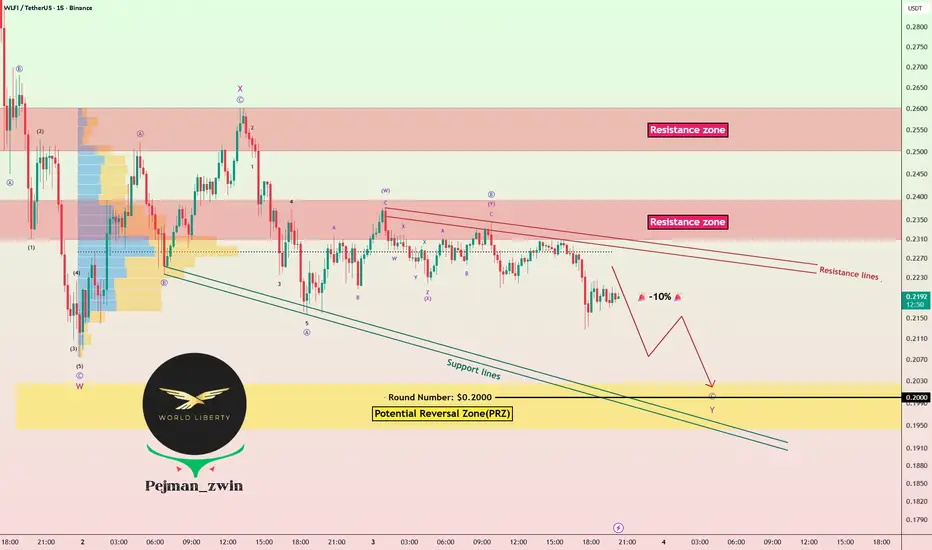
WLFI Faces -10% Risk! Will PRZ Trigger a Strong Reversal?Today, I’m going to analyze World Liberty Financial ( BINANCE:WLFIUSDT ) from a fundamental and technical perspective .
WLFI is the governance token (non-equity) with a 5% per-wallet voting cap.
USD1 is a fully backed U.S. dollar stablecoin (T-Bills + cash).
Total WLFI supply is 100B, with ~24.6B circulating at launch (TGE).
A large share of economic benefits (75% of net revenues) goes to a Trump-affiliated entity, raising concentration and political/regulatory risk.
Key partnership : Alt5 Sigma announced $1.5B funding to adopt WLFI’s treasury strategy and acquire tokens.
Risks : ownership concentration, regulatory scrutiny, and recent EIP-7702 phishing attacks targeting WLFI wallets.
Latest update : WLFI trading started Sep 1 with high volatility and a strong market cap, alongside ongoing security warnings.
Summary : WLFI is a high-risk, high-attention project whose future depends on USD1 adoption, governance transparency, and security execution.
----------------------------------------------------------------------------------
Now, let's use the candles that the WLFI token has created since September 1st and examine the technical analysis of this token on the 15-minute time frame .
First, let me say that due to the low number of candles created , some technical analysis can be challenging .
The WLFI token has been in a correction mode since it was listed on various exchanges .
In terms of Elliott wave theory , WLFI token seems to be completing the microwave C of the main wave Y . The corrective wave structure could be a Double Three Correction(WXY) .
I expect WLFI token to continue its decline and drop at least -10% . The Potential Reversal Zone(PRZ) and Support lines could cause the WLFI token to rise again.
First Target: $0.2043
Second Target: $0.2003
Stop Loss(SL): $0.2400(Worst)
Please respect each other's ideas and express them politely if you agree or disagree.
World Liberty Financial Analyze (WLFIUSDT), 15-minute time frame.
Be sure to follow the updated ideas.
Do not forget to put a Stop loss for your positions (For every position you want to open).
Please follow your strategy and updates; this is just my Idea, and I will gladly see your ideas in this post.
Please do not forget the ✅' like '✅ button 🙏😊 & Share it with your friends; thanks, and Trade safe.
XAU/USD 5th WaveAfter the Daily chart breakout after forming triangle, now price is climbing on the 5th final wave from the low of 28th Sept 2022. Expecting price to make retracement/pullback after completing wave 3 of (5). And one final push towards $36xx - $37xx region

Cable: Texbtook Elliott Wave pattern is pointing higherCable stabilized at the 1.3350 area as expected, from where we’ve seen a nice intraday rebound that could even be a small impulse, signaling continuation within the uptrend. This fits the textbook Elliott Wave 8-wave pattern, with five waves up from the August lows followed by an A-B-C, 3-leg setback. Such a structure suggests bulls are yet to lift the price toward and beyond the 1.36 area, though we may have to wait for tomorrow’s NFP release, which could be the key catalyst for markets this week.
GH

XAUUSD_4H_BuyGold Analysis in the Medium Time Frame
Gold is in a large wave 3 based on Elliott Waves and can only continue to rise and enter the $3600 channel by maintaining the price above $3540.
Note that the main and important number for us is $3540!
Ask us for gold signals

RENDER Long zonesRENDER possible zones where it's going to have rejections.
If hits them, be sure you set the TP ~2-3% and SL as well.

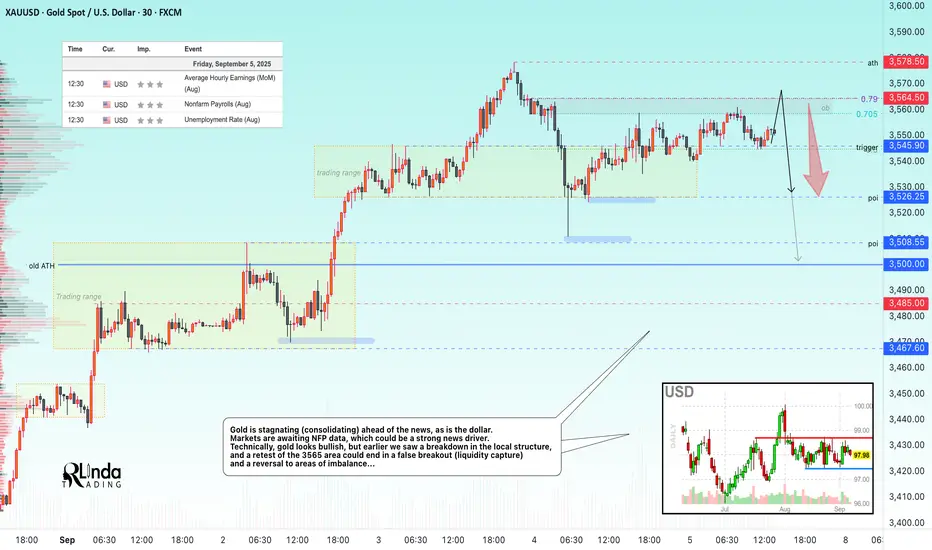
GOLD → ATH retest before NFP. High risk level...FX:XAUUSD remains in a bullish trend, but short-term dynamics depend on NFP. A break above $3578 will open the way to new highs, but profit-taking at record levels could increase volatility.
Gold remains strong ahead of US NFP data, which may confirm the Fed's policy easing. Weak data (forecast: +75K new jobs) will reinforce expectations of a rate cut and support gold. However, the risk of a correction is quite high, and any nuances could trigger liquidation. Weak employment data, namely rising unemployment and low ADP figures, are strengthening bets on a Fed rate cut, which overall only increases interest in the metal.
Resistance levels: 3564.5, 3578.5
Support levels: 3545.9, 3526, 3508
NFP data will determine the short-term trend. A weak report will lead to growth to $3600+, while a strong report will lead to a correction to 3450-3400. Technically, I expect a correction after the local bullish structure breaks down. It is not worth trading on the news; it is better to wait 20-40 minutes after the release to make decisions based on fundamental data.
Best regards, R. Linda!
Gold After completing the flat abc correction, Gold has moved higher. The bullish scenario remains in play, with the next target around 3570. Traders should continue to follow the upside plan.
