POSITIONAL IDEA - BAJAJ CONSUMER CARE Bajaj Consumer Care , part of the Bajaj Group and a well-established player in the Indian personal care segment, is currently presenting a positional trade opportunity, supported by a strong technical setup and improving price structure.
Reasons are listed below :
The 300 zone has acted as a strong resistance and has been tested multiple times, increasing the probability of a decisive breakout
Potential breakout from a triple bottom formation
Possible breakout from a consolidation phase of more than five years
Trading above both 50-week and 200-week EMAs, indicating strength in the long-term trend
Price structure remains bullish with higher highs and higher lows
Rising volumes suggest increasing participation and accumulation
Targets - 324 // 390 // 510
Stoploss - weekly close below 230
DISCLAIMER -
Decisions to buy, sell, hold or trade in securities, commodities and other investments involve risk and are best made based on the advice of qualified financial professionals. Any trading in securities or other investments involves a risk of substantial losses. The practice of "Day Trading" involves particularly high risks and can cause you to lose substantial sums of money. Before undertaking any trading program, you should consult a qualified financial professional. Please consider carefully whether such trading is suitable for you in light of your financial condition and ability to bear financial risks. Under no circumstances shall we be liable for any loss or damage you or anyone else incurs as a result of any trading or investment activity that you or anyone else engages in based on any information or material you receive through TradingView or our services.
@visionary.growth.insights
Equity

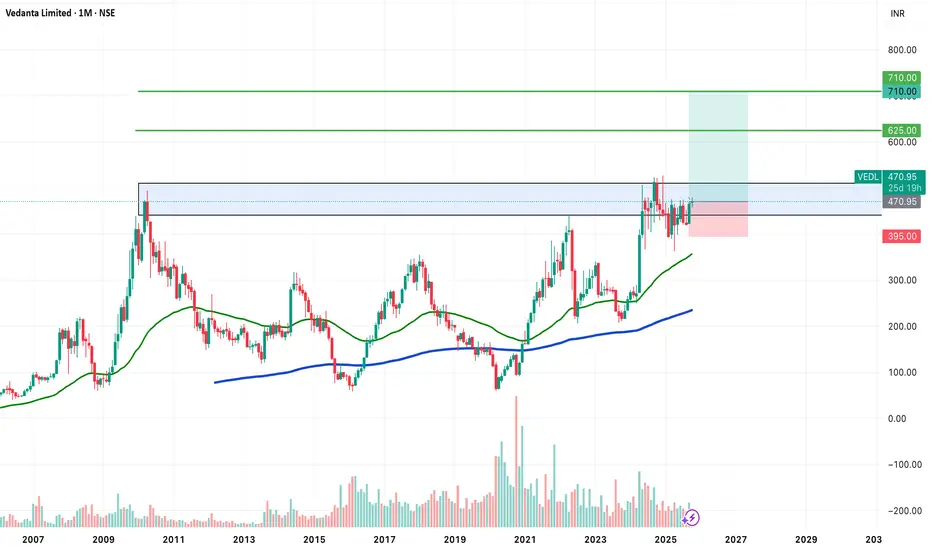
POSITIONAL IDEA - VEDANTA (VEDL)Vedanta Ltd , one of India’s leading diversified natural resources companies, is showing a strong long-term breakout setup supported by powerful technical signals.
Reasons are listed below :
Attempting a multi-year breakout after nearly 14 years of consolidation
Potential VCP (Volatility Contraction Pattern) breakout forming
Bullish engulfing candle on the monthly timeframe
Consolidating near all-time highs, showing strength in price structure
Trading above 50 & 200 EMA on both weekly and monthly charts
Maintaining a clear higher-high, higher-low trend structure
Target - 625 // 710
Stoploss - monthly close below 395
DISCLAIMER -
Decisions to buy, sell, hold or trade in securities, commodities and other investments involve risk and are best made based on the advice of qualified financial professionals. Any trading in securities or other investments involves a risk of substantial losses. The practice of "Day Trading" involves particularly high risks and can cause you to lose substantial sums of money. Before undertaking any trading program, you should consult a qualified financial professional. Please consider carefully whether such trading is suitable for you in light of your financial condition and ability to bear financial risks. Under no circumstances shall we be liable for any loss or damage you or anyone else incurs as a result of any trading or investment activity that you or anyone else engages in based on any information or material you receive through TradingView or our services.
@visionary.growth.insights
Down to Support ~$90Since 2024, each time the 10 day crossed the 20 day (which just happened), we had already dropped and bounced off the 50 day.
This has not happened this time. Aka = this time will likely be different.
I expect we will go down to the 50 day ~$90, if the larger bulltrend is intact, this will just be a pullback. If not, this will just be a speedbump where shorts are closed and this price rallies back up to the 20 before continuing downward.


Hdfc bank analysis for intraday today 30-12-2025HDFC Bank Quick Summary
Upper Trigger: 992.20
Lower Trigger: 991.20
Above 992.20: sustain + volume = upside
Below 991.20: sustain + volume = downside
Fast reject: fake move

APPL (APPLE) BUY IDEAAPPL (APPLE) BUY IDEA
📊 Market Sentiment
Market sentiment is bullish, driven by expectations of the FED’s potential rate cut in December. In addition, Trump’s likely nominee for the new FED Chair is Kevin Hassett a strong supporter of aggressive rate cuts.
This possibility has pushed markets higher as participants began pricing in earlier and more aggressive cuts for 2026.
📈 Technical Analysis
AAPL remains one of the most bullish stocks in the U.S. market. All higher timeframes are strongly bullish.
We are currently seeing a retracement from recent all time highs, which in my opinion is simply a healthy pullback to build momentum for higher prices.
📌 Game Plan
I have two key Points of Interest for potential long entries. Both support a bullish continuation thesis, and I do not expect a major bearish shift for AAPL anytime soon.
Scenario 1:
Price taps 276.25 and bounces.
I will wait for a daily bullish close to confirm the continuation.
Scenario 2:
Price dips into 271 and bounces.
I will again look for a daily bullish close as confirmation.
Note:
The FED’s rate decision will be released on Wednesday at 2 PM.
Until then, I expect price to potentially move into an accumulation or range phase.
If I see strong movement earlier in the week, I won’t hesitate to take a long position.
💬 For deeper sentiment and strategy insights, subscribe to my Substack free access available.
⚠️ This analysis is for educational purposes only and does not constitute financial advice. Always conduct your own research before trading or investing.

WEEKLY SPY (ES-SP500-SPX-US500) Outlook - Prediction (14 DEC)WEEKLY SPY (SP500-SPX-US500) Outlook - Prediction (14 DEC)
📊 Market Sentiment
Market sentiment has turned slightly bullish again following the FED’s rate cut decision. We saw the market react quickly after Powell’s speech. QE has restarted, and the FED stated it will buy $40 billion of Treasury bills over the next 30 days. This narrative supports the bullish case; however, $40B is relatively small when compared to the overall size of the U.S. market.
At the same time, the bearish narrative is strengthening. Powell stated that “rates are now in a plausible range of neutral,” and the FED emphasized that it will assess incoming data until the January meeting. No decision has been made for January yet.
This keeps the market in a state of uncertainty and when the market lacks a clear narrative, it often turns bearish. Keep this in mind.
📈 Technical Analysis
Price ran the 690 level and printed another all time high, which I highlighted in last week’s prediction (see the linked idea below). However, although price tagged 690, it failed to close above it, and we saw a strong rejection.
This reaction is a textbook example of a range deviation model. When price cannot close above a key level, it often seeks lower prices to gather liquidity and energy for continuation.
📌Prediction – Game Plan
There are two scenarios I am monitoring:
Scenario 1 (Black Scenario) – Bullish:
Price targets the 678.75 level and runs that swing but fails to close below or closes back above 678.75. This would indicate that price has collected sufficient liquidity to expand higher.
In this case, I will be buying calls, taking partial profits at 684.25, and letting the remainder run toward all time highs.
Scenario 2 (Red Scenario) – Bearish:
Price aggressively breaks 678.75 and closes below it on a 4H candle. In that case, I will look to buy puts around 678.75 if price provides a retest.
My first target will be 670, followed by 660.5.
The 670 level may act as a reversal zone for SPY. If we tap this level and see a daily close above 670, I will consider that price is attempting to seek higher levels again.
💬 For detailed insights and broader market context, please check my Substack link in profile.
For educational purposes only. This is not financial advice.

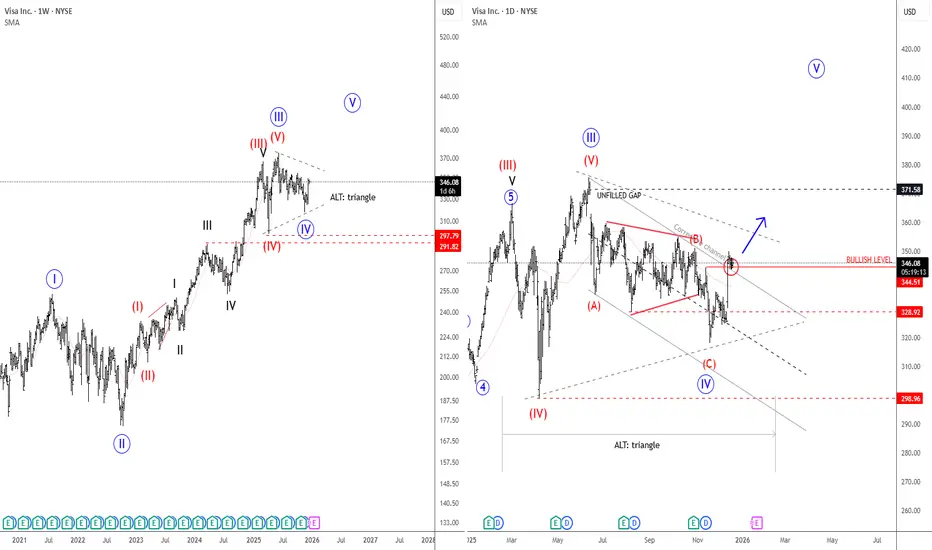
Visa: Completing Correction, Upside Potential AheadVisa Inc. is a global payments technology company that operates one of the world’s largest electronic payment networks. It enables secure electronic transactions between consumers, merchants, and banks in over 200 countries, focusing on fast, reliable, and cashless payments.
Visa has pulled back roughly 15% from its highs and appears to be completing a clear A-B-C corrective decline. Moves out of triangle formations are often final legs within corrective structures, suggesting a new bullish push could be approaching. This outlook is reinforced by the unfilled gap near 371, which historically tends to act as a price magnet over time. As a result, a reversal to the upside over the coming weeks or months would not be surprising. A breakout above the corrective channel would serve as a key confirmation for trend resumption.
Highlights:
Visa appears to be completing an A-B-C decline
Channel break signals potential upside continuation
Unfilled gap at 371 remains a key upside target for 2026
Bullish confirmation above 344.50
Support levels at 311 and 298 on deeper pullbacks
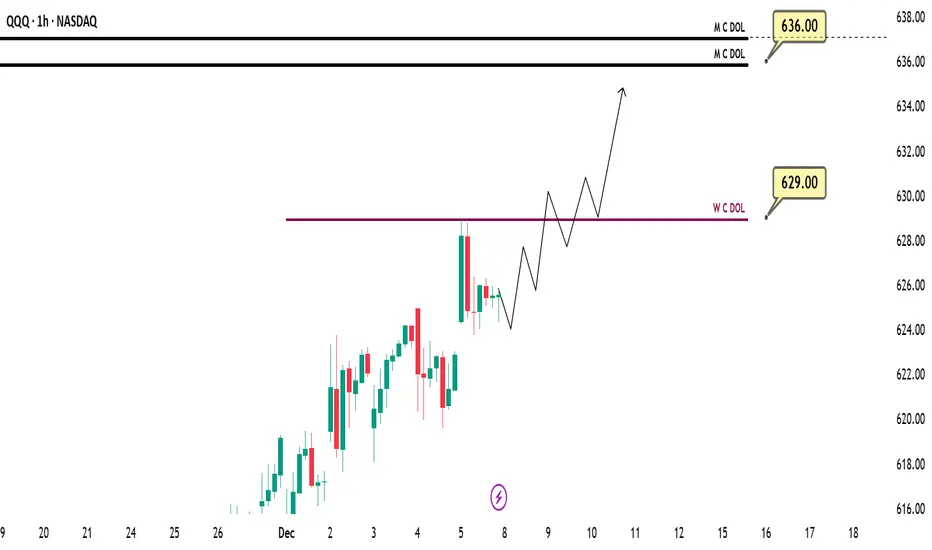
QQQ (US100 – USTECH – NQ) WEEKLY PREDICTION - (08 DEC)QQQ (US100 – USTECH – NQ) WEEKLY PREDICTION
📊 Market Sentiment
Market sentiment remains bullish, supported by expectations of a potential FED rate cut in December.
Additionally, Trump’s likely nominee for the next FED Chair Kevin Hassett, a strong advocate of aggressive rate cuts has strengthened this bullish outlook.
Markets have already begun pricing in the possibility of earlier and more aggressive cuts throughout 2026, fueling continued upside momentum.
📈 Technical Analysis
QQQ is strongly bullish at the moment.
In my opinion, as long as SPY continues pushing toward all time highs, QQQ is unlikely to experience any meaningful retracement.
📌 Game Plan – Prediction
I expect QQQ to reach 629 this week at minimum.
A strong move may occur right after the market opens however, since the FED decision will be released on Wednesday, the early part of the week may show some choppy or ranging price action.
💬 For deeper sentiment and strategy insights, subscribe to my Substack free access available.
⚠️This analysis is for educational purposes only and does not constitute financial advice. Always conduct your own research before trading or investing.
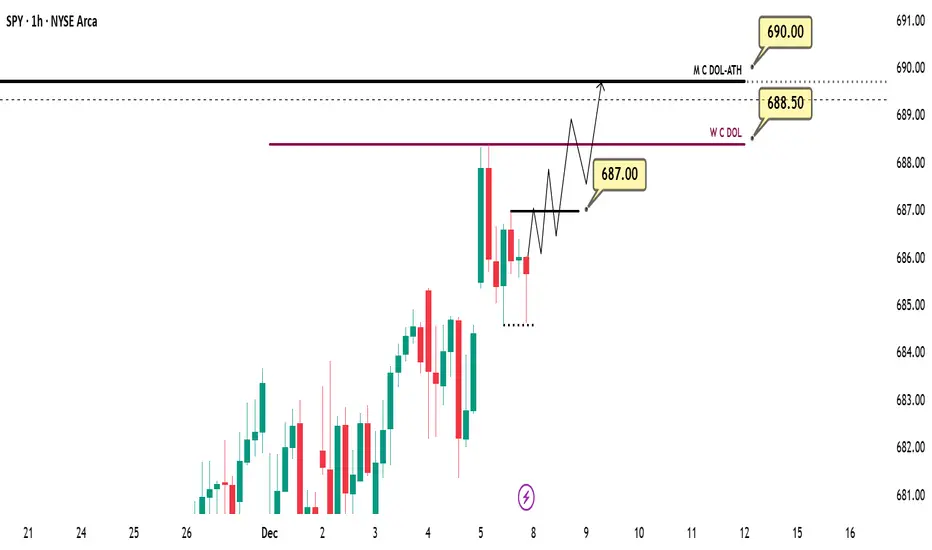
SPY (US500–SP500–SPX) WEEKLY PREDICTION (08 DEC)SPY (US500 – SP500 – SPX) WEEKLY PREDICTION
📊 Market Sentiment
Market sentiment remains bullish, supported by expectations of a potential FED rate cut in December.
Additionally, Trump’s likely nominee for the next FED Chair Kevin Hassett, a strong advocate of aggressive rate cuts has strengthened this bullish outlook.
Markets have already begun pricing in the possibility of earlier and more aggressive cuts throughout 2026, fueling upward momentum.
📈 Technical Analysis
SPY remains strongly bullish and is currently targeting new all time highs.
In my opinion, during this type of price behavior, I do not expect a deep retracement before the market attempts to run the previous highs.
📌 Game Plan – Prediction
I expect SPY to either push directly into new all time highs or consolidate until Wednesday’s FED decision.
If I see a strong daily close above 687, I plan to buy the retracement into 685, targeting:
First target: 688.5
Second target: All-time highs around 690
💬 For deeper sentiment and strategy insights, subscribe to my Substack free access available.
⚠️ This analysis is for educational purposes only and does not constitute financial advice. Always conduct your own research before trading or investing.
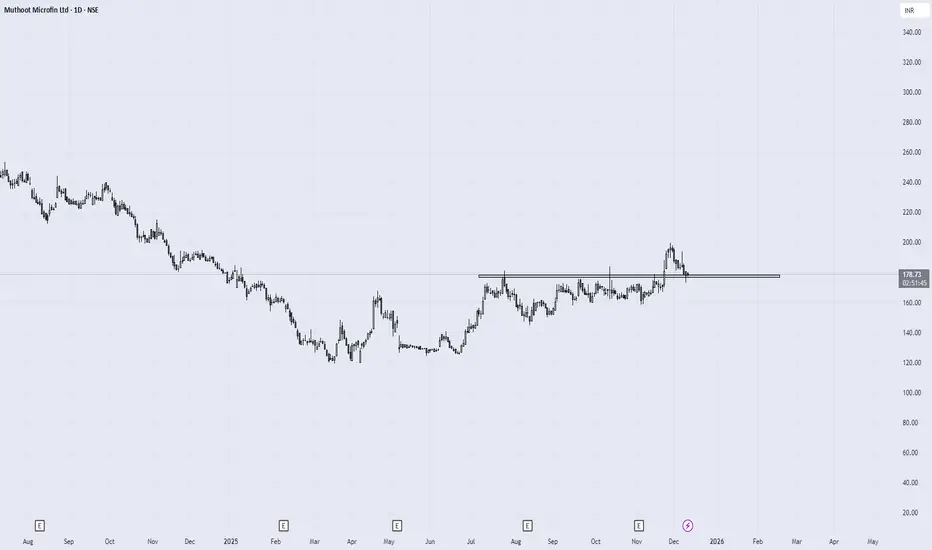
First partial entry#MUTHOOTMF
partial entry at 178
Remember this is early entry, hence not going fully in.
Microsoft: Overvalued but Still Bullish - Watching the 400–450Microsoft NASDAQ:MSFT
1. Quick Trade Plan (for those who want levels first) 🎯
Market Bias: Long term bullish, but in a late phase of the cycle.
Strategy: Don’t chase highs; buy the correction.
📌 Buy Zones
Primary Buy Zone: 400–450 USD
Strong support cluster and the preferred accumulation zone.
Aggressive Early Entries:
450–470 on sharp dips, but main focus remains 400–450.
⛔ Invalidation Level
345 USD
A break below this level invalidates the mid term bullish structure.
🎯 Take Profit Targets
TP1: ~600
TP2: 680–720
Potential completion of the final fifth wave.
🧭 For Current Holders
Continue holding while above 345.
Use a protective stop below 345 if trading shares.
Options traders may hedge instead.
🆕 For New Buyers
Avoid entering near ATHs.
Wait for the 400–450 pullback.
Use 345 as your hard-risk level.
2. Fundamental Overview: Great Business, Clearly Overvalued 💼📊
Microsoft has delivered very stable mid-teens growth for years:
Revenue growth: 15–17 percent annually
EPS growth: also 15–20 percent annually
Last 3 quarters: EPS +9–12 percent, revenue in the same range
This is a mature mega-cap, not a hyper-growth name.
⚠️ Buybacks Stopped
Company regularly bought back shares for six years
Stopped in March 2023 and hasn’t resumed
This removes a major EPS-boosting engine
📉 Valuation (Peter Lynch style)
EPS growth ≈ 15 percent
P/E ≈ 30
Stock trades at ~2x its fundamental fair value
Conclusion:
Amazing business. Predictable. Cash generative. 🔥
But fundamentally overpriced and in the late stage of its growth curve.
3. Technical Picture: Still Bullish, but Late in the Cycle 📐📈
📅 Long Term Channel Since 2010
Price has stayed inside a massive uptrend channel for 14+ years.
As long as MSFT remains inside it, the primary trend stays bullish.
📏 200-Day Moving Average
MSFT consistently bounces from the 200d MA on the weekly.
That keeps the structural bull trend intact.
🌊 Elliott Wave Context
Currently in the 5th sub-wave of a larger 3rd wave
Upside still possible
Potential final wave targets: 600–700
⏳ What Comes After
Once this major wave completes:
Expect a multi-year sideways cycle (5–7 years) as the market distributes the massive positions accumulated since 2009.
4. Current Structure: A Correction Is Likely Before New Highs 🔄
We already saw an A–B–C correction, but structure suggests another A–B–C, forming a zigzag, before the final move higher.
🎯 Why 400–450 Is the Key Zone
Major liquidity & support cluster
Aligns with channel midline and prior consolidation
Perfect area for a 5th wave launch
If MSFT hits 400–450 and bounces → 600–700 is back on the table.
5. What To Do Based on Your Situation 🧭
✔️ If You Already Hold MSFT
Stay in the trade while above 345
Expect volatility
You can hedge or use a stop below 345
🟦 If You Want to Enter
Don’t FOMO near the highs ❌
Wait for a pullback into 400–450
Start with partial size, add on confirmation
345 = hard stop
⚡ If You Trade Short Term
Shorts are counter-trend
Treat every drop as a tactical move, not a macro reversal
Unless 345 breaks
6. Final Thoughts ✨
Microsoft is still in a powerful long term uptrend, but:
Fundamentally overvalued
Technically late stage of its long cycle
Likely to give a clean buyable correction
Best accumulation zone: 400–450
Invalidation: 345
Upside targets: 600–700
It’s a “buy the dip, not the rip” market for MSFT.
Not financial advice — manage risk according to your plan.

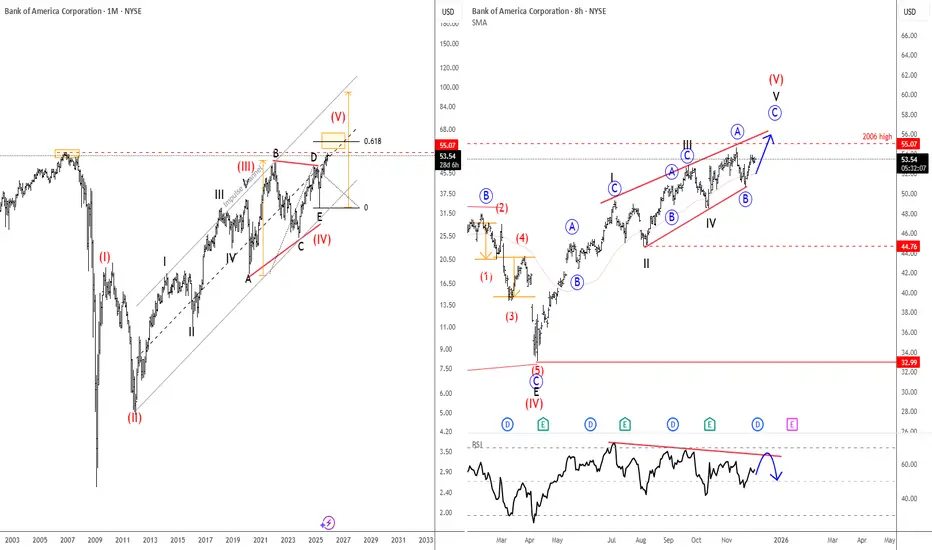
Bank Of America Is Eyeing All-Time Highs From 2006Bank of America is one of the largest banks in the world, serving millions of consumers, businesses, and institutions. It has a broad mix of operations — consumer banking, wealth management, corporate banking, and global markets — which helps keep its earnings stable. The bank has been heavily investing in digital services and technology, aiming to improve efficiency and customer experience. Its size and global reach make it a key player in the U.S. and global financial system.
Bank of America is in an uptrend with a very strong rebound since April 2025, and the price is now approaching the 2006 highs. That area around 55 is extremely important because the current structure looks like an ending diagonal in wave five, meaning we could be in the late stages of a higher-degree bullish cycle. The push up this year also comes out of a very big triangle on the monthly chart, so despite the positive momentum, we should be aware that resistance is getting closer and bullish momentum may slow down. We also see RSI divergence on the daily chart, which is very common when diagonals mature. So while the trend is still up for now, it makes sense to be careful around 55, as a potential reversal in 2026 would not be a surprise.
Highlights:
Trend: Bullish but late-stage (ending diagonal risk)
Resistance: 55-56 area (2006 high)
Invalidation of a bull trend: broken trendline support
Note: Watch RSI divergence and respect the 55/56 zone as potential exhaustion of wave five
Coca-Cola Is Attacking All-Time HighsCoca-Cola is basically one of the most famous drink brands in the world. It started in the late 1800s in the U.S., and over time it turned into a huge global company. They’re known for their classic Coke, but they also make tons of other drinks—juices, waters, teas, and even energy drinks.
After that gap up, Coca-Cola filled that gap as expected and then turned higher and broke above 71.77 resistance. So the wave structure remains bullish, and we could still see a push to new highs, as wave C — possibly the final leg of an ending diagonal — may target the 76–78 area. So latest retracement toward 68 might have been just temporary setback ideally wave two and bulls are now ready for new highs. We remain bullish as long as price stays above 66.
Highlights:
Trend: Bullish (wave C continuation in w. 5)
Support: 71, 68, 66
Resistance: 74, 78
Note: Bullish above 66, watching for wave C resumption towards new highs.

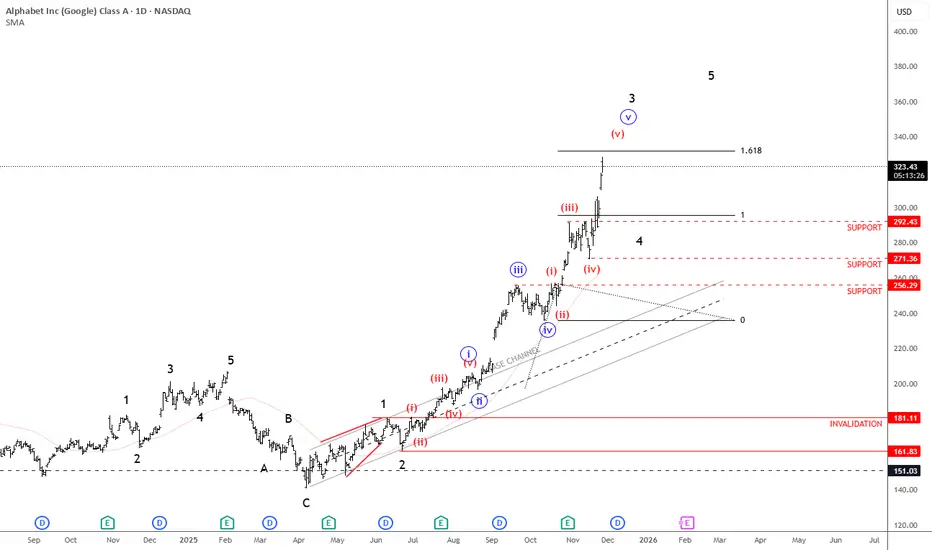
Google Is In Strong Bullish Trend; Unfolding A Five-Wave ImpulseAlphabet (Google) is a huge tech company best known for its search engine, but it also makes things like Android, YouTube, Gmail, and cloud services. Google is pushing hard into AI and cloud computing. They’re rebuilding search with AI, making stronger chips, and growing Google Cloud fast. They’re also investing in long-term tech like self-driving cars and quantum computing.
Google is in a very strong uptrend as expected, but we can now count five waves up within the black wave three cycle from around 160. Ideally, the next pullback would be wave four, stabilizing near the previous fourth-wave area around 292–271. And once or if we see that kind of correction, that's when new buying opportunities could appear, but for now, it’s better to stay cautious since we may already be in the later stages of this cycle.
Highlights:
Trend: Strong uptrend, but nearing late stages of wave three
Potential: Pullback in wave four before continuation higher
Support: 292–271 zone
Invalidation: Below 200
Note: watch for a correction before new long setups
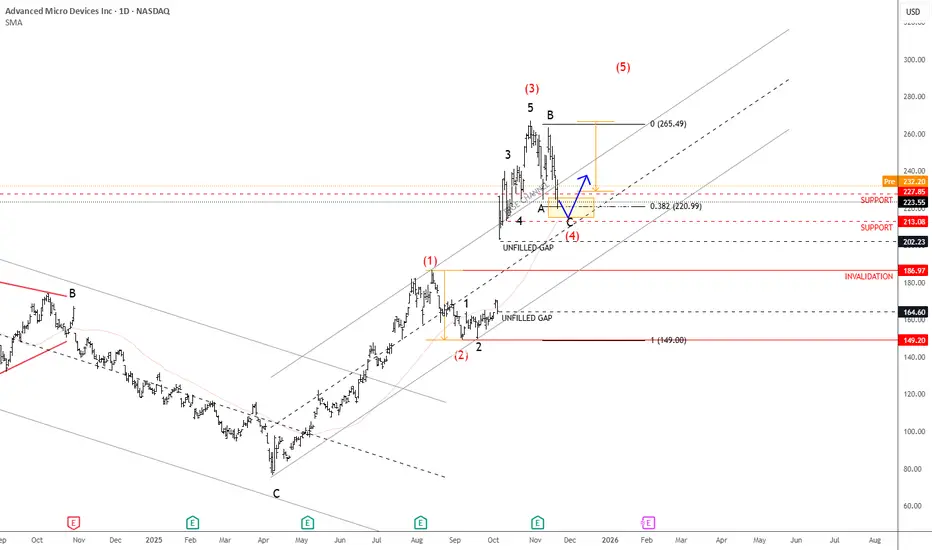
AMD Is Approaching Support, While Finishing A CorrectionAMD is in a very strong uptrend, supported by the impressive rally since early October when it gapped higher on positive AI news. Since then, the stock has gained more than 50%, and this bullish momentum could continue after a retracement, especially considering latest company’s better-than-expected earnings report.
But based in latest price action, we assume that the market is now in a corrective pullback before resuming higher, ideally forming wave four within a broader five-wave sequence. The previous high around 220 could act as the first key support, followed by the 200 area, which also aligns with upper range of unfilled gap. So if we are correct, then later this month or early in December, the market can once again stabilize and turn up for a new high, while the price is above 187 invalidation level.
Highlights:
Trend: Strong uptrend, wave four correction in view
Support: 220 / 200 zone
Invalidation: Below 186
Note: Wait for a pullback to complete before considering new long opportunities
Daily QQQ (US100-NQ) Outlook - Prediction (NOV 18)Daily QQQ (US100-NQ) Outlook - Prediction (18 NOV)
📊 Market Sentiment
Market sentiment appears bearish right now, in my opinion. The FED may pause rate cuts in December, which has contributed to recent selling pressure and possible hedging flows. However, with the U.S. government reopening last week, we will start receiving updated economic data again. If employment data weakens and CPI comes in low or stable, it could trigger renewed bullish momentum.
NVDA will report earnings this Wednesday after market close. I will be watching closely in my view, if NVDA were to miss expectations, both QQQ and SPY could see a strong retracement. However, I think this is unlikely. I expect solid earnings growth and believe the ongoing AI cycle continues to support upside.
Additionally, U.S. Treasury Secretary Scott Bessent stated that the Trump administration aims to finalize its trade agreement with China by Thanksgiving (November 27). This could bring further bullish sentiment into the market.
📈 Technical Analysis
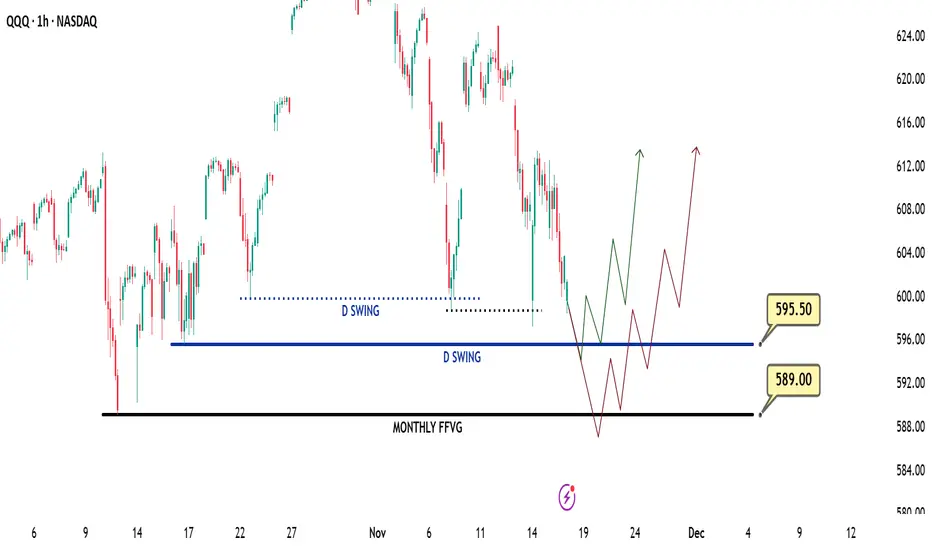
The market showed a strong bounce on Friday after tapping the 599 level. RSI has also reset, meaning price is no longer overbought. We remain inside the weekly range, and price has now touched the 0.75 max discount zone for the second time.
📌 Game Plan – Prediction
There are 2 different expectations outlined on the chart.
S cenario 1 (Green line): Price to hit 585.5$ then close 1H above the level, bringing it back to us for a bounce.
Scenario 2 (Red line): Price retraces till 579 and gets a bounce from there. I believe 579 is the strongest zone for buyers. I will be buying calls once we hit there.
💬 For detailed insights and broader market context, please check my Substack link in profile.
⚠️ For educational purposes only. This is not financial advice.
Daily SPY (US500) Outlook - Prediction (12 NOV)Daily SPY (US500) Outlook - Prediction (12 NOV)
📊 Market Sentiment
The market continues to lean bullish following the potential resolution of the U.S. government shutdown, along with the proposed $2,000 incentives for U.S. citizens. These developments could drive stronger inflows into equities and sustain short-term positive sentiment.
📈 Technical Analysis
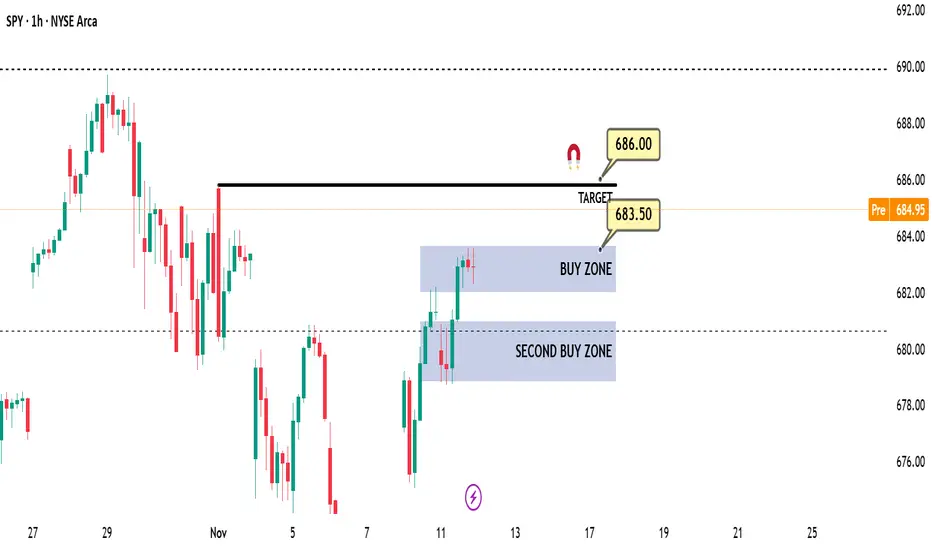
Price moved higher overnight, likely targeting the 686 level, supported by strong momentum carried over from the Dow Jones (US30).
📌 Game Plan
In my opinion, I will look to buy if the price retraces to the 683.5–682 zone for a potential continuation move toward 686.
However, if we see a strong breakout below 682 and a 4H candle close beneath that level, I plan to exit my position. Another possible bounce could occur around 681, but confirmation would be required before entering such a trade.
💬For detailed insights and broader market context, please check my Substack link in profile.
⚠️ For educational purposes only. This is not financial advice.
Is Meta Share Price About To Get Better?Meta hasn’t been kind to the bulls in recent weeks, falling around 25% from its August high. However, with bullish price action emerging near a key support cluster, it may finally be time for buyers to step in.
Matt Simpson, Market Analyst at City Index.

Weekly SPY (US500) Outlook - Prediction (09 NOV)Weekly SPY Outlook - Prediction (09 NOV)
📊 Market Sentiment
Market sentiment remains slightly bearish as expectations for a December rate cut may be pushed into 2026. We have seen some sell-offs, likely due to hedging or profit-taking activity. However, the market experienced a healthy bounce last Friday, as anticipated in my previous Daily SPY Outlook on November 7.
Today, Trump announced that American citizens, excluding high-income individuals, will receive a $2,000 payment. This news could inject additional liquidity into risk assets, similar to what occurred during his first term. In my opinion, this development may create a short-term bullish narrative for the markets.
📈 Technical Analysis
Price retraced throughout the week and reached the 663 level, where it bounced as expected from my November 7 outlook. The 663 zone represents the most discounted range (based on my quarterly range theory, 0.75 fib level), which I consider an optimal buy area. This level also coincides with daily swing liquidity, and the reaction suggests a potential move toward new all-time highs.
📌 Game Plan
I’m considering two possible scenarios for this week:
Scenario 1 (Black Line):
In my opinion, the price now has enough momentum to extend higher and create new all-time highs. Therefore, I’ll be watching for a daily close above the 671 level. If confirmed, I plan to buy SPY calls targeting new highs.
Scenario 2 (Red Line):
If the price fails to close above 671, it may indicate that more accumulation is needed before another upward move. In that case, I’ll look to short (buy puts) toward the 657 level and observe whether we can bounce from there. Should that happen, I’ll then switch to calls and target higher levels.
💬For detailed insights and broader market context, please check my Substack link in profile.
⚠️ For educational purposes only. This is not financial advice.

NASDAQ is Nearing an Important Resistance Line.Hey traders, in tomorrow's trading session we are monitoring NAS100 for a selling opportunity around 25,500 zone, NASDAQ is trading in a downtrend and currently is in a correction phase in which it is approaching the trend at 25,500 support and resistance area.
Trade safe, Joe.

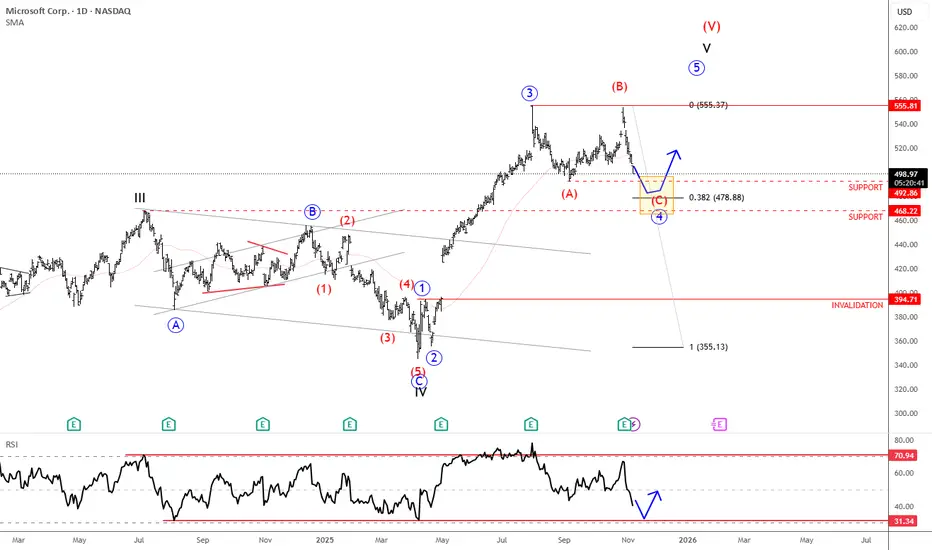
Microsoft Is Finishing Wave 4 CorrectionMicrosoft is in a wave 4 correction, and once it's fully completed, it can extend the rally within wave 5 from a technical point of view and according to Elliott wave theory.
Microsoft is a global technology company founded by Bill Gates and Paul Allen in 1975. It’s best known for its Windows operating system, Microsoft Office suite, and cloud platform Azure. Over the years, Microsoft has expanded into gaming (with Xbox), professional networking (LinkedIn), and AI (through partnerships like OpenAI). Today, it’s one of the world’s most valuable and influential companies, shaping software, hardware, and cloud computing industries.
Microsoft reported earnings last Wednesday after the close, with the price turning lower after reaching new highs. The structure still appears to be a wave four in progress — a flat correction where the current drop likely represents wave C. Wave C often stabilizes near wave A levels, suggesting support around 492 and 468 (the former 2024 high). Holding this zone could set up the next rebound into the final higher-degree wave five.
Highlights:
Trend: Corrective phase, wave C of flat in progress
Potential: Rebound toward new highs once support holds
Support: 492 / 468
Invalidation: Below 394
Note: Watch for stabilization at support before potential wave five continuation
SWING IDEA - CHAMBAL FERTILIZERSChambal Fertilizers , a leading manufacturer of fertilizers and agri-products in India, is presenting a compelling swing trade setup with strong technical indicators.
Reasons are listed below :
Break of Cup and Handle Pattern : A classic bullish continuation pattern indicating potential for a significant upside.
Bullish Marubozu Candle : A strong bullish marubozu candle on the weekly timeframe highlights sustained buying pressure.
500 Zone Breakout : The price is attempting to break above the 500 resistance zone after consolidating near its all-time high, signaling strength.
Prolonged Consolidation Breakout : The stock is breaking out of a consolidation phase spanning over 3 years, suggesting a fresh trend initiation.
Target - 675
Stoploss - weekly close below 440
DISCLAIMER -
Decisions to buy, sell, hold or trade in securities, commodities and other investments involve risk and are best made based on the advice of qualified financial professionals. Any trading in securities or other investments involves a risk of substantial losses. The practice of "Day Trading" involves particularly high risks and can cause you to lose substantial sums of money. Before undertaking any trading program, you should consult a qualified financial professional. Please consider carefully whether such trading is suitable for you in light of your financial condition and ability to bear financial risks. Under no circumstances shall we be liable for any loss or damage you or anyone else incurs as a result of any trading or investment activity that you or anyone else engages in based on any information or material you receive through TradingView or our services.
@visionary.growth.insights
