$STLAM , Stellantis Idea Setup ENTRY : CMP
TP1 : **
TP2 : **
TP3 : **
TP4 : **
SL : If you wish
** FULL SETUP AVAILABLE**
My SL is never a SELL, just an alarm to stop adding money and wait for better dca
Follow, Boost, Join, Thank You !
Financial Disclaimer:
This post is not financial advice. I am not your financial advisor, your life coach, or your legally responsible adult.
Always do your own research and never trade based solely on internet comedy.
Europeanstocks
Germany 40 Holds Key Support — Breakout or Another Pullback?Market Structure
Germany 40 remains within a short-term bearish structure on the 4-hour chart. After failing to sustain its previous rally, the index has continued to produce lower highs while stabilizing above an important support area. Recent price action suggests selling pressure has eased, but buyers have yet to reclaim key resistance. Until that happens, sellers retain a slight short-term advantage.
Market Sentiment – Neutral to Moderately Bearish
Market sentiment is neutral to modera
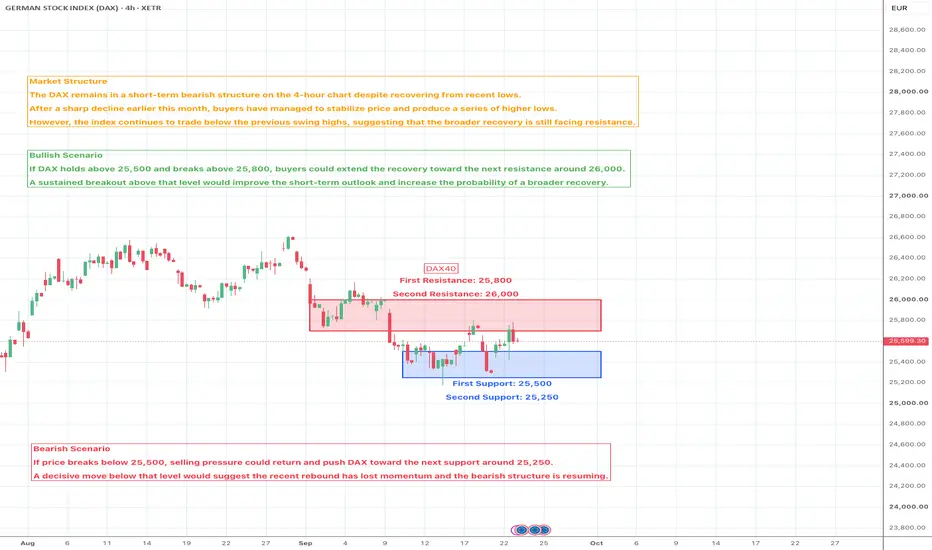
DAX Rebounds from Support — Can Bulls Recover the 26,000 Level?Market Structure
The DAX remains in a short-term bearish structure on the 4-hour chart despite recovering from recent lows. After a sharp decline earlier this month, buyers have stabilized price and produced a series of higher lows. However, the index continues to trade below the previous swing highs, suggesting the broader recovery still faces resistance.
Market Sentiment - Moderately Bearish
Market sentiment is moderately bearish. Buying interest has improved following the recent rebound
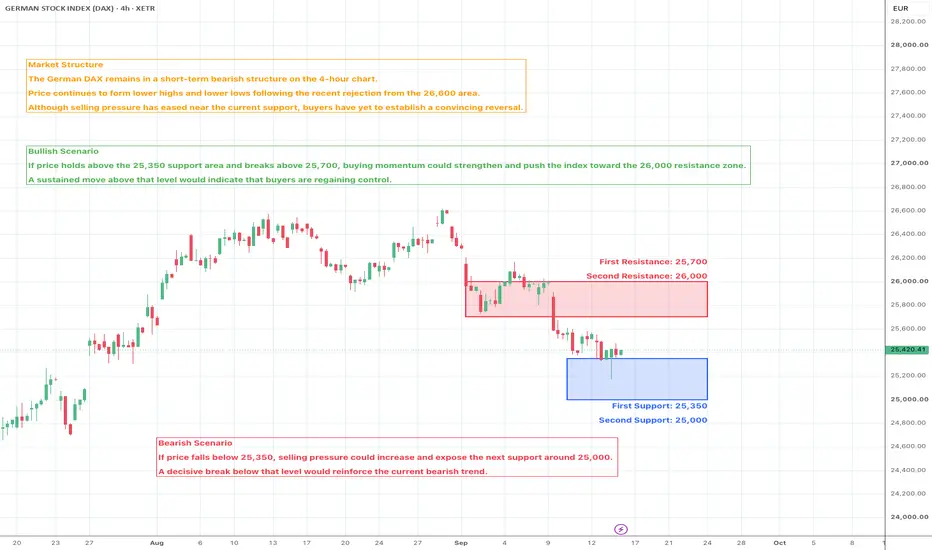
DAX Tests a Major Support Zone – Can Buyers Turn the Tide?Market Structure
The German DAX remains in a short-term bearish structure on the 4-hour chart. Price continues to form lower highs and lower lows following the recent rejection from the 26,600 area. Although selling pressure has eased near the current support, buyers have yet to establish a convincing reversal.
Market Sentiment - Bearish
Despite signs of stabilization near support, the broader trend remains under pressure. Until price reclaims key resistance levels, the short-term outlook
NORW | Continued growth ETF- Timeframe: Weekly
- Trade type: Buy stop order
- Price: 32.72
- Take Profit: Open
- Stop Loss: 31.59 (-3.40 %)
Idea: Long on a breakout above last week's high - bullish momentum continuation.
Entry: Buy stop above last week’s high.
Stop-loss: Below the low of the same candle.
If the weekly candle closes below this level, the trade is invalidated.
Take Profit: Trailing stop following the lows of new weekly candles.
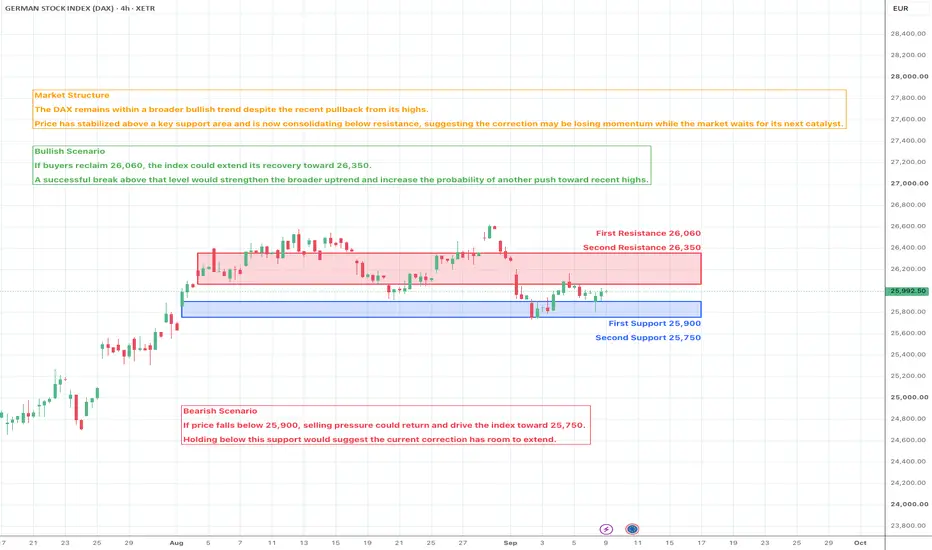
DAX Consolidates Above Support — Can Buyers Regain Momentum?Market Structure
The DAX remains within a broader bullish trend despite the recent pullback from its highs. Price has stabilized above a key support area and is now consolidating below resistance, suggesting the correction may be losing momentum while the market waits for its next catalyst.
Market Sentiment - Neutral to Slightly Bullish
Market sentiment remains cautiously optimistic. Buyers continue defending support, but a decisive break above nearby resistance is still needed to confirm
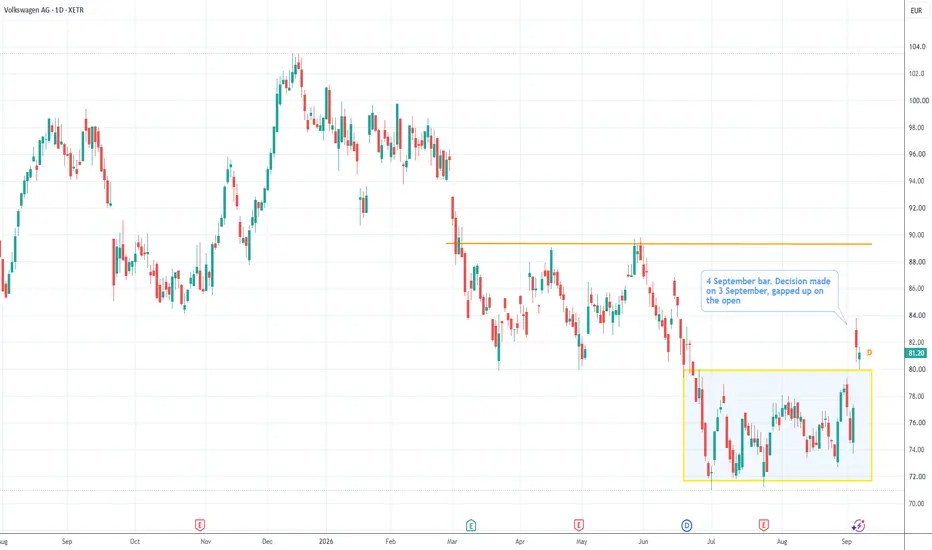
The German Auto DiscountLast Thursday evening, Volkswagen's supervisory board unanimously approved Zukunftsplan 2030 — the Future Plan. On Friday the shares closed up about 6.5% at €81.30, the strongest name in the Stoxx 600 that day.
Nothing about the company's earnings changed in those 24 hours. What changed was that a room full of people who had been unable to agree, agreed.
What was approved
Around 50,000 further positions go, management included, on top of roughly 50,000 already agreed since late 2024. The mo
DAX Pulls Back Into Support — Will Buyers Step In Again?Market Structure
DAX remains within a broader bullish structure despite the latest pullback. The recent decline appears to be a corrective move after failing to sustain a breakout above the recent highs. Price is now approaching an important support zone where buyers may attempt to regain control. Unless this support breaks decisively, the primary uptrend remains technically intact.
Market Sentiment - Moderately Bullish
Although short-term momentum has weakened following the recent rejecti
DAX Rebounds From Support – Can Bulls Regain Control?Market Sentiment
Moderately Bullish: Market sentiment remains cautiously optimistic. Buyers have started to respond near support, but stronger bullish confirmation will require a decisive move back above nearby resistance.
────────────────────
Market Outlook
The recent decline appears to be a normal correction within the broader upward trend rather than a confirmed trend reversal. Price is now attempting to recover after finding support, and the next directional move will likely depend on
DAX - Is Another Breakout Around the Corner?Market Structure
The 4-hour structure remains bullish. Price continues to print higher highs and higher lows, confirming that buyers remain in control despite the recent sideways consolidation.
Key Resistance
First Resistance: 26,450–26,500
This is the immediate resistance zone where recent buying momentum has begun to slow.
Second Resistance: 26,600–26,700
A confirmed breakout above the current highs could expose this next upside objective and reinforce the broader uptrend.
Key Support
DAX Climbs Toward Record Highs – Can Buyers Extend the Breakout?Market Structure
The 4-hour chart remains firmly bullish. Price continues to print higher highs and higher lows, confirming that the medium-term uptrend remains intact.
Key Resistance
First Resistance: 26,350–26,450
This is the immediate resistance area where recent buying momentum has slowed slightly.
Second Resistance: 26,600–26,700
A clean breakout above the current highs could expose this next upside objective and keep the bullish trend intact.
Key Support
First Support: 26,100–26
DAX Pushes Higher – Can Bulls Extend the Breakout?Market Structure
The market structure is bullish, with higher highs and higher lows continuing to develop after the recent breakout.
Key Resistance
First Resistance: 26,000–26,100
Price is currently testing this resistance zone, which could temporarily slow the advance.
Second Resistance: 26,350–26,500
A confirmed breakout above 26,100 could open the door for a move toward this next upside target.
Key Support
First Support: 25,700–25,800
This recent breakout area now serves as the fir
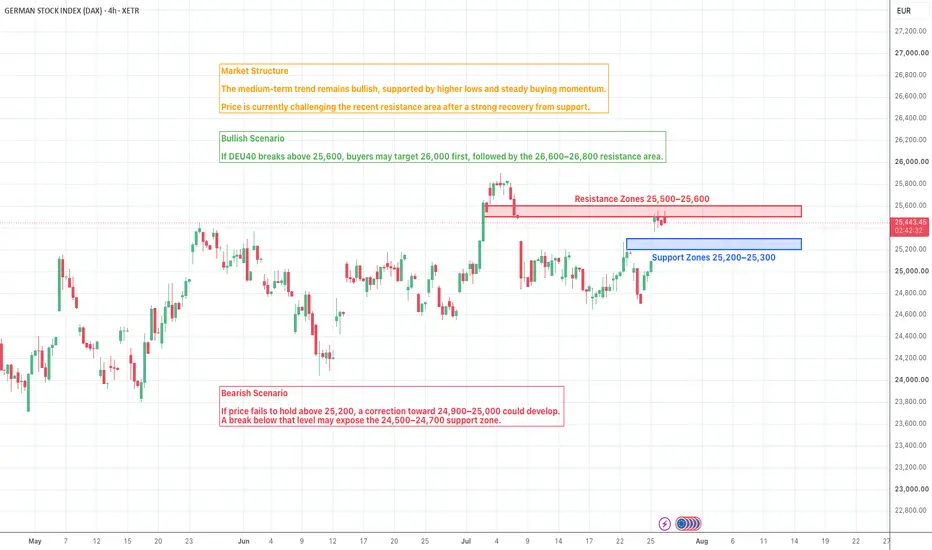
DEU40 Tests Resistance — Can Bulls Push Toward New Highs?Market View
DEU40 remains in a constructive bullish structure on the 4H chart after recovering from the recent pullback.
The latest rebound has lifted the price back toward the upper boundary of the recent trading range, showing that buyers have regained short-term control. However, the index is now approaching a resistance zone where selling pressure could increase.
As long as higher lows continue to form, the broader bullish outlook remains intact.
Key Resistance
First resistance: 25,5
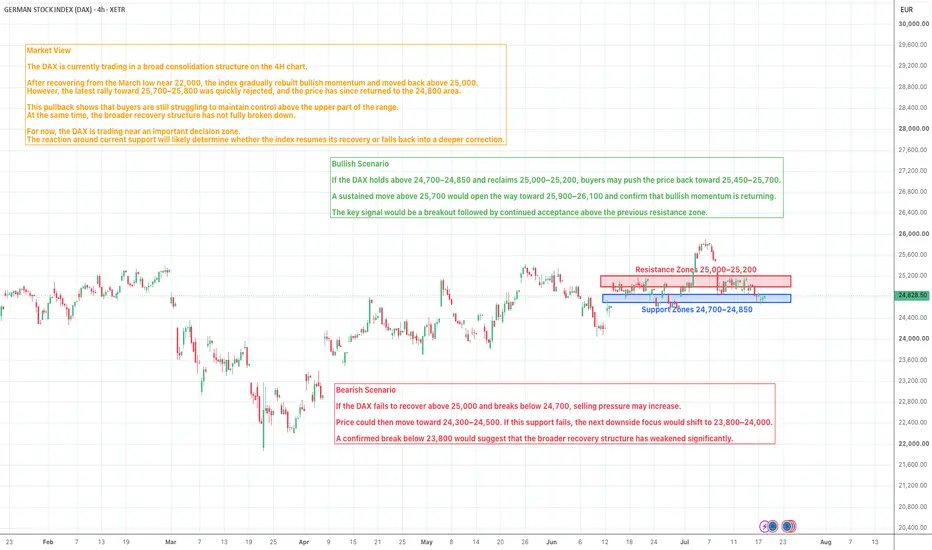
DAX Returns to a Key Support AreaMarket Structure
The DAX remains in a broad sideways structure with a neutral short-term bias.
The recovery from the March low created a series of stronger lows, but the index has repeatedly failed to build a sustained breakout above the 25,200–25,700 region.
Recent price action reflects a balanced market rather than a clear trend. Buyers continue to defend the lower part of the range, while sellers remain active near the recent highs.
A confirmed move outside the current range would provid
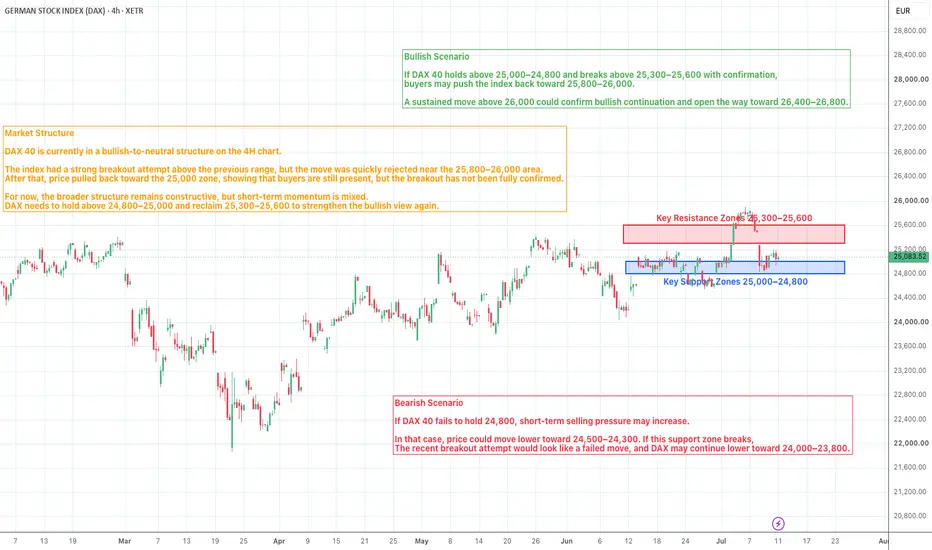
DAX 40 4H — Pullback After a Breakout SpikeDAX 40 4H — Pullback After a Breakout Spike: Can Buyers Defend 24,800?
Market View
DAX 40 is currently trading around the 25,000–25,100 area on the 4H chart. After moving sideways for several weeks, the index made a sharp breakout attempt above the 25,600–25,800 zone, but the move quickly lost momentum and price pulled back toward the previous consolidation area.
This kind of price action shows that buyers are still active, but the market is not in a clean continuation phase yet. The recent
DAX 40 Breaks HigherDAX 40 Breaks Higher — Can Bulls Extend the Rally After a Strong Breakout?
DAX 40 is showing strong bullish momentum on the 4H chart. After spending several weeks in a consolidation structure around the 24,500–25,000 area, the price finally broke higher and is now testing the 25,700–25,800 zone. The latest move suggests that buyers have regained control, but the index is also approaching a short-term resistance area where profit-taking may appear.
From a market structure perspective, DAX 40 is
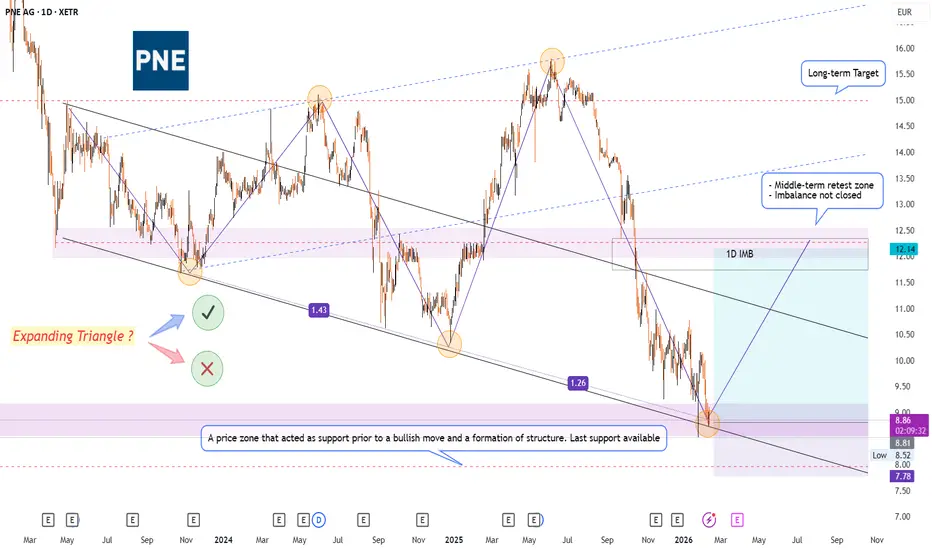
PNE AG: A juicy entry point or a trap for long-term investors?XETR:PNE3 is sitting on a 'make-or-break' intersection of multi-year levels—here’s why the next move could either ignite a 60% rally or trigger a free fall
Technicals:
- price is testing the intersection of the lower boundary of the 2023 downtrend and that global support zone from 2021
- if market sentiment turns negative and price breaks support, a free fall toward 7.90 seems likely — that’s basically the last barrier holding the price up
- if the positive scenario plays out, look for
"STOXX50/EURO50" Index Market Money Heist (Day / Swing Trade)🌟Hi! Hola! Ola! Bonjour! Hallo! Marhaba!🌟
Dear Money Makers & Robbers, 🤑💰✈️
Based on 🔥Thief Trading style technical and fundamental analysis🔥, here is our master plan to heist the "STOXX50/EURO50" Index CFD Market. Please adhere to the strategy I've outlined in the chart, which emphasizes short entry. Our aim is the high-risk Green MA Zone. Risky level, oversold market, consolidation, trend reversal, trap at the level where traders and bullish robbers are stronger. 🏆💸"Take profit and treat your
CAC40 #HVF for a doubleBig Pattern = Big Moves
Long consolidations = Fast Breakouts
The #NIKKEI had a beautiful chart pattern and we are seeing the explosive up moves occur in that market.
The French stock market - along much Europe hasn't done much for over two years
But we are quickly approaching Target 1 of a large --- non conventional HVF
Is it monetary stimulus or economic growth that causes the CAC to double?
Don't know ...
One is more desirable of course.
But the same boys
cheering the US stock marke
EURO STOXX 50 Weekly Volatility Forecast 17-21 October 2022 EURO STOXX 50 Weekly Volatility Forecast 17-21 October 2022
We can see that currently the volatility is around 4.14%, falling from 4.33% of the last week.(using DAX volatility, which is highly correlated with euro stoxx 50/600)
At the same time, its currently place on the 75th percentile based on the ATR calculations.
With this in mind, around this percentile, we can expect an average weekly movement from the open price of the candle of:
In case of a Bullish movement : 1.94%
In case of a Beari
MC (LVMH) in a decisive situationThe long term consensus for EURONEXT:MC is still bullish . In this bullish context , it has formed a flag pattern on the daily chart which is a continuation pattern looking to be confirmed by a breakout . If this pattern is confirmed by a significant breakout and a close above the upper line , then the price would have a high probability to continue upwards toward the (847-852) area .
If price fails to break above the upper line and breaks below the lower line , then we could wait for price t
ADYEN Reaches the COVID Bottom of this ChannelEURONEXT:ADYEN has just reached the point I have been anticipating since my stream on 16 December 2021. In the sloped trend lines I have drawn, the current price aligns directly with the COVID bottom in March 2020. I'm trying to find other signs of reversal, but I can't find any except the wick on the current candle which still has three trading days to close.
I would like to keep this in sight. Looking at the S&P500, I concluded in yesterday's stream that we will not get a V-shaped recovery
European equities facing a headwindThe European equity index is a tough one to analyses. The index has had a strong recovery, however, there are still structural headwinds that the EU faces. Interest rates in the EU zone are unlikely to rise anytime soon whilst the Euro is likely to be deflationary going forward.
The trading signals suggest that the index has reached a high point and needs a correction to the downside. Whether that's temporary or signals a consolidation range, remains to be seen.
Please like and follow for da
One last push before everyone starts to take profits (Europe 50)4000 is an interesting number for Europe 50 index. This is the value that acted as resistance in July 2007 which reversed around 80% of upward movement. Also, this was the highest point before the 2008 market crash.
Europe 50 is increasing at an increasingly fast rate near a powerful resistance which could only be explained by one scenario. The market could very well be pushing the price upward before start taking profits. It wants to test the 4000 limit so bad, it barely tested the previous hi