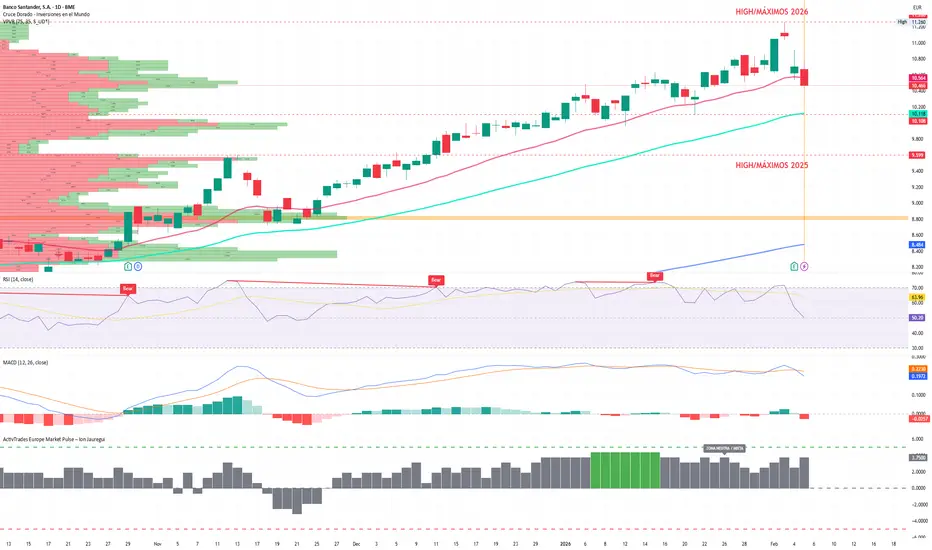
Madrid, Epicenter of the “European Bizum”: Who Benefits from it?Madrid, Epicenter of the “European Bizum”: Who Benefits from the New Era of Payments
Ion Jauregui – Analyst at ActivTrades
Madrid is preparing to become the capital of a structural change in the European financial system. The headquarters of the future pan-European instant payment system, backe
Banco Santander, S.A.
No trades
No trades
Peers for comparison
1.104 EUR
14.10 B EUR
65.06 B EUR
14.36 B
Last report date
—
Report period
—
EPS
—
Revenue
—
Earnings release details
Record 9M underlying profit reached EUR 11.2bn as revenue growth and transformation gains lifted RoTE to 16%. 2026 profit is expected above EUR 15bn including M&A, with CET1 projected above 12.8% at year-end.
Company info
Sector
Industry
CEO
Héctor Blas Grisi Checa
Website
Headquarters
Madrid
Founded
1857
IPO date
Jan 22, 1990
ISIN
ES0113900J37
FIGI
BBG000K65LJ1
Identifiers
ISIN ES0113900J37
Banco Santander SA is a banking services company, which engages in the provision of banking services to individuals, companies, and institutions. It operates through the following segments: Europe, North America, South America, and Digital Consumer Bank. The Europe segment comprises business activities carried out in the region. The North America segment includes business activities in Mexico and the United States. The South America segment involves financial activities of the Group through its banks and subsidiary banks in the region. The Digital Consumer Bank segment includes Santander Consumer Finance, which incorporates the entire consumer finance business in Europe, Openbank, and ODS. The company was founded on March 21, 1857 and is headquartered in Madrid, Spain.
Santander distances itself from European acquiring WebsterSantander distances itself from European banking with the acquisition of Webster in the U.S.
By Ion Jauregui – Analyst at ActivTrades
Banco Santander has taken a decisive step in its international growth strategy with the acquisition of Webster Bank for €10.3 billion, one of the largest cross-b
SAN: Banking Behemoth Catching Its BreathBanco Santander has been on an absolute tear lately. You don't often see a massive diversified bank put up a monster run like this, racking up a staggering 161% gain over the last twelve months. It has been the definition of relative strength and a standout performer in the financial sector.
The b
Santander at the gates of the 100 billion markBy Ion Jauregui - ActivTrades Analyst
Santander, the second largest listed company on the IBEX 35, is on the verge of reaching a new milestone: regaining €100 billion in market capitalization. This figure, not seen since 2015, marks a turning point in the trajectory of the bank, which consolidates
Is a U.K. turnaround looming for Santander?Banco Santander (BME: SAN) could be considering a major strategic shift: its exit from the UK market after two decades of operations, according to recent speculation. Since the acquisition of Abbey National in 2004, the UK has been a key market for the Spanish bank. However, operational challenges,
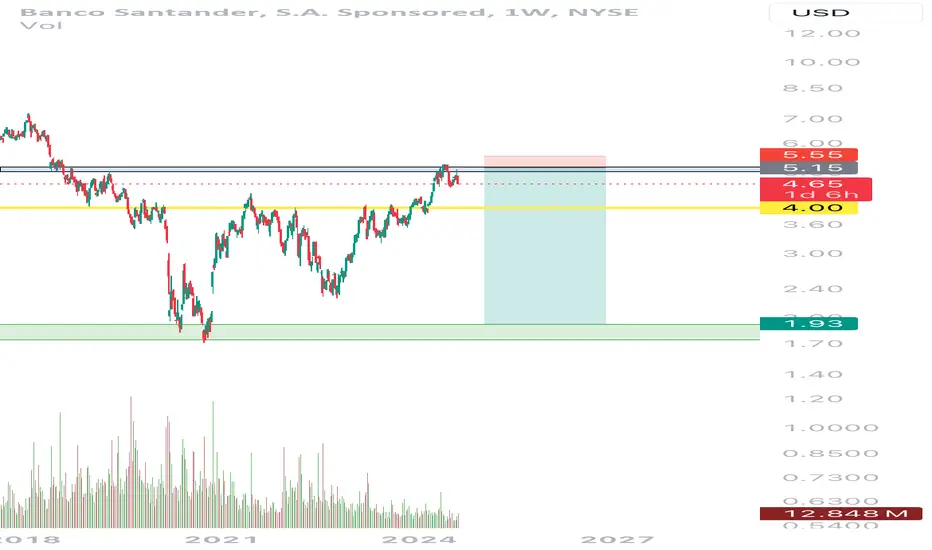
Santander Bank Put Options *I am in no way a financial advisor and you should always do your own due diligence before placing any trade. Do not trade what you are not comfortable with losing. No trade is guaranteed.
Price is pushing off of strong resistance level and looks like it’s heading towards support level prices on th
Banco Santander Offers Bitcoin & Ethereum Trading In SwitzerlandSantander bank will let wealthy domestic account holders of Switzerland trade Bitcoin, Ethereum through digital wallets.
Financial service giant and retail bank Banco Santander announced that they will offer Bitcoin and Ethereum trading options to Switzerland account holders. The trading option is
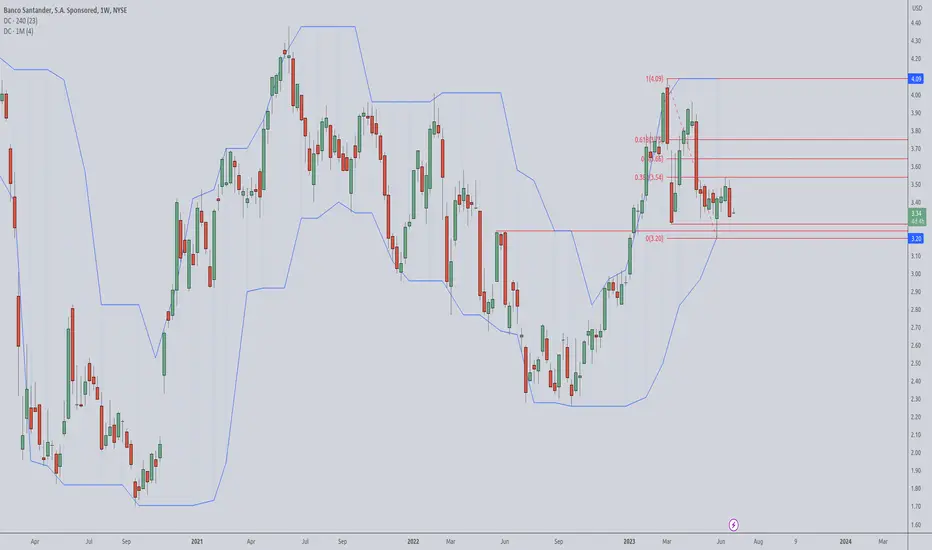
BottomingThe recent bottom is valid since March. From May to June 2022 it was a top for weeks which confirms the importance of the bottom now.
The rise since September 2022 has been retraced as well as the decline since April.
The price is in an equilibrium now and a decision is immanent. As we are at an i
See all ideas
Summarizing what the indicators are suggesting.
Neutral
Neutral
Neutral
An aggregate view of professional's ratings.
Neutral
Neutral
Neutral
Displays a symbol's price movements over previous years to identify recurring trends.
Maturity dateAug 8, 2033
Coupon6.92% (Fixed)
Maturity dateMar 14, 2034
Coupon6.35% (Fixed)
Maturity dateJan 23, 2031
Coupon6.50% (Fixed)
Maturity dateNov 6, 2035
Coupon5.13% (Fixed)
Maturity dateApr 15, 2036
Coupon5.44% (Fixed)
Maturity dateJul 19, 2027
Coupon4.80% (Fixed)
Maturity dateDec 10, 2029
Coupon5.62% (Fixed)
Maturity dateJan 23, 2029
Coupon5.80% (Fixed)
Maturity dateJun 11, 2029
Coupon5.50% (Fixed)
Maturity dateDec 3, 2030
Coupon2.75% (Fixed)
Maturity dateJan 17, 2031
Coupon5.38% (Fixed)
See all SAN bonds
Frequently asked questions
Today, SAN trades at 10.940 EUR.
For broader market analysis, dive into the technicals on the Banco Santander, S.A. stock price chart and read the latest SAN news:
– Weekly Recap: Dividend rises 10% and CET1 ratio seen near 13%
– Santander Holdings USA, Inc. Announces Preferred Dividend and Redemption of All Outstanding Depositary Shares Representing Interests in Its Fixed-Rate Reset Non-Cumulative Perpetual Preferred Stock, Series H
– Opportunity to Earn More on Savings Reemerging as Middle-Income Households Seek to Offset Price Pressures
For broader market analysis, dive into the technicals on the Banco Santander, S.A. stock price chart and read the latest SAN news:
– Weekly Recap: Dividend rises 10% and CET1 ratio seen near 13%
– Santander Holdings USA, Inc. Announces Preferred Dividend and Redemption of All Outstanding Depositary Shares Representing Interests in Its Fixed-Rate Reset Non-Cumulative Perpetual Preferred Stock, Series H
– Opportunity to Earn More on Savings Reemerging as Middle-Income Households Seek to Offset Price Pressures
Markets don't sleep, here's what's going on with SAN at the moment:
– Weekly Recap: Dividend rises 10% and CET1 ratio seen near 13%
– Santander Holdings USA, Inc. Announces Preferred Dividend and Redemption of All Outstanding Depositary Shares Representing Interests in Its Fixed-Rate Reset Non-Cumulative Perpetual Preferred Stock, Series H
– Opportunity to Earn More on Savings Reemerging as Middle-Income Households Seek to Offset Price Pressures
See more updates in real-time with our News Flow.
– Weekly Recap: Dividend rises 10% and CET1 ratio seen near 13%
– Santander Holdings USA, Inc. Announces Preferred Dividend and Redemption of All Outstanding Depositary Shares Representing Interests in Its Fixed-Rate Reset Non-Cumulative Perpetual Preferred Stock, Series H
– Opportunity to Earn More on Savings Reemerging as Middle-Income Households Seek to Offset Price Pressures
See more updates in real-time with our News Flow.
Banco Santander, S.A. is scheduled to release its next earnings report on Feb 3, 2027.
Why it matters:
– Key event: Earnings often drive significant price moves
– Market expectations: Traders watch revenue, EPS, and guidance vs forecasts
– Volatility spike: Price swings can increase before and after the release
How to use it:
– Track upcoming reports in the Earnings Calendar
– Compare actual results with analyst estimates
– Monitor price reaction and volume on Supercharts
Why it matters:
– Key event: Earnings often drive significant price moves
– Market expectations: Traders watch revenue, EPS, and guidance vs forecasts
– Volatility spike: Price swings can increase before and after the release
How to use it:
– Track upcoming reports in the Earnings Calendar
– Compare actual results with analyst estimates
– Monitor price reaction and volume on Supercharts
SAN stock is 3.33% volatile and has beta coefficient of 1.73.
What it means:
– Volatility: Shows how much the price fluctuates over time
– Beta > 1: More volatile than the market
– Beta < 1: Less volatile, more stable
Important to know:
– Volatility can increase during earnings, news events, or market stress
– Large-cap stocks like SAN are typically less volatile than smaller companies
Track every detail on Banco Santander, S.A. stock chart and check out the list of the most volatile stocks — is Banco Santander, S.A. there?
What it means:
– Volatility: Shows how much the price fluctuates over time
– Beta > 1: More volatile than the market
– Beta < 1: Less volatile, more stable
Important to know:
– Volatility can increase during earnings, news events, or market stress
– Large-cap stocks like SAN are typically less volatile than smaller companies
Track every detail on Banco Santander, S.A. stock chart and check out the list of the most volatile stocks — is Banco Santander, S.A. there?
To understand the SAN stock performance, it's worth checking price changes for various periods to get the full picture:
– 1 day — −1.18%
– 1 week — +3.58%
– 1 month — −13.43%
SAN all-time low was 1.224 EUR (Oct 5, 1992), and its highest price is 13.120 EUR (Aug 13, 2026). Find more dynamics in the Stock Heatmap and on the Banco Santander, S.A. stock chart.
– 1 day — −1.18%
– 1 week — +3.58%
– 1 month — −13.43%
SAN all-time low was 1.224 EUR (Oct 5, 1992), and its highest price is 13.120 EUR (Aug 13, 2026). Find more dynamics in the Stock Heatmap and on the Banco Santander, S.A. stock chart.
Banco Santander, S.A. market capitalization is 156.07 B, representing the total value of all its outstanding shares (price × shares outstanding).
What it means:
– Market cap is one of the key ways to classify companies (large-cap, mid-cap, etc.)
– It reflects how investors value the company today
– It changes constantly with stock price movements
What to look at next:
– Market cap trends: Rising cap may signal growth and investor confidence; falling cap can reflect risk or downturns
– Price vs shares: Changes can come from Banco Santander, S.A. stock price moves or share count (buybacks, issuance)
– Valuation ratios: Compare market cap with revenue and earnings
– Peer comparison: See how Banco Santander, S.A. stacks up against other companies
What it means:
– Market cap is one of the key ways to classify companies (large-cap, mid-cap, etc.)
– It reflects how investors value the company today
– It changes constantly with stock price movements
What to look at next:
– Market cap trends: Rising cap may signal growth and investor confidence; falling cap can reflect risk or downturns
– Price vs shares: Changes can come from Banco Santander, S.A. stock price moves or share count (buybacks, issuance)
– Valuation ratios: Compare market cap with revenue and earnings
– Peer comparison: See how Banco Santander, S.A. stacks up against other companies
The safest way to buy Banco Santander, S.A. stocks is through a reliable broker. Create an account, fund it, and place a buy order.
You can trade SAN directly from TradingView:
– Choose a broker: Explore our supported trading partners and pick one that fits your needs
– Compare options: View available brokers side by side to evaluate fees and features
– Connect your account: Open Supercharts, click “Trade”, select your broker, and log in
– Start trading: Place orders without leaving the chart
Tip: If you’re new to trading, try paper trading first — it lets you practice strategies in real market conditions without risking funds.
You can trade SAN directly from TradingView:
– Choose a broker: Explore our supported trading partners and pick one that fits your needs
– Compare options: View available brokers side by side to evaluate fees and features
– Connect your account: Open Supercharts, click “Trade”, select your broker, and log in
– Start trading: Place orders without leaving the chart
Tip: If you’re new to trading, try paper trading first — it lets you practice strategies in real market conditions without risking funds.
As of Nov 9, 2026, the company has 198.4 K employees.
Why traders follow this data:
– Company scale: Employee count reflects the size and global reach of the business
– Operational footprint: Higher headcount often indicates broader product lines, retail presence, or services
– Trend signal: Changes over time can reflect hiring growth, restructuring, or efficiency improvements
See our rating of the largest employers to find more opportunities.
Why traders follow this data:
– Company scale: Employee count reflects the size and global reach of the business
– Operational footprint: Higher headcount often indicates broader product lines, retail presence, or services
– Trend signal: Changes over time can reflect hiring growth, restructuring, or efficiency improvements
See our rating of the largest employers to find more opportunities.
Banco Santander, S.A. pays dividends, but whether it is a “good” dividend stock depends on its yield and stability rather than dividends alone.
Its recent dividend yield was around 1.93%, with a payout ratio of 21.48%, compared to 3.81% and 22.05% in the previous period.
What to look at when looking for good dividend stocks:
– Dividend yield: Income potential relative to price
– Payout ratio: Sustainability of dividend payments
– Dividend history: Consistency and growth over time
– Earnings strength: Dividends are more reliable when supported by stable profits
– Total return: Combines dividends with stock price performance
Explore all this in Banco Santander, S.A. financials.
Its recent dividend yield was around 1.93%, with a payout ratio of 21.48%, compared to 3.81% and 22.05% in the previous period.
What to look at when looking for good dividend stocks:
– Dividend yield: Income potential relative to price
– Payout ratio: Sustainability of dividend payments
– Dividend history: Consistency and growth over time
– Earnings strength: Dividends are more reliable when supported by stable profits
– Total return: Combines dividends with stock price performance
Explore all this in Banco Santander, S.A. financials.
Investing in Banco Santander, S.A. depends on your goals, risk tolerance, and market conditions. It’s essential to analyze the stock before making a decision.
First, study Banco Santander, S.A. financials and track their dynamics on the Fundamental Graphs:
– Business fundamentals: Revenue, earnings, and growth trends
– Valuation: P/E ratio, market cap, and how it compares to peers
– Profitability: Margins, return on equity, and cash flow
– Dividends (if any): Yield, payout ratio, and consistency
Then explore our SAN technicals – signals based on essential indicators calculations:
– Today — sell
– 1-week — neutral
– 1-month — buy
Combine fundamental and technical analysis for better results.
First, study Banco Santander, S.A. financials and track their dynamics on the Fundamental Graphs:
– Business fundamentals: Revenue, earnings, and growth trends
– Valuation: P/E ratio, market cap, and how it compares to peers
– Profitability: Margins, return on equity, and cash flow
– Dividends (if any): Yield, payout ratio, and consistency
Then explore our SAN technicals – signals based on essential indicators calculations:
– Today — sell
– 1-week — neutral
– 1-month — buy
Combine fundamental and technical analysis for better results.
Banco Santander, S.A. stock ticker depends on the exchange where it’s listed. On the BME, its primary exchange, Banco Santander, S.A. stocks trade under the symbol SAN.
About tickers:
– Unique identifiers: A ticker is a short code used to find and trade a stock
– Exchange-specific: The same company may have different tickers across exchanges
– Search shortcut: Used on trading platforms, charts, and screeners
Remember:
– Some companies have multiple listings
– Always check the exchange prefix to avoid confusion
Learn how to find your desired assets in our Symbol Search.
About tickers:
– Unique identifiers: A ticker is a short code used to find and trade a stock
– Exchange-specific: The same company may have different tickers across exchanges
– Search shortcut: Used on trading platforms, charts, and screeners
Remember:
– Some companies have multiple listings
– Always check the exchange prefix to avoid confusion
Learn how to find your desired assets in our Symbol Search.
SAN earnings for the last quarter are 0.25 EUR per share, whereas the estimation was 0.23 EUR, resulting in a 7.75% surprise. The estimated earnings for the next quarter are 0.25 EUR per share.
How to read financials:
– Compare actual vs estimates: Earnings beats or misses often drive price moves
– Watch market reaction: Price response matters as much as the numbers
– Look at forward guidance: Future estimates signal expected growth
– Track trends: Analyze results across multiple quarters, not just one
Follow other essential metrics in Banco Santander, S.A. financials:
– Revenue growth: Shows business expansion
– Margins (operating, net): Reflect profitability and efficiency
– Free cash flow: Indicates real cash generation
– Debt levels: Impacts financial stability and risk
How to read financials:
– Compare actual vs estimates: Earnings beats or misses often drive price moves
– Watch market reaction: Price response matters as much as the numbers
– Look at forward guidance: Future estimates signal expected growth
– Track trends: Analyze results across multiple quarters, not just one
Follow other essential metrics in Banco Santander, S.A. financials:
– Revenue growth: Shows business expansion
– Margins (operating, net): Reflect profitability and efficiency
– Free cash flow: Indicates real cash generation
– Debt levels: Impacts financial stability and risk
Banco Santander, S.A. revenue for the last quarter amounts to 15.96 B EUR despite the estimated figure of 16.18 B EUR. In the next quarter revenue is expected to reach 16.86 B EUR.
How to read this data:
– Compare actual vs estimates: Revenue beats or misses can move the stock
– Watch market reaction: Price response shows how investors interpret results
– Look at growth: Compare with previous quarters and year-over-year data
– Track trends: One quarter matters less than consistent performance
Follow other essential metrics in Banco Santander, S.A. financials:
– Earnings (EPS): Profitability per share
– Margins (gross, operating): Efficiency and cost control
– Free cash flow: Cash available after expenses
How to read this data:
– Compare actual vs estimates: Revenue beats or misses can move the stock
– Watch market reaction: Price response shows how investors interpret results
– Look at growth: Compare with previous quarters and year-over-year data
– Track trends: One quarter matters less than consistent performance
Follow other essential metrics in Banco Santander, S.A. financials:
– Earnings (EPS): Profitability per share
– Margins (gross, operating): Efficiency and cost control
– Free cash flow: Cash available after expenses
Yes, you can track Banco Santander, S.A. financials in yearly and quarterly reports right on TradingView.
Use our Earnings Calendar to never miss important releases and spot opportunities early.
SAN net income for the last quarter is 3.43 B EUR, while the quarter before that showed 3.52 B EUR of net income which accounts for −2.47% change.
How to read this data:
– Track changes: Compare net income across quarters to spot trends
– Watch expectations: Compare with estimates to gauge performance
– Check margins: Net income reflects profitability after all expenses
– Look beyond one quarter: Consistency matters more than a single result
Follow other essential metrics in Banco Santander, S.A. financials:
– Revenue: Overall business growth
– Earnings per share: Rising EPS over time often points to improving business performance
– Margins (gross, operating): Efficiency and cost control
How to read this data:
– Track changes: Compare net income across quarters to spot trends
– Watch expectations: Compare with estimates to gauge performance
– Check margins: Net income reflects profitability after all expenses
– Look beyond one quarter: Consistency matters more than a single result
Follow other essential metrics in Banco Santander, S.A. financials:
– Revenue: Overall business growth
– Earnings per share: Rising EPS over time often points to improving business performance
– Margins (gross, operating): Efficiency and cost control
Banco Santander, S.A. does pay dividends, which are distributed semi-annually. The most recent dividend per share was 0.10 EUR, with a trailing twelve-month (TTM) dividend yield of 1.90%.
Explore more details on Banco Santander, S.A. dividends, look at:
– Dividend history: Check whether payouts are growing, stable, or declining
– Payout ratio: How much of earnings are paid out as dividends
– Total return: Combine price growth + dividends for full performance view
Explore more details on Banco Santander, S.A. dividends, look at:
– Dividend history: Check whether payouts are growing, stable, or declining
– Payout ratio: How much of earnings are paid out as dividends
– Total return: Combine price growth + dividends for full performance view
SAN reached its all-time high of 13.120 EUR on Aug 13, 2026. Its all-time low was 1.224 EUR and was reached on Oct 5, 1992.
Explore the Banco Santander, S.A. stock price chart to see more price history, and discover companies reaching new all-time highs and lows.
Analyst forecasts suggest a price range between 12.00 EUR and 16.00 EUR for SAN, based on current estimates.
Remember:
– Forecasts show possible scenarios, not guaranteed outcomes
– They're based on multiple analysts’ models and assumptions
– Target prices change with earnings, news, and market conditions
Don't rely on analysts' opinions alone:
– Use technical analysis: Trend, support/resistance, momentum
– Study fundamentals: Revenue, earnings, margins
– Account for market context: News, macro trends, sector performance
Remember:
– Forecasts show possible scenarios, not guaranteed outcomes
– They're based on multiple analysts’ models and assumptions
– Target prices change with earnings, news, and market conditions
Don't rely on analysts' opinions alone:
– Use technical analysis: Trend, support/resistance, momentum
– Study fundamentals: Revenue, earnings, margins
– Account for market context: News, macro trends, sector performance