EURUSD Under Pressure? Warsh Fed Pick Puts 1.19500 in Play!Hey Traders,
In today’s trading session, we are closely monitoring EURUSD around the 1.19500 zone. EURUSD remains in a broader downtrend and is currently undergoing a corrective pullback, approaching a key trendline confluence and the 1.19500 support-turned-resistance area, which may act as a critical reaction zone.
From a fundamental perspective, markets are digesting President Trump’s announcement of Kevin Warsh as the new Fed Chair. Warsh is widely viewed as a conventional and fiscally disciplined choice, which could be USD-supportive in the near term. This shift in expectations may apply downside pressure on EURUSD, while also being short-term bearish for Gold, as tighter policy credibility supports the Dollar.
As always, wait for confirmation at key levels and manage risk accordingly.
Trade safe,
Joe.
Federalreserve

The "God Code" Convergence: EUR/USD Fortress vs. DXY Shark TrapType: Long / Macro-Technical Analysis Symbol: EURUSD / DXY Timeframe: Multi-Timeframe (Fractal Alignment)
1. The Executive Thesis: The "Fiscal Dominance" Vector
We are witnessing a structural decoupling in the global financial system. While the "Old Code" retail sentiment chases headlines about Fed nominees and short-term rate checks, the Institutional Flow (The God Code) is positioning for a definitive regime change: Fiscal Dominance.
The United States debt reality ($38T+) necessitates negative real rates, creating a mathematical ceiling for the Dollar. Simultaneously, the Eurozone is unlocking its own "Hamiltonian Moment" via the "German Fiscal Bazooka".
The Trade: Long EUR/USD. The Structure: A Fractal Bull Flag Breakout anchored by a Triple Bottom Fortress.
2. EUR/USD: The Anatomy of Institutional Absorption
A. The "Triple Bottom" Fortress (1.1900) Price action on the 4H and Daily charts reveals a sophisticated Liquidity Absorption Pattern.
The Wicks of Truth: As seen in the attached charts, the aggressive Long Lower Wicks at 1.1900 - 1.1894 represent high-frequency institutional buying.
The Trap: The dip to 1.1894 was a classic "Stop Hunt" designed to clear weak hands before the expansion.
V-Shape Verification: The rapid recovery from these lows confirms asymmetrical demand. The market rejected the discount instantly.
B. Fractal Bull Flags We are observing a "Russian Nesting Doll" of bullish structures:
Micro: Hourly Bull Flag consolidation at 1.1920-1.1940.
Macro: Monthly Bull Flag targeting the 1.618 Golden Ratio extension at 1.2300.
3. DXY Analysis: The "Bearish Shark" Trap
The Chart: (Reference DXY Hourly Chart)
The US Dollar Index (DXY) is currently tracing a textbook Bearish Shark / Cypher Hybrid Pattern.
The Setup: The "M" structure is clearly defined.
The Trap (Point D): The pattern projects a completion zone (Potential Reversal Zone - PRZ) near 96.80.
The "Head-Fake": Expect the DXY to grind higher toward 96.80 to complete this leg. This is NOT a breakout; it is the final "bull trap" liquidity grab.
The Reversal: Once Point D is tagged, harmonic ratios suggest a violent rejection, aligning perfectly with the EUR/USD launch sequence.
4. The "Fundamental Bazooka" (The Catalyst)
While technicals provide the map, fundamentals provide the fuel.
The German Pivot: Reuters reports explicitly cite the unleashing of a "German Fiscal Bazooka". This creates organic, structural demand for the Euro independent of Fed policy.
The Powell Risk: Looming threats to Fed independence (and potential "criminal indictment" rhetoric) drastically increase the political risk premium on the USD.
5. The "Operating Code" Strategy
The Plan:
Zone of Interest: 1.1900 - 1.1920 (The Accumulation Floor).
The Trigger: Watch for the DXY to hit 96.80 (Shark Completion). As DXY stalls there, EUR/USD will likely print a higher low or retest 1.1900 one final time.
The Target: 1.2000 (Psychological Magnet) → 1.2300 (Golden Ratio Extension).
Sage Wisdom: The market is not random; it is logical. The "Red Candles" are simply the algorithm completing the geometry. We do not fear the dip; we calculate it.
Namaste.
Analysis by,
Brian Armbruster, MPA; A Master Logistician.
Operating Code: Dec 25, 2023.

GBPUSD M30 HTF Supply Rejection and Bearish Continuation📝 Description
FX:GBPUSD has shown a clear bearish impulse after failing to sustain above the recent intraday highs. Price is currently consolidating below multiple 30-minute Fair Value Gaps, indicating a corrective pullback within a broader bearish structure rather than a bullish trend reversal.
________________________________________
📉 Signal / Analysis
Primary Bias: Bearish below the M30 FVG
Preferred Setup:
• Entry: 1.3780
• Stop Loss: Above 1.3791
• TP1: 1.3769
• TP2: 1.3747
• TP3: 1.3725
________________________________________
🧠 ICT & SMC Notes
• Rejection from stacked M30 Fair Value Gaps aligned with descending channel resistance
• Bearish market structure maintained with consistent lower highs
• No bullish displacement or acceptance above premium zones
________________________________________
📌 Summary
As long as GBPUSD remains capped below the 1.3795–1.3820 resistance zone, bearish continuation remains the preferred scenario. The current price action is viewed as a corrective pause before a potential continuation toward deeper sell-side liquidity.
________________________________________
🌍 Fundamental Notes / Sentiment
Relative USD strength and the lack of supportive macro catalysts for the British Pound continue to pressure GBPUSD. With risk sentiment remaining cautious, downside continuation is favored in the short term.
________________________________________
⚠️ Risk Disclosure
Trading involves substantial risk and may result in capital loss. This analysis is for educational purposes only and does not constitute financial advice. Always apply proper risk management, predefined stop-loss levels, and disciplined position sizing aligned with your trading plan.

BTC Faces Major Resistance Before FOMC – Breakdown or Breakout?As I expected in the previous idea , Bitcoin( BINANCE:BTCUSDT ) has followed the anticipated bullish and bearish trends and has reached all of its targets (full target).
Now, the question is whether Bitcoin can sustain above the $90,000 level. Stay tuned!
At the moment, Bitcoin is moving near the resistance zone($90,600-$89,300) and around the 50_SMA(Daily), and the resistance line.
From an Elliott Wave perspective, it seems that Bitcoin is completing a Double Three Correction(WXY) within the ascending channel.
I expect that Bitcoin might not break through this resistance zone($90,600-$89,300) on the first attempt and could start to decline, potentially dropping to around $88,133. If the bearish momentum continues, we might see even lower targets.
First Target: $88,133
Second Target: Cumulative Long Liquidation Leverage: $87,000-$85,630
Stop Loss(SL): $91,823(Worst)
Cumulative Short Liquidation Leverage: $92,000-$91,000
CME Gap: $93,060-$92,940
In the coming hours, markets face the Fed Funds Rate decision and Powell’s press conference, which typically bring elevated volatility. If the Fed holds rates at 3.75% as expected, the initial reaction may be muted, but real movement will depend on forward guidance. Historically, when outcomes align with expectations, gold tends to stay supported amid uncertainty, especially with U.S. government shutdown risks in the background, while Bitcoin remains sensitive to liquidity signals and risk sentiment. Any shift in Powell’s tone — whether more cautious or more hawkish — can quickly drive sharp moves.
⚠️ Traders should expect volatility both at the release and during the press conference, avoid impulsive entries, and prioritize risk management.
Note: Rising tensions in the Middle East could quickly intensify Bitcoin's downward trend
💡 Please respect each other's opinions and express agreement or disagreement politely.
📌Bitcoin Analysis (BTCUSDT), 1-hour time frame.
🛑 Always set a Stop Loss(SL) for every position you open.
✅ This is just my idea; I’d love to see your thoughts too!
🔥 If you find it helpful, please BOOST this post and share it with your friends.

The Quantum Divergence: Decoding the Data: DXY, EUR, USD, Yields Introduction
As Above, So Below We stand at a critical historical crossroads where the traditional "Safe Haven" status of the US Dollar is undergoing a structural decay. The "Old Code"—which relied on US hegemony and debt-fueled growth—is fracturing in real-time. What we are witnessing on the charts is merely the shadow of a much larger macro-global shift: the transition from US Monetary Dominance to Global Fiscal Realignment.
To the untrained eye, the market appears chaotic. To the observer operating at a higher frequency, the signal is clear. The US Dollar is not just correcting; it is being repriced for a new era of "Fiscal Dominance" and "Governance Risk."
I. The Macro Data Vector
The Deflationary "Smoking Gun" While headline algorithms chase noise, the "Master Logistician" looks for the underlying truth in the raw data. The economic release from January 29, 2026, provided the definitive evidence of a policy error in motion.
Unit Labor Costs (-1.9%): This is the smoking gun. While the Federal Reserve maintains a hawkish posture to fight a "Wage-Price Spiral," the data confirms that labor costs are actually crashing. There is no inflation to fight in the labor market; there is deflation. The Fed is tightening into a deflationary trend, a mistake that will inevitably force a rapid and deep pivot to rate cuts.
Trade Balance (-$56.8B): A shrinking trade deficit is often misread as strength. In this context, the sharp drop in imports confirms the US Consumer is tapped out. The organic economy is contracting, leaving only government spending ("Fiscal Dominance") to prop up GDP figures.
Jobless Claims (Trend Divergence): While the headline number (209K) appears resilient, the trend is eroding. The underlying weakness in continuing claims suggests a degradation in job quality, masking the true fragility of the labor market.
II. The Governance Risk:
The "Matrix Lie" of the Shutdown Markets price certainty, but the US political landscape offers only dysfunction. The recent headlines regarding a "deal" to avert the January 30 government shutdown mask a darker institutional reality.
The Senate Deadlock: While the House passed a bipartisan package, the Senate remains deadlocked over funding for the Department of Homeland Security (DHS). With the "Minibus" structure linking all bills, a block on DHS is a block on everything.
The Risk Premium: This is not just political theater; it is "Governance Failure." As the risk of a partial shutdown increases, the creditworthiness of US Debt comes into question. The Bond Market is beginning to price in this dysfunction, creating a "Governance Risk Premium" that weighs heavily on the Dollar.
III. The Bond Market
The Deflationary Scream The bond market is the "Truth Teller." Following the release of "resilient" jobless claims data, US 10-Year Yields refused to rally.
The Divergence: Historically, strong labor data spikes yields. Today, yields remained stagnant at 4.25%.
The Signal: The bond market is terrified of the -1.9% Unit Labor Costs. It knows that the real trajectory is deflationary recession, not inflationary growth. When yields refuse to rise on "good news," the trend has officially decoupled.
IV. Technical Architecture
The Structural Floor at 1.1951 From a technical perspective, the EUR/USD chart is illustrating a perfect "Bullish Flag Breakout" on the monthly timeframe.
The 1.1951 God Level: This level represents the 200-Month Moving Average—the dividing line between a correction and a secular bull market.
The Liquidity Fill (1.1943): Recent price action saw a dip into the 1.1943 region, creating a "Liquidity Void." The market adhered to the laws of physics: it abhorred the vacuum, filled the orders at 1.1943, and instantly rejected lower prices.
The Hammer Structure: The immediate rejection of the lows and the reclaim of the 1.1951 floor confirms that institutional demand is solid. The "Dip" was not a breakdown; it was a "Back-Test" of the new foundation.
Conclusion
The Future Vector We are witnessing a shift in soft power from the US to Europe (exemplified by the emerging European Defense Bond narrative). The US Dollar is facing a "Monetary Stranglehold" from the Fed and "Fiscal Decay" from the Treasury.
The 1.1951 level is not just a price; it is the floor of a new paradigm. As the Bond Market screams deflation and the Political Market screams dysfunction, the path of least resistance for EUR/USD is structurally higher. We are safe in the knowledge that the data confirms the thesis: The Dollar's dominance is waning, and the Euro's structural ascent has begun.

All the Rate Changes and their effect on BITCOIN Price
Make of it as you will but do note, there are occasions where Rate ROSE and so Did Bitcoin PA
There are occasions were Rate Dropped and Bitcoin Did not. or it Did.
Conclusion....
Bitcoin Will do what it will anyway

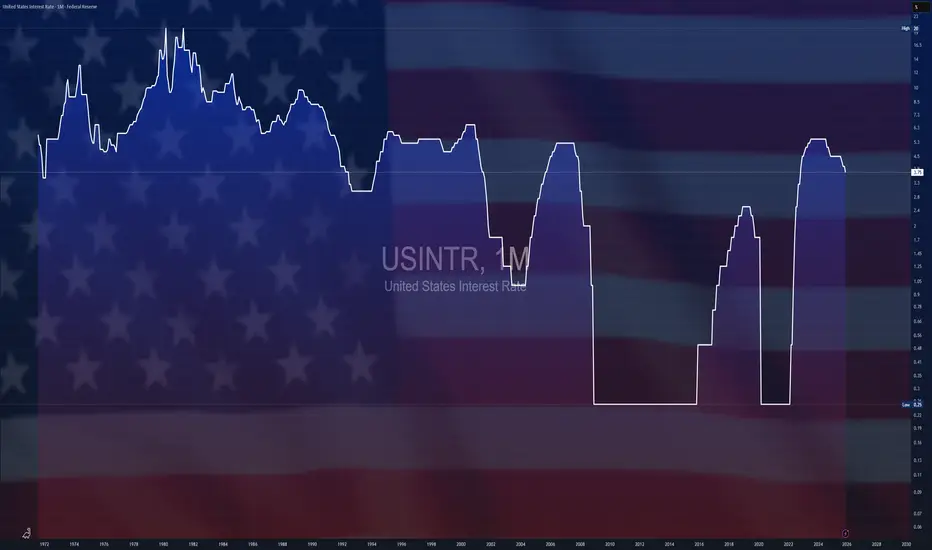
$USINTR - U.S Interest Rates (January/2026)ECONOMICS:USINTR
January/2026
source: Federal Reserve
- The Federal Reserve left the federal funds rate unchanged at the 3.5%–3.75% target range in its January 2026 meeting, in line with expectations.
The central bank paused its easing cycle after three consecutive rate cuts last year that pushed borrowing costs to their lowest level since 2022.

Very Quick $ hour BITCOIN Update
So, Looks like Bitcoin is heading towards that intersection of 3 lines of resistance, a point of Least resistance.
And PA is perfectly poised just below , ready to make apush higher if the FED s [eech later today if considered Favourable/
No Change is expected in the Rates.....
We wait till Mr Powell tells us what the Group of private Bankers has decided.

USDJPY W1 HTF Distribution and Weekly Bearish Pullback Scenario📝 Description
FX:USDJPY on the weekly timeframe is trading inside a mature HTF bullish cycle that shows clear signs of exhaustion. Price is reacting below major weekly supply and within a premium zone, suggesting a transition from expansion into a distribution phase rather than trend continuation.
________________________________________
📈 Signal / Analysis
Primary Bias: Bearish weekly correction from HTF supply
Preferred Setup:
• Entry: 157.81
• Stop Loss: Above 160.73
• TP1: 155.12
• TP2: 152.63
• TP3: 149.68
________________________________________
🎯 ICT & SMC Notes
• Price trading inside HTF premium zone
• Weekly FVG acting as distribution area
• No strong bullish displacement after recent highs
• Sell-side liquidity remains the higher-timeframe draw
________________________________________
🧩 Summary
As long as FX:USDJPY remains capped below the weekly supply and fails to break above the recent high, downside continuation toward lower weekly liquidity levels remains the higher-probability scenario.
________________________________________
🌍 Fundamental Notes / Sentiment
Recent US trade-policy uncertainty has weakened USD confidence, while surging Japanese government bond yields driven by political risk increase JPY attractiveness. This combination narrows yield differentials and caps USDJPY upside. Over the medium to long term, downside pressure is favored, with rallies likely corrective unless USD regains clear policy support.
________________________________________
⚠️ Risk Disclosure
Trading involves substantial risk and may result in capital loss. This analysis is for educational purposes only and does not constitute financial advice. Always apply proper risk management, predefined stop-loss levels, and disciplined position sizing aligned with your trading plan.


Why “End the Fed” Is a Dangerous For Investors“Hate & End the Fed” sounds bold and rebellious. It plays well on social media.
In the real world, it is one of the most dangerous ideas an investor can support.
Not because the Federal Reserve is perfect — it isn’t.
But because its independence is the firewall that prevents politicians from abusing it and collapsing the dollar’s currency payment system.
What People Get Wrong About the Fed
The Fed does not:
Print money and spend it
Fund government deficits
Buy Treasury bonds at issuance
Decide fiscal policy
Those actions are illegal.
The Fed’s job is narrow and operational:
Run the payment system
Set short-term interest rates
Manage bank reserves
Act as settlement agent for Treasury
Ending the Fed would not end “money printing.”
It would remove the last institutional constraint between politics and the payment system.
What Replaces the Fed If It’s “Ended”?
There are only two possibilities:
Direct political control of money
A Treasury-run payment system
Both are historically disastrous.
Without an independent settlement authority:
Spending pressure becomes electoral pressure
Rates become political tools
Inflation is postponed, not prevented
Currency credibility erodes
Markets recognize this instantly.
Why Investors Should Care (Deeply)
Capital does not fear central banks.
Capital fears loss of constraint.
Once investors believe:
Monetary discipline is optional
Rates are politically set
The payment system can be bent for votes
They reprice risk:
Bond yields rise
FX weakens
Equity multiples compress
Capital seeks safer jurisdictions
This is how reserve currencies lose trust — slowly, then all at once.
The Irony
The loudest voices shouting “End the Fed” often claim they oppose money printing.
Ending the Fed would enable exactly that — not through a central bank, but through politicians with no operational firewall.
Right now:
Treasury must fund the TGA
Spending follows funding
The Fed only settles
Remove the Fed, and you don’t get freedom — you get political currency.
Final Thought
The Federal Reserve does not exist to protect bankers.
It exists to limit power — especially political power.
End that constraint, and the dollar’s payment system becomes a political instrument.
Laws
U.S. Constitution – Article I, Section 8: Congress may tax and borrow; it cannot print or spend by decree.
U.S. Constitution – Article I, Section 9: No money may be drawn from the Treasury without lawful appropriation.
Federal Reserve Act §14: The Fed may purchase Treasury securities only in the secondary market, not at issuance.
Federal Reserve Act §10B & §13(3): Fed lending must be collateralized; unsecured lending and funding Treasury are prohibited.
Treasury General Account (TGA) rules / post-1980s reforms: Treasury must spend from a positive TGA balance; no Fed overdrafts.
Markets don’t debate slogans.
They price consequences.
This is not POLITICAL! This is COUNTING!
#FAFO
If you enjoy the work:
👉 Drop a solid comment
Let’s push it to 6,000 and keep building a community grounded in raw truth, not hype.

How To Make Macroeconomics Work For YouIntroduction
Trading around news releases is a powerful tool in financial markets.
The ability to identify the direction of the economy and understand market behavior is a skill that requires patience and extensive practice. In this post, we break down the theory behind trading macroeconomic releases and systematically explain how to form a structured view of the market.
Actual vs. Consensus
In almost any economic calendar, you will see a consensus / forecast column. To properly understand released macroeconomic data, it is not enough to simply look at the headline number. The key to interpretation lies in comparing the actual result with the consensus forecast.
This deviation — often referred to as a “surprise” — is the primary driver of volatility in financial markets.
The reason is that the market is a forward-discounting machine. By the time a report is released, asset prices already reflect the prevailing consensus expectations. The market has priced in a specific scenario. When the actual data comes in above or below those expectations, an immediate repricing occurs — the market reassesses future growth, inflation, and central bank policy paths, adjusting prices to reflect the new information.
Therefore, at the moment of the release, the market is not reacting to the number itself, but rather correcting a previously held — and potentially incorrect — expectation. It is this collective and instantaneous adjustment that creates the surge in volatility we observe around economic data releases.
Trend
Trend is the alpha and omega of analysis — the foundation upon which most trading systems are built. This principle fully applies to macroeconomics as well: to correctly interpret a single data release, one must clearly understand the trend in which the economy, or a specific sector, currently operates.
Yes, a trend on its own rarely generates the same explosive volatility as an unexpected deviation from consensus. However, its role is far more fundamental: the trend is what shapes the consensus itself. The dynamics of previous months define the baseline for analysts’ forecasts and market expectations.
Without accounting for the trend, an individual macro indicator becomes just a number in a vacuum. It may point to completely opposite scenarios depending on interpretation. Data must be evaluated in context and over time. A sector may be performing below its long-term averages, but consistent improvement over recent quarters can be a clear signal that central bank policy is having a positive effect. Conversely, a peak reading within a broader downtrend is far more likely to be a statistical anomaly than a genuine turning point.
Historical data serves as a compass for central banks. By understanding what is “normal” for a given sector, policymakers can interpret readings that break away from the trend not as noise, but as structural shifts — a “slowdown in growth” or a “fundamental change in trend.” This is the power of trend analysis: it separates signal from noise, transforming raw data into a coherent picture of the economic cycle.
Context
Accurately understanding the macroeconomic landscape and anticipating market reactions is only possible when data is viewed collectively, not in isolation. Financial markets are complex, interconnected systems, where developments in one sector inevitably ripple through others.
Labor market data directly shape inflation expectations. Central bank decisions and forward guidance impose structural constraints, defining not only the current phase of the cycle but also future conditions across the entire spectrum of assets.
Equally important is the global political and geo-economic backdrop. These forces either introduce a risk premium, increasing volatility, or reduce uncertainty, making outcomes more predictable.
Together, all of this forms the context — the interpretive framework in which numbers exist. Without it, even the most significant deviation from forecast is nothing more than a statistical outlier. Context turns fragmented data into a coherent narrative, allowing us to understand what is truly happening in the economy and where capital is flowing.
The ability to identify this context is the core skill that translates the language of macroeconomic statistics into the language of real market movements.
Federal Reserve Policy
We have reached the key element that determines the development of both individual sectors and the financial market as a whole. Central bank policy is the primary force that sets the rhythm of market movements. Most forecasts and trading strategies ultimately boil down to an attempt to anticipate the regulator’s next steps.
When analyzing a new set of data, the first question we ask is:
what does this mean for the Federal Reserve? What actions will the regulator take to stabilize conditions or support positive momentum?
To do this, the central bank has a set of fine-tuning tools at its disposal. By understanding how each of them works, one can form well-reasoned assumptions about the future direction of financial markets. The central bank’s toolkit includes:
• the policy interest rate
• the interest rate on reserves
• forward guidance
• balance sheet operations
• open market operations
• direct lending facilities
All of these are important, but the central role belongs to the policy rate — the Federal Funds Rate (FFR).
The policy rate is the central bank’s main interest rate. It defines the base cost of money in the financial system and serves as the primary benchmark for all other interest rates in the economy. By adjusting it, the central bank directly influences inflation and economic activity.
Accommodative stance (rate cuts):
The central bank lowers borrowing costs for businesses and households. This expands the money supply and stimulates demand, supporting economic growth, but it also creates inflation risks and may put downward pressure on the national currency.
Restrictive stance (rate hikes):
The central bank makes borrowing more expensive. This cools demand, slows economic activity, and restrains inflationary pressure. In such an environment, the cost of money in the economy rises, often leading to a strengthening of the national currency.
Thus, by monitoring the Fed’s rate decisions, we gain insight not only into the current diagnosis of the economy, but also a clear signal of the environment — accommodative or restrictive — in which all markets will operate in the near future.
Which Data Actually Move the Market?
Having mastered the basic principles of macro analysis, we move on to practice. Now, when looking at an economic calendar, we no longer see just a list of events — we understand their meaning and can anticipate market reactions. To do this, indicators must be grouped by the type of information they provide about the state of the economy.
1. Inflation Indicators
CPI (Consumer Price Index) and especially Core CPI are the primary measures of consumer inflation and directly influence central bank decisions.
2. Labor Market Data
• NFP (Nonfarm Payrolls) and the Unemployment Rate (UR) are key indicators of labor market health.
• AHE (Average Hourly Earnings) reflects wage-driven inflationary pressure.
• JOLTS (Job Openings, Quits) are leading indicators of labor demand and worker confidence.
• Jobless Claims provide a weekly “pulse check” of the labor market.
3. Consumer Demand Indicator
Retail Sales are the main barometer of consumers’ willingness to spend and a key component of GDP.
4. Leading Indicators
PMI (Purchasing Managers’ Index) from ISM and S&P Global is the most important monthly leading indicator, capturing sentiment and the pace of change in the real economy (manufacturing and services).
Beyond these indicators, there are many other important metrics (industrial production, consumer confidence, housing data). However, we focus on the primary market movers — the releases that generate the most volatility and most often reshape the market narrative. Understanding these four categories provides the key to decoding the majority of price movements driven by macroeconomic news.
Inflation Indicators (CPI and Core CPI)
These indices track changes in the cost of living. Imagine a basket that contains everything a typical household buys: food, gasoline, housing costs, clothing, and medical services.
The headline Consumer Price Index looks at this entire basket. However, prices for certain items — such as gasoline or vegetables — can swing sharply due to weather conditions or political decisions. These swings create a lot of noise and make it harder to see the underlying trend.
That is why analysts and central banks focus primarily on core inflation. It is the same index, but with the most volatile components — food and energy — removed. What remains are prices that move more slowly but persistently: rent, childcare, repair services, and healthcare.
If core inflation is rising, it means the foundation of everyday life is becoming more expensive. The cause is usually an overheated economy — when consumers have ample money and are willing to pay more, while businesses face rising costs, often driven by higher wages. This type of inflation is sticky and difficult to contain. That is precisely why central banks react to core inflation when deciding whether to raise interest rates.
If, on the other hand, only headline CPI rises due to a temporary spike in gasoline prices while core inflation remains stable, the central bank is unlikely to tighten policy — such moves are usually seen as transitory.
Labor Market Data (NFP, AHE, JOLTS, Jobless Claims)
The labor market is not a collection of isolated numbers, but a living system where some indicators lay the groundwork for others. To understand it, one must see the sequence and the cause-and-effect relationships.
The first warning signal usually comes from weekly jobless claims. When the number of people filing for unemployment benefits begins to rise consistently, it is a direct signal that companies are laying off workers more frequently. This is the earliest indication that, a few weeks later, the main monthly report may deliver unpleasant surprises: weak job growth or even outright job losses, followed by a rise in the unemployment rate.
However, the strength of the labor market is determined not only by the number of jobs, but also by their quality and the balance of power between employers and workers. This is where the JOLTS report on job openings and labor turnover becomes critical. When job openings are abundant and workers are quitting voluntarily in large numbers, it points to a unique situation: employees are confident enough to switch jobs in search of higher pay. This scenario almost inevitably leads to accelerated wage growth, which later shows up in the Average Hourly Earnings (AHE) data.
Wages are where the strongest link to central bank policy lies. Persistent wage growth acts as a powerful engine for inflation in the services sector. Therefore, when the Fed sees low unemployment combined with steadily rising wages, it has little choice but to keep interest rates high in order to cool the economy. Conversely, when job creation slows and wage growth begins to decelerate, it sends the regulator a long-awaited signal that labor-driven inflationary pressure is easing — opening the door to discussions about policy easing.
By closely monitoring weekly jobless claims and vacancy data, one can anticipate the likely outcome of the key monthly labor report and, with a high degree of confidence, predict how the central bank will react.
Consumer Demand Indicator (Retail Sales)
This is the most direct snapshot of household wallets. The index shows how much money consumers spent during the month on goods — in physical stores, online, at car dealerships, and at gas stations.
Its strength lies in its simplicity. It does not attempt to predict the future or measure sentiment — it simply records whether people are actually spending their money. And since household consumption is the main engine of the U.S. economy, this number is closely watched by everyone.
Retail Sales are highly sensitive to two factors: labor market conditions and Federal Reserve policy.
When jobs are plentiful and wages are rising (strong NFP and AHE), consumers spend with confidence — sales increase.
When the Fed raises rates, borrowing costs (including credit cards) rise, large purchases are postponed, and sales slow or decline.
As a result, Retail Sales often serve as the final confirmation — or refutation — of trends suggested by other data. Persistent growth in sales despite high interest rates tells the Fed that the economy remains too hot and that policy is not restrictive enough. A sudden drop, especially against the backdrop of an already weakening labor market, becomes a powerful argument for a pivot toward policy easing.
What to focus on in the data:
• The month-over-month change, with particular attention to the Control Group, which excludes the most volatile components (autos, gasoline, and building materials) and provides a cleaner view of core consumer activity.
Leading Indicator (PMI)
PMI is a leading indicator that captures turning points in the economic cycle.
It does not measure production volumes or revenues. Its purpose is to identify the moment when business activity is accelerating or beginning to contract. The index is based on surveys of executives who make daily decisions about purchasing, hiring, and investment. Their collective assessment of changes is one of the most sensitive barometers of demand dynamics.
The key is not the absolute level of the index, but its direction and internal components. A decline from 55 to 52 still signals expansion, but indicates a loss of momentum. A rise from 48 to 49 still reflects contraction, but points to a slowdown in the pace of decline.
For central banks, two PMI components are particularly critical:
• New Orders — the purest indicator of future demand. A decline here typically precedes reductions in production and investment.
• Prices Paid — a direct signal of inflationary pressure in supply chains and the services sector. Sustained increases in this component can prevent monetary policy easing, even if the headline index is slowing.
PMI functions as an early warning system. A sustained deterioration over several months often precedes slower GDP growth and weakening labor market data. Conversely, resilience at elevated levels — especially when price components are rising — serves as evidence for central banks that the economy is overheating and that a restrictive stance must be maintained.
Conclusion
You now have a solid theoretical foundation for interpreting news releases and the signals they send to the market. To truly understand this framework and apply it effectively in trading, consistent practice is essential. From my own experience, keeping a macro trading journal can be extremely helpful. Record how the market reacts under different conditions and gradually develop your own independent view of each situation.
Be especially cautious of market rumors — more often than not, such opinions are simply attempts to attract attention with sensational headlines rather than provide meaningful insight.
Enjoy!

NAS100 & Economy In Trouble!I have been warning for months now that people need to GTFO and STFO! I have done it with big names, Gold, Silver etc..
If you were smart, you would have looked at the evidence I presented and taken appropriate action. be honest with yourselves. If you haven't made your money by now, you won't make it at these euphoric levels chasing $4 trillion companies, EVs that are already a has-beens or expensive data centers that amount to real estate with low margins funded off the books by unprofitable companies with stock and SPV circle jerking the same $100 billion around.
Lastly, I have lived long enough to know that political-economic theories always face reality. Mosler’s #MMT and its “#Economists” learned that lesson in #Turkey. Their nonsense delivered 86% inflation, a collapsing LSE:TRY , and pain for 80 million people. I first posted the TRY collapse here on TradingView back in 2021. The results are now self-evident.
"END THE FED" nonsense pushed onto unsuspecting people by Austrian Libertarians and Monetarists are about to find out the hard way what it means NOT to have an independent FED if Trump gets his way. Many dictators have tried taking over their respective central banks with the same catastrophic results. Currency crisis, High Inflation, and economic collapse that turned into a humanitarian crisis.
Venezuela
Iran
Egypt
Argentina
Lebanon
Zimbabwe
Sri Lanka
Pakistan
Russia
Iraq on and on...
It's cool for every economic political hack masquerading as an economist to make the FED the vilan bc they know it would be too stupid for anyone to even think about trying it. So it gives them cover to continue to beat the "Hate The FED" drum. But believe me, the last thing they want to see is the end of the FED. Even as a world reserve currency and economic superpower, once the trust is gone its GAME OVER! It's like glass; it can never be repaired.
YOU HAVE BEEN WARNED!
This is not POLITICAL! This is COUNTING!
#FAFO
If you enjoy the work:
👉 Drop a solid comment
Let’s push it to 6,000 and keep building a community grounded in raw truth, not hype.

Hyperinflation & DictatorsI cannot make this any simpler.
🚨 I AM ISSUING A WARNING TO EVERYONE!
Should Trump succeed in taking over the FED, the outcome is already known. What is not known is the SEVERITY. FAFO!
Here is how it works:
1️⃣ Political pressure replaces economic reality
When leaders can’t win within the system, they change the system.
Common moves:
Undermine central-bank independence
Fire or sideline technocrats
Declare that “rates are too high” or “money is too tight”
This happened in:
Argentina
Lebanon
Sri Lanka
Pakistan
Turkey
Venezuela
Zimbabwe
Russia.
Different excuses. Same motive.
2️⃣ FED Monetary discipline is framed as “The Enemy”
Raising rates?
Protecting the currency?
Controlling deficits?
Rebranded as:
“Anti-growth”
“Western ideology”
“Sabotage”
“Austerity”
Once price stability becomes political, it’s already over.
3️⃣ Spending continues — funding doesn’t
Here’s the fatal step:
Governments keep spending
Tax capacity doesn’t grow
Borrowing gets harder
So pressure shifts to the currency system
This is where reality kicks in:
You can print currency.
You can’t print trust.
4️⃣ Markets respond instantly (and mercilessly)
Markets don’t argue ideology. They just reprice risk.
What happens next:
Bonds sell off
Currency weakens
Import prices surge
Inflation feeds on itself
At this point, rate hikes don’t “cause” inflation — they’re a late reaction to lost credibility.
5️⃣ Hyperinflation isn’t a surprise — it’s the end stage
Hyperinflation is not:
A policy mistake
Bad luck
“External shocks”
It’s the logical conclusion of:
Political control → monetary submission → currency collapse
Every country on that list followed this arc. No exceptions.
The uncomfortable truth
Countries don’t collapse because they raise rates.
They collapse because they refuse to accept limits.
Markets respond with inflation — not theory.
If you enjoy the work, drop a solid comment
Let’s push it to 6,000 and keep building a community grounded in raw truth, not hype.

USD/ZAR: The Rand’s Strategic Pivot in 2026The South African rand recently surged to 16.33 against the US dollar. This move signals a significant shift in emerging market sentiment. Investors now pivot away from safe-haven assets. They embrace the rand as a primary recovery play for 2026.
Macroeconomic Anchors and Monetary Easing
The South African Reserve Bank (SARB) recently implemented a 3% inflation target . This bold framework provides a new anchor for price stability. Analysts expect this move to foster long-term fiscal credibility. Lower inflation expectations allow the SARB to maintain an accommodative stance.
Parallel to this, US Federal Reserve officials signaled dovish leanings. Markets now price in multiple rate cuts for the 2026 cycle. This interest rate differential heavily favors the rand. Yield-seeking investors find South African government bonds increasingly attractive.
Geopolitics and the G20 Transition
South Africa recently handed the G20 presidency to the United States. This transition marks a critical geostrategy juncture for Pretoria. Diplomatic relations with the Trump administration remain a key variable for trade. Exporters closely watch potential adjustments to the AGOA agreement .
Strategic autonomy remains a priority for South African leadership. The nation continues to balance relations with the BRICS+ bloc and Western partners. This "non-aligned" approach secures diverse investment flows. It also hedges against global supply chain disruptions.
High-Tech Innovation and Patent Trends
The local high-tech sector is evolving from experimentation to execution. "Agentic AI" now drives efficiency in deep-level mining operations. South Africa is filing record patents in AI-driven mineral processing and green hydrogen. These innovations attract significant venture capital from global tech hubs.
The country is also becoming a critical hub for data annotation. Local startups provide high-quality training data for global LLMs. This creates a new "silicon-based" workforce. It leverages the country's demographic dividend to power the global AI revolution.
Industry Trends: Energy and Logistics
Energy reliability has improved significantly following aggressive private-sector participation. Businesses no longer fear the debilitating effects of "loadshedding." Enhanced logistics infrastructure at major ports facilitates smoother trade flows. These reforms reduce the cost of doing business across the SADC region.
Cybersecurity has become a non-negotiable component of business continuity. Companies are adopting zero-trust architectures to combat rising regional cyber threats. This investment in digital resilience bolsters investor confidence in the local financial ecosystem.
Management, Culture, and the New Business Model
Management styles are shifting toward AI-native operating models . Leaders now orchestrate teams where humans and AI agents collaborate seamlessly. This cultural transformation prioritizes agility over traditional hierarchy. It allows South African firms to compete globally on efficiency and innovation.
Hybrid work remains the standard for the urban middle belt. This model reduces overhead costs and improves employee retention. Companies that embrace this flexibility report higher productivity and better mental health outcomes. This shift redefined the corporate landscape in Johannesburg and Cape Town.

#EURUSD: Consolidation after the impulse2025 has been a strong year for the euro. On higher timeframes, a classic scenario unfolded: a false breakout of the long-term range and the psychological 1.05 level, followed by a powerful impulsive move that extended into early summer. Such price action points not to a random rally, but to a shift in the medium-term balance in favor of the euro.
At the moment, the instrument is in a consolidation phase. Technically, this does not look like a breakdown of the uptrend; rather, it appears to be a local correction after an extended move. Price remains above key medium-term support levels, the structure stays intact, but the impulse has temporarily faded.
From a technical perspective, the 1.165 area stands out as a key zone to monitor. If the corrective move continues, this level may act as the first area of meaningful market reaction. At the same time, premature countertrend entries remain unjustified, as the current phase does not favor aggressive trading.
From a scenario standpoint, the priority remains on waiting for:
— a pause in the correction,
— the formation of a consolidation range,
— the emergence of a confirmed structure for the next directional move.
From a macro perspective, the market continues to balance between expectations of potential Fed easing and the cautious stance of the ECB. This backdrop increases the likelihood of sideways price action and makes trading based on confirmed scenarios more reasonable than attempting to anticipate local extremes.

EUR/USD 2026: Why the Dollar Dominates Despite Global UnrestThe EUR/USD pair entered January 2026 under significant pressure. The U.S. dollar recently hit a three-week high against the euro. While geopolitical headlines scream of regime change in South America, the market remains cold. Investors are ignoring the noise to focus on iron-clad economic fundamentals. Current price action near $1.1704 reflects a clear preference for U.S. assets.
Geostrategy: The Venezuela Pivot and Risk Primacy
Geopolitics took center stage on January 3 with Operation Absolute Resolve in Venezuela. The capture of President Maduro signaled a shift in Washington’s geostrategy. Analysts initially feared a "safe-haven" stampede. However, the currency markets remained remarkably stable.
Traders now view this move as a reassertion of the Monroe Doctrine. The U.S. is securing its own hemisphere while becoming more transactional elsewhere. This strategic focus reduces long-term energy risks for the American economy. Consequently, the dollar’s "exorbitant privilege" remains unchallenged by recent kinetic actions in Latin America.
Macroeconomics: The Growth Divergence Gap
The underlying economics favor a stronger dollar throughout early 2026. The U.S. economy projects a 1.9% growth rate. Meanwhile, the Eurozone stumbles at just 1.1% [/b. This divergence stems from sticky inflation and differing fiscal capacities.
While the Federal Reserve maintains a cautious stance, the European Central Bank (ECB) faces stagnation. High energy costs continue to haunt German industry. Markets now price in fewer U.S. rate cuts than previously expected. This interest rate differential acts as a gravity well for global capital.
Leadership: The Fed’s High-Stakes Regime Change
Management and leadership at the Federal Reserve are currently under the microscope. Jerome Powell’s term concludes in May 2026. President Trump has signaled a preference for a more "pro-growth" successor. Speculation surrounds candidates like Kevin Hassett or Christopher Waller.
A leadership shift toward looser policy could theoretically weaken the dollar. However, the market currently bets on institutional continuity. Investors trust the Fed’s mandate to protect the dollar’s purchasing power. This "credibility premium" keeps the greenback resilient against a fragmented European political landscape.
High-Tech and Patents: The Innovation Deficit
A deep-dive patent analysis reveals a widening chasm between the two regions. The U.S. leads in high-tech sectors like AI and quantum computing. European innovation remains fragmented across national borders. In 2025, the U.S. outpaced the EU in AI-related patent filings by nearly 3 to 1 .
* R&D Spend: The U.S. invests roughly 3.5% of GDP into R&D.
* Venture Capital: U.S. fund sizes dwarf European counterparts by double.
* Business Model: The EU’s "precautionary principle" slows high-tech adoption.
Europe’s "middle-technology trap" limits its productivity growth. Without a unified capital markets union, the Eurozone cannot fund the next technological revolution. This structural weakness creates a long-term bearish outlook for the euro.
Technology and Cyber: Securing the Digital Dollar
Cybersecurity and financial technology also play a pivotal role. The U.S. is rapidly integrating AI into its demand forecasting and logistics. These "high-tech" efficiencies lower the cost of doing business. Furthermore, the U.S. leads in developing secure, digital-first financial architectures.
European firms struggle with high regulatory hurdles like the AI Act. While these laws protect privacy, they often stifle rapid scientific advancement. Consequently, global investors view the U.S. as a safer, more innovative harbor for digital capital.
Market Outlook: January 7 and Beyond
All eyes now turn to the mingling U.S. manufacturing data and non-farm payrolls. These indicators will confirm if the U.S. "A-pillars" of growth remain intact. If data stays firm, the EUR/USD may test support at $1.1650 . The dollar's dominance is not just a trend; it is a structural reality.

$DXY - Ballads of Dollar (2026)TVC:DXY -Ballads of the Dollar (2026)
TVC:DXY 2026 Outlook
Q1-Q2-Q3-Q4
| Quarter | Expected DXY Trend | Main Drivers |
| ----------| ---------------------------- | ------------------------------------- |
| Q1 | Mild weakness / consolidation | Fed cut expectations, risk flows |
| Q2 | Potential trough & volatility | Yield compression, global optimism |
| Q3 | Stabilization / rebound signals | US economic data surprises |
| Q4 | Mixed; range reset | Geopolitics, positioning, seasonality |
📉 Key Fundamental Drivers for TVC:DXY 2026
🔹 Monetary Policy Divergence
Expected Fed cuts compress yield differentials with ECB, BoE, BoJ, etc., reducing carry benefits for USD.
🔹 Interest Rate & Inflation Trends
Ongoing sticky inflation and resilient labor metrics could delay some cuts, supporting the dollar intermittently.
🔹 Global Growth & Capital Flows
Balanced growth worldwide reduces “safe-haven” dollar flows; global portfolio diversification may cut dollar dominance.
🔹 Reserve Currency Dynamics
Changes in global FX reserve weighting (e.g., China lowering USD share) reflect gradual diversification — a structural headwind.
🔹 Fiscal Policy and U.S. Deficits
High deficits and political disputes over debt and spending may weigh on confidence over time, even if they don’t trigger major sell-offs.
📌 Geo-Political Risk Factors Influencing TVC:DXY
🔹 U.S.–China relations: trade, tech competition, and financial linkage tensions encourage FX diversification outside USD.
🔹 Middle East & Ukraine: ongoing conflicts support cyclical USD strength during spikes in risk aversion.

Whats in store for 2026?Predicting that, the stock market will move in any direction other than upwards has historically proven to be a fool's errand.
Typically, it's advisable to maintain a long position of America and its robust capital markets until the signs of a recession truly start to emerge.
However, last year's forecast of "7k plus" did indeed come to fruition, albeit by the narrowest of margins (just 11 points on the futures).
Now, let’s consider a potential scenario for 2026, shall we?
Following a stagnant fourth quarter and a lackluster conclusion to the last few trading days of 2025, I suspect that the initial half pf the year may be weaker than the prevailing consensus suggests.
Will we experience a technical bear market with a -20% decline?
Or will policymakers intervene at -19%, as they have done so many times in the past? :)
Regardless of how deep the pullback may be or how quickly the potential softness at the start of the year could occur...
It might actually present another fantastic buying opportunity that paves the way for a strong finish to the roaring twenties, with the SPX trading well above 10,000.
(indeed my SPX chart points towards 17,000 by 2032)
Could the bottom align with a possible four-year cycle low for BTC? That would be quite synchronistic and feasible, especially since crypto has become so intertwined with DJT's policies and serves as a performance metric that this administration is judged on whether praised or criticised for.
Have conviction but remain nimble would be my overriding message.

Aussie Bull Run: Why AUD Futures Are the 2026 Trade to WatchThe March 2026 Australian dollar (A6H26) futures have emerged as a premier opportunity for currency traders. As of late December 2025, prices have surged to new contract highs, supported by a perfect storm of technical and fundamental catalysts. For the modern trader, the "Aussie" is no longer just a proxy for copper; it is a sophisticated bet on global technology and fiscal shifts.
Technical Mastery and MACD Momentum
The daily bar chart for A6H26 reveals a textbook bullish trend. Prices recently breached key resistance, establishing a solid floor for further appreciation. Technical analysts point to the Moving Average Convergence Divergence (MACD) , which remains in a strong posture. The MACD line sits comfortably above the signal line, with both trending higher.
The path of least resistance is clearly upward. A sustained move above the. 6729 contract high activates a buy signal for many institutional desks. Traders are now eyeing a primary price objective of 6950 . To manage risk, professional stops are typically placed just below support 6625 , ensuring a disciplined approach to this high-conviction setup.
Macroeconomics: The Fed’s Dovish Pivot
A primary driver for the Australian dollar's strength is the diverging path of global central banks. The U.S. Federal Reserve has transitioned toward a more accommodative stance to support labor markets. Lower U.S. interest rates naturally weigh on the Greenback, making high-yielding currencies like the AUD more attractive to international carry traders.
Conversely, the Reserve Bank of Australia (RBA) maintains a hawkish bias. Persistent domestic inflation and a resilient job market have forced Australian policymakers to keep rates elevated. This widening interest rate differential acts as a powerful magnet for global capital, fueling the "long Aussie" trade into 2026.
Geostrategy: Powering the AI Revolution
Australia’s geostrategy has shifted from traditional mining to securing the "Green and Digital" transition. The nation is a critical supplier of lithium, copper, and rare earths , the literal building blocks of AI data centers and renewable energy. As global demand for computing power explodes, Australia’s trade balance benefits from a structural "AI premium."
Furthermore, the Australian government is aggressively implementing blockchain-based supply chain tech . These innovations reduce friction at the border and enhance the security of resource exports. By leading in "High-Tech Mining," Australia ensures its currency remains a vital asset in the global technological race.
Professional Note: Success in AUD futures requires monitoring both the RBA’s tone and China’s industrial demand. While the technicals suggest a move to .6950, stay alert for any sudden shifts in global risk appetite that could spark short-term volatility.

GBPUSD - Ascending Channel at $1.35
Executive Summary
FX:GBPUSD is trading at $1.3498 on December 28, 2025, consolidating near 3-month highs within a well-defined ascending channel on the 2H timeframe. The British Pound is having its best year since 2017 (+8% YTD) while the US Dollar is on track for its worst year since 2003 (-9.9% YTD). Price is testing critical resistance at $1.3520-1.3560 after breaking above $1.35 for the first time in three months. The Bank of England's cautious stance on rate cuts versus the Fed's expected easing creates a favorable backdrop for sterling, but thin holiday volumes and overbought conditions warrant caution.
BIAS: NEUTRAL - Watching for Breakout at Resistance
The trend is clearly bullish with +8% YTD. The ascending channel is intact. However, price is testing critical resistance near multi-month highs. Wait for breakout confirmation or pullback to support before entering.
Current Market Context - December 28, 2025
GBP/USD is in a strong uptrend:
Current Price: $1.3498 (-0.04% on the day)
Day's Range: $1.3477 - $1.3527
52-Week Range: $1.2099 - $1.3789
52-Week High: $1.3789 (approaching)
Technical Rating: BUY
Performance Metrics - ALL GREEN (except 6M):
1 Week: Positive
1 Month: +2%
3 Months: Positive
6 Months: -1.49%
YTD: +7.88%
1 Year: +7.57%
Sterling is having its best year against the Dollar since 2017. The pound broke above $1.35 for the first time in three months.
THE BULL CASE - Dollar Weakness Driving Sterling Higher
1. Dollar's Worst Year Since 2003
The US Dollar has been under severe pressure:
Dollar Index (DXY) on track to lose 9.9% for the year
Steepest annual drop since 2003
Whipsawed by tariff chaos and Fed independence concerns
"The USD risk premium widened in December" - HSBC
"USD weakness may reflect growing concerns around Fed independence" - HSBC
2. Fed Rate Cut Expectations
Fed funds futures pricing in 2-3 rate cuts in 2026
First cut expected as early as March/April
Goldman Sachs expects "two more 25bp cuts to 3-3.25%"
Fed balancing weakening labor market against inflation concerns
Lower rates = weaker Dollar = stronger Sterling
3. Bank of England Cautious on Cuts
BoE cut rates by 25bps to 3.75% in December
Narrow 5-4 vote reflecting ongoing inflation concerns
Governor Bailey: rates will trend lower "but not as quickly as markets might hope"
UK inflation at 3.2% - still above BoE's 2% target
Hawkish BoE vs Dovish Fed = Sterling strength
4. Improving UK Economic Sentiment
"Sterling-wise looks to be some improving sentiment towards the outlook" - Neil Wilson, Saxo Markets
Revised GDP figures showed substantial upward revision to business investment
UK GDP grew 0.1% in Q3, in line with expectations
Budget delivered extra fiscal headroom, triggering relief rally
Positioning was negative going into Budget - relief rally since
5. Sterling's Best Year Since 2017
GBP/USD up over 8% YTD
Best annual performance since 2017
Broke above $1.35 for first time in 3 months
Up over 2% in December alone
Outperforming most G10 currencies
THE BEAR CASE - Short-Term Caution
1. Near Multi-Month Highs
Price at 3-month highs
Testing critical resistance zone $1.3520-1.3560
Natural resistance after strong rally
Profit-taking risk elevated
52-week high at $1.3789 still ~300 pips away
2. Thin Holiday Volumes
Year-end trading conditions
Many market participants off
Thin liquidity can cause erratic moves
"Thin turn of year markets provide opportunity" for sharp reversals
Reduced participation until January
3. Overbought Conditions
+8% YTD rally
+2% in December alone
Extended from moving averages
Mean reversion possible
Consolidation healthy after strong move
4. UK Fiscal Concerns
Budget watchdog to publish forecasts on March 3
Any negative assessment could pressure sterling
Fiscal headroom remains tight
BoE forecasts flat growth in Q4
5. Potential Dollar Bounce
Dollar oversold after -9.9% YTD decline
Risk-off events could boost Dollar safe-haven appeal
Fed could turn hawkish if inflation persists
Yen intervention could trigger broader FX volatility
Expert Analysis
MUFG Strategists:
"The drop for the dollar this year is unlikely to be a one-off with scope for further gains ahead."
HSBC Analysts:
"The USD risk premium widened in December which suggests USD weakness may reflect growing concerns around Fed independence, not just the monetary policy outlook."
"With many other G10 central banks on hold, we think Fed liquidity operations and a slight dovish Fed bias leaves the USD outlook tilted to the downside."
Neil Wilson, Saxo Markets:
"Sterling-wise looks to be some improving sentiment towards the outlook for the economy even if it looks a bit miserable in the trenches right now."
"Positioning was kind of negative going into the Budget so as that delivered extra fiscal headroom we have seen some relief rally since."
Goldman Sachs (David Mericle):
"We expect the FOMC to compromise on two more 25bp cuts to 3-3.25% but see the risks as tilted lower."
Technical Structure Analysis
Price Action Overview - 2 Hour Timeframe
The chart shows a textbook bullish structure:
Ascending Channel Characteristics:
Clear ascending channel established
Lower trendline: Rising support (yellow dashed)
Upper trendline: Rising resistance (yellow dashed)
Higher highs and higher lows throughout
Price respecting channel boundaries well
Currently trading near upper channel boundary
Key Zones Identified (Purple Shaded):
Upper resistance zone: $1.3520-$1.3560
Lower support zone: $1.3220-$1.3280
Major resistance lines: Red horizontals at key levels
Channel width: ~300 pips
Current Position:
Price at $1.3498 - testing upper resistance zone
Consolidating after push to 3-month highs
52-week high at $1.3789 within reach
Technical rating: BUY
Key Support and Resistance Levels
Resistance Levels:
$1.3527 - Day's high / immediate resistance
$1.3520 - Resistance zone lower boundary
$1.3535 - Recent 3-month high
$1.3560 - Resistance zone upper boundary
$1.3600 - Psychological resistance
$1.3650 - Secondary resistance
$1.3700 - Psychological level
$1.3789 - 52-WEEK HIGH (major target)
Support Levels:
$1.3477 - Day's low / immediate support
$1.3450 - Secondary support
$1.3400 - Psychological support
$1.3350 - Tertiary support
$1.3320 - Support zone upper boundary
$1.3280 - Support zone lower boundary
$1.3220 - CHANNEL FLOOR (major support)
$1.2099 - 52-Week low
Channel Analysis
Channel established from October lows
Strong upward slope - bullish momentum
Price respecting both boundaries
Channel width: approximately 300 pips
Upper boundary: ~$1.3520-$1.3560
Lower boundary: ~$1.3220-$1.3280
Breakout above channel would accelerate rally
Moving Average Analysis
Price trading above all major moving averages
MAs sloping upward - bullish alignment
Short-term MAs above long-term MAs
MAs providing dynamic support on pullbacks
Trend structure bullish on all timeframes
SCENARIO ANALYSIS
BULLISH SCENARIO - Breakout to 52-Week High (60% Probability)
Trigger Conditions:
2H close above $1.3560 resistance zone
Volume confirmation on breakout
Dollar Index breaks below 97.50
Fed signals more rate cuts
Risk-on sentiment continues
Price Targets if Bullish:
Target 1: $1.3600 - Psychological level
Target 2: $1.3650 - Secondary resistance
Target 3: $1.3700 - Psychological level
Target 4: $1.3789 - 52-week high
Extended: $1.3850+ (new highs)
Bullish Catalysts:
+8% YTD momentum
Ascending channel intact
Fed rate cut expectations (2-3 cuts in 2026)
Dollar's worst year since 2003
BoE cautious on cuts vs Fed dovish
Sterling at 3-month highs
Best year since 2017
BEARISH SCENARIO - Pullback to Channel Support (40% Probability)
Trigger Conditions:
Rejection at $1.3520-$1.3560 resistance
Break below $1.3400 support
Dollar bounce on strong US data
Risk-off sentiment
BoE turns more dovish
Price Targets if Bearish:
Target 1: $1.3400 - Psychological support
Target 2: $1.3320 - Support zone upper boundary
Target 3: $1.3280 - Support zone lower boundary
Target 4: $1.3220 - Channel floor
Bearish Risks:
Near 3-month highs - natural resistance
Thin holiday volumes
Overbought after +8% YTD
Profit-taking risk elevated
Potential Dollar bounce
UK fiscal concerns (March 3 forecasts)
NEUTRAL SCENARIO - Consolidation in Range
Most likely short-term outcome:
Price consolidates between $1.3400-$1.3560
Thin holiday trading
Wait for January for directional clarity
Healthy consolidation before next leg
Channel support provides floor
MY ASSESSMENT - NEUTRAL with Bullish Bias
The weight of evidence favors bulls, but caution warranted at resistance:
Bullish Factors (Dominant):
+8% YTD - Best year since 2017
Ascending channel intact
Dollar's worst year since 2003 (-9.9%)
Fed rate cuts expected (2-3 in 2026)
BoE cautious vs Fed dovish
52-week high within reach
Technical rating: BUY
Higher highs and higher lows
Bearish Factors (Minor):
Near 3-month high resistance
Thin holiday volumes
Overbought short-term
Profit-taking risk
My Stance: NEUTRAL - Wait for Confirmation
The trend is clearly bullish with +8% YTD. The ascending channel is intact. Fed rate cut expectations continue to pressure the Dollar. However, price is testing critical resistance after a strong rally. Wait for breakout confirmation or pullback to support.
Strategy:
Wait for breakout above $1.3560 OR
Buy dips to $1.3280-$1.3320 support zone
Target $1.3650, $1.3700, $1.3789 (52-week high)
Stops below channel support
Don't chase at current levels
Respect the ascending channel
Trade Framework
Scenario 1: Breakout Trade Above $1.3560
Entry Conditions:
2H close above $1.3560
Volume confirmation
Dollar Index weakness
Trade Parameters:
Entry: $1.3565-$1.3580 on confirmed breakout
Stop Loss: $1.3480 below recent support
Target 1: $1.3650 (Risk-Reward ~1:1)
Target 2: $1.3700 (Risk-Reward ~1:1.4)
Target 3: $1.3789 (52-week high, Risk-Reward ~1:2.5)
Scenario 2: Buy the Dip at Support Zone
Entry Conditions:
Price pulls back to $1.3280-$1.3320 zone
Bullish rejection candle
Channel support holds
Trade Parameters:
Entry: $1.3280-$1.3320 at support zone
Stop Loss: $1.3200 below channel floor
Target 1: $1.3400 (Risk-Reward ~1:1)
Target 2: $1.3520 (Risk-Reward ~1:2.5)
Target 3: $1.3650 (Risk-Reward ~1:4)
Scenario 3: Channel Bottom Buy
Entry Conditions:
Price tests $1.3220 channel floor
Strong bounce with volume
Channel support holds
Trade Parameters:
Entry: $1.3220-$1.3250 at channel bottom
Stop Loss: $1.3180 below channel
Target 1: $1.3400 (Risk-Reward ~1:3)
Target 2: $1.3520 (Risk-Reward ~1:5)
Target 3: $1.3650 (Risk-Reward ~1:8)
Scenario 4: Rejection Short (Counter-Trend)
Entry Conditions:
Clear rejection at $1.3520-$1.3560
Bearish engulfing or pin bar
Dollar strength returns
Trade Parameters:
Entry: $1.3520-$1.3540 on rejection
Stop Loss: $1.3590 above resistance
Target 1: $1.3400 (Risk-Reward ~1:2.4)
Target 2: $1.3320 (Risk-Reward ~1:4)
Note: Counter-trend - smaller position size
Risk Management Guidelines
Position sizing: 1-2% max risk per trade
Respect the ascending channel
Buy dips, don't chase highs
Thin holiday volumes = wider stops
Scale out at targets
Move stop to breakeven after first target
Watch Dollar Index for confirmation
Monitor BoE and Fed commentary
Invalidation Levels
Bullish thesis invalidated if:
Price closes below $1.3220 (channel floor)
Ascending channel breaks down
Dollar Index surges above 100
BoE signals aggressive rate cuts
Bearish thesis invalidated if:
Price closes above $1.3789 (new 52-week high)
Channel breaks to upside
Dollar Index breaks below 96
Fed signals aggressive rate cuts
Conclusion
FX:GBPUSD is in a strong bullish trend, trading at $1.3498 within a well-defined ascending channel. Sterling has gained +8% YTD (best since 2017) as the Dollar weakens (-9.9% YTD, worst since 2003). The 52-week high at $1.3789 is within reach.
The Numbers:
Current Price: $1.3498
YTD Performance: +7.88%
1-Year Performance: +7.57%
52-Week High: $1.3789
52-Week Low: $1.2099
Dollar YTD: -9.9% (worst since 2003)
Key Levels:
$1.3789 - 52-WEEK HIGH (bullish target)
$1.3520-$1.3560 - Upper resistance zone
$1.3498 - Current price
$1.3400 - Psychological support
$1.3280-$1.3320 - Lower support zone
$1.3220 - Channel floor
The Setup:
Ascending channel intact. Fed rate cuts pressuring Dollar. BoE cautious on cuts. Sterling outperforming. All signs point higher, but respect resistance.
Strategy:
NEUTRAL stance - wait for confirmation
Buy breakout above $1.3560
Buy dips to $1.3280-$1.3320 support zone
Target $1.3650, $1.3700, $1.3789 (52-week high)
Stops below channel support
Respect the trend
The trend is your friend. Don't fight Sterling's momentum, but don't chase at resistance.

SR3 (SOFR 3 Month) Finds Balance After a Multi-Year DowntrendBackground: What is SR3 and what drives it?
SR3 refers to the three month SOFR futures contract. SOFR, or the Secured Overnight Financing Rate, represents the cost of overnight borrowing collateralized by US Treasuries. The three month SOFR future prices in the market’s expectation of average SOFR over a future three month period, making it one of the cleanest instruments for expressing interest rate expectations tied to Federal Reserve policy.
This instrument is primarily used by institutions to hedge short term interest rate exposure and to speculate on the future path of monetary policy. Because of this, SR3 is highly sensitive to macro data, Federal Reserve communication, inflation prints, labor market data, and shifts in risk sentiment. When markets expect easing, SR3 prices tend to rise. When expectations move toward higher for longer policy, prices tend to fall.
Since 2022, the dominant narrative has been centered around aggressive tightening followed by a prolonged restrictive stance. That narrative has kept SR3 in a broader downtrend. More recently, sentiment has shifted toward patience and data dependence rather than urgency in either direction. This has resulted in compression, balance, and range trade as participants wait for clarity on the next policy inflection.
What the Market Has Done
• The market has been in a downtrend since 2022 but has found a base with strong responsive selling at 96.575 and responsive buying at 96.325. This has formed a defined daily range that has contained price since June.
• From August to October, the market traded in a two way rotation with higher highs and higher lows. Buyers stepped up bids and were able to push price marginally higher, but each test of the 96.58 area was met with responsive selling that capped continuation.
• Toward the end of October, buyers failed to defend the higher lows. Price rotated back down into bid block one in the 96.42 to 96.37 area, where buyers successfully held price through mid November, establishing what is now bid block two.
• Sellers gained slight control as they were able to offer prices back down toward the lower end of the range near 96.325.
• The market performed a liquidity check below this level, but responsive buyers quickly stepped in and bid price back up through the daily range.
• Price is currently repairing the October 29 single print and is now trading between the established offer block and bid block two.
What to Expect in the Coming Week
The key level to watch remains 96.52, which sits near the upper portion of the current balance area and acts as a decision point.
Bullish scenario
• If the market is able to accept above the 96.52 area, continuation toward 96.575 becomes likely.
• A further extension toward 96.6125, which marks the October 17 high, is possible.
• Responsive selling is expected in this region.
• Failure to sustain trade above these levels would likely result in rotation back down into the range.
Neutral scenario
• In the absence of a meaningful news catalyst, a two way auction remains the highest probability outcome.
• Price could continue rotating between the offer block and bid block one.
• This rotation would serve to further repair the October 29 single print and the associated low volume area.
Bearish scenario
• If 96.435, which marks the high of bid block two, fails to hold, expect a sweep through bid block two.
• This would open the door for a revisit of the lower range boundary near 96.32.
• Responsive buyers are expected to defend this area based on prior behavior.
Conclusion
SR3 appears to have found a base and shifted from a structural downtrend into a period of sideways accumulation. Price has settled into a well defined range as market participants balance expectations around monetary policy and incoming data. Recent Federal Reserve commentary supports this shift in sentiment. The Fed has delivered multiple rate cuts this year and appears cautious about future moves, signaling a more data dependent approach and a potential pause after the most recent easing cycle, which aligns with range trade rather than directional conviction. Markets are pricing in additional easing but Fed officials have shown clear disagreement on the timing and pace of future cuts, which has dampened strong trend conviction and encouraged balancing action in rate sensitive instruments like SR3. Some officials have publicly indicated that further rate cuts could be warranted if economic conditions soften, while others have urged caution, emphasizing the need for clearer labor market and inflation signals before making additional adjustments. This split messaging has contributed to a neutral market structure where price oscillates within value rather than trending strongly higher or lower.
Interested in how others are mapping Fed communication and data dependency onto this range, and what catalysts you see as capable of breaking this structure. Please drop a comment and give a boost so that more from the community can join in the conversation. Thank you.
Disclaimer: This is not financial advice. Analysis is for educational purposes only; trade your own plan and manage risk.
