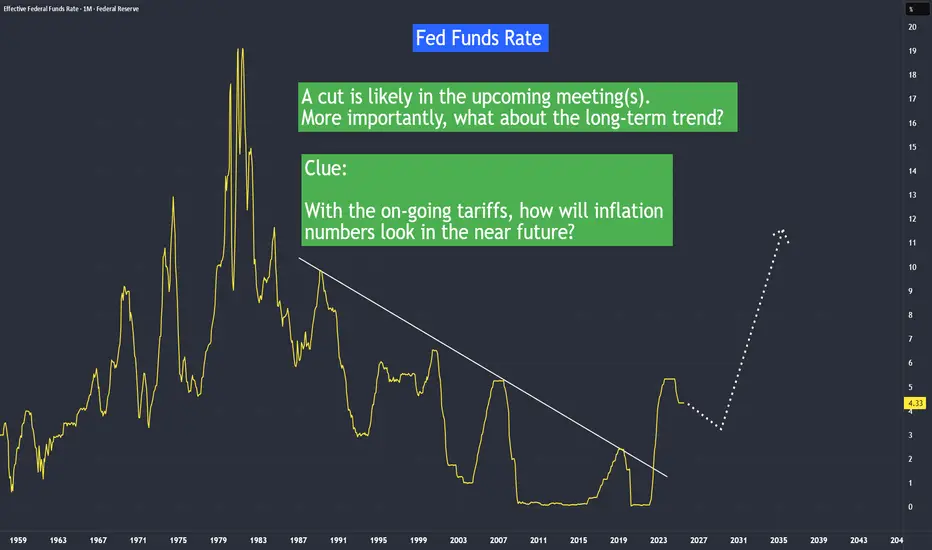
Gold peaks once the Fed's cutting cycle is over...As the cutting cycle ends and rates remain relatively low, that is when the gold price tends to peak. This suggests that we are not yet near a gold price top, as the cutting cycle has not been ended by Chairman Powell. With poor economy or jobs data, or via a dovish Trump candidate for Fed Chair next year, rates will drop further. History tells us that once the cutting is over, the gold price will stall.
Fedfundsrate

Today's Market Wrap: Fed, Gold, and Earnings – 29/10/2025The Federal Reserve cut interest rates by 25 basis points, marking the lowest level since 2022. However, Fed Chair Jerome Powell hinted at a possible pause in further rate cuts for the rest of the year. Still, the S&P 500 gained 0.2%, and the Nasdaq gained 1%, both hitting fresh record highs.
Gold remained flat at $3,950 an ounce after Powell warned that a December rate cut is not guaranteed. Potential progress on the US-China trade framework has also reduced some safe-haven demand.
In corporate earnings, Microsoft beat expectations but saw a ~2.5% drop in after-hours trading due to a slight miss in cloud revenue. Meta posted strong results but fell ~8% after hours, driven by concerns over capital expenditure. Alphabet exceeded earnings and revenue forecasts, with strong performance across Search, YouTube, and Cloud, sending shares up ~5% in after-hours trading.

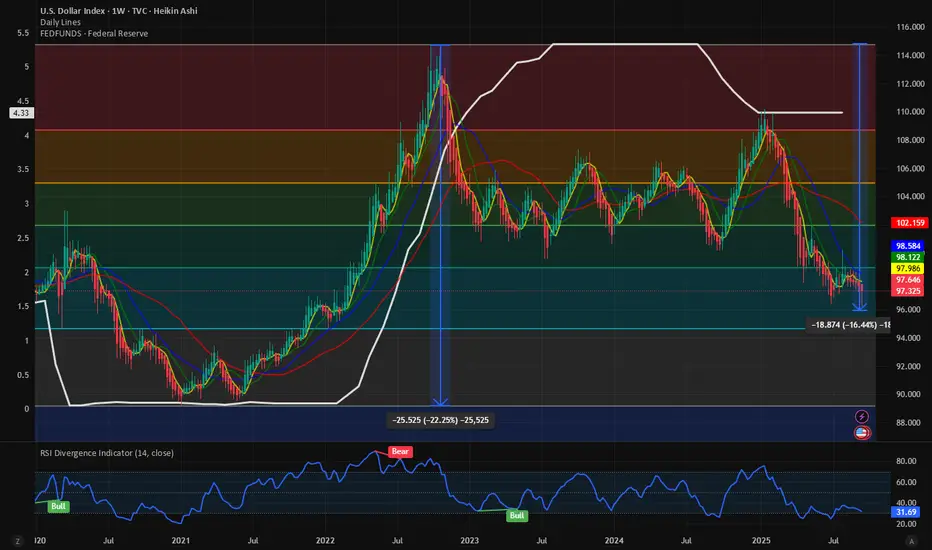
$DXY breaking down. Next level to watch 95. Year-end lows @ 90.Even if the Fed cutting cycle has just started, we are seeing major weakness in the TVC:DXY index prior to the easing cycle. It is quiet peculiar the bottom to top of the Fed hiking cycle matches exactly to the DXY index Cycle bottom in 2021 to cycle top to September 2022. With a drop in the Fed fund rate from 5.34% to 4.34%, which is close to 18%, and the DXY has also lost almost 17%. If the expectation is that there will be another 0.25% rate cut over the next few months which will takt the Fed fund rates to 4.09%, which is 23% from the recent highs of 5.34%. And surprisingly if we plot 23% lower from the ATH on the TVC:DXY Index then the index should reach 90 by the end of the year.
Verdict: With Fed rate lowering cycle ongoing the TVC:DXY index will lose more strength. 95 remains our short-term target and TVC:DXY to reach 90 by year end.
Gold at the Fed’s Crossroads: Bearish Windfall of 500–1000 PipsToday, we accurately grasped the rhythm of gold's fluctuations. In the previous trading idea, we clearly pointed out that gold is likely to reach the 3700-3710 area, and the latest trading plan is to continue shorting gold near this area, with the expected primary retracement target at 3680-3670. Obviously, even in the market's clamor for a rise, we are sticking to our trading logic, accurately grasping the volatility high near 3703 to short gold, and directly hitting TP: 3680. A very good short-term short trade!
For the gold market, the next highlight will of course be the Federal Reserve’s announcement of its interest rate decision.Market expectations for a 50 basis point rate cut by the Federal Reserve are rising, and there are also bets that there will be three rate cuts this year, with the first starting this week. Gold certainly lived up to expectations and, fueled by market expectations of a rate cut, soared all the way to over 3,700. So, what are my thoughts on the gold market regarding the upcoming Fed interest rate decision?
In fact, judging from the current U.S. economic and inflation data, as well as current market expectations, there are only two possibilities for the Federal Reserve's interest rate decision: a 25 basis point cut or a 50 basis point cut.
If the Fed cuts rates by 25 basis points, falling short of market expectations, the gold market could experience a surge followed by a decline, with the inflection point likely located between 3705 and 3715.
If the Fed cuts rates by 50 basis points, in line with market expectations, bullish sentiment will intensify, with buying funds continuing to push gold higher, potentially reaching around 3730-3735, where a turning point could occur.
However, considering that gold prices already surged ahead of the Fed's rate announcement, this move is likely intended to create room for further declines. Furthermore, given the "buy expectations, sell the facts" phenomenon, gold is likely to experience a surge followed by a decline. Furthermore, I believe the Fed is likely to adopt a gradual approach to rate cuts, so I believe the most likely rate cut will be 25 basis points, with the inflection point likely located between 3705 and 3715.
Therefore, we can focus on the opportunity to short gold in the 3705-3715 area. Even if gold continues to rise, we can pay attention to the short trading opportunities near the extreme area of 3730-3735. Once gold experiences a sharp pullback, it may trigger large funds to take profits and panic selling, and gold may continue to fall to around 3650 or even around 3630.

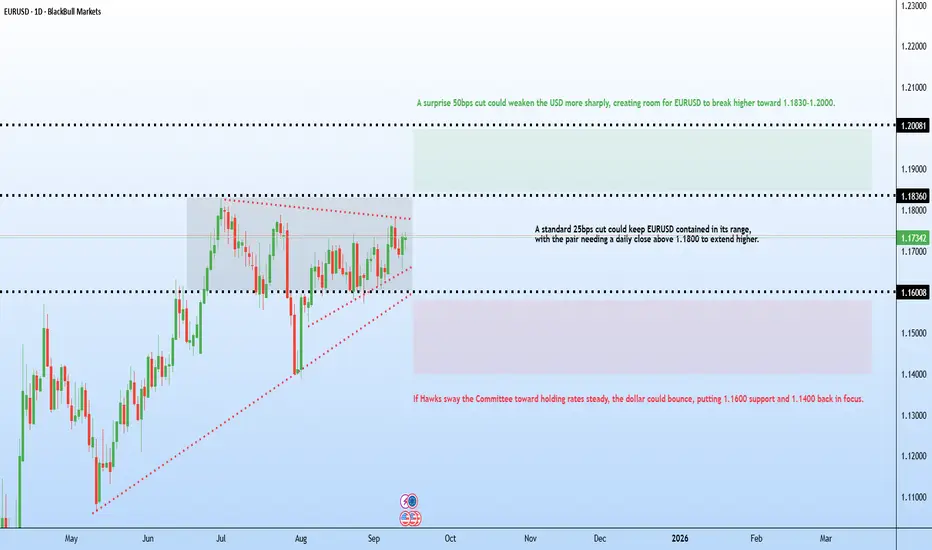
EUR/USD Could Skyrocket if They Cut 50bps!The market is certain that the Federal Reserve will cut interest rates during tomorrow's meeting, with a small chance of a 50 bps reduction priced in.
Two Fed policymakers, Chris Waller and Michelle Bowman , may be thinking of this FOMC meeting as an audition to take over the Fed Chair from Jerome Powell, which means they might push for a 50 bps cut tomorrow to impress President Trump (who thinks interest rates are 300 basis points too high at the moment).
Additionally, Trump stooge Stephen Mirin was added to the voting Fed board yesterday, just in time to push for an outsized interest rate cut.
This speculation is likely contributing to the recent rise in EUR/USD. Today’s movement has taken the pair above the prior yearly high at 1.1829, which was set in late July.
This breakout signals the potential continuation of the bullish trend, with the next possible resistance coming into focus at the double swing highs from August 2021, around 1.1900.

The countdown is on for the most anticipated Fed decision The Federal Reserve is widely expected to cut rates by 25bps to 4.00–4.25, with 105 of 107 economists surveyed by Reuters forecasting that outcome.
Still, the decision may not be unanimous. Some Committee members are not fully aligned on a September cut. Fed’s Goolsbee and Schmid could dissent in favour of leaving rates unchanged.
There is also a possibility of a larger move. If the U.S. Senate confirms Stephen Miran’s nomination to the Fed Board on Monday, he could be sworn in just in time for the meeting, and some speculate he may vote for a 50bps cut. Governors Bowman and Waller, who have previously dissented dovishly, may also support a larger reduction.
Goldman lays out the case for $5,000 gold – here’s how it happenGoldman Sachs has warned that gold prices could surge to $5000/oz if the Trump administration succeeds in undermining the independence of the U.S. Federal Reserve.
A politicized Fed is seen as likely to cut rates extremely aggressively (Treasury Secretory Scott Bessent and Trump have called for an interest rate of 1.5% and 1.0%, respectively) to stimulate short-term growth, raising the risk of higher inflation.
Such a move could drive investors away from traditional safe havens like the U.S. dollar and government bonds. In a report released this week, Goldman noted that if just 1% of the privately held U.S. Treasury market shifted into gold, prices could rise by about 40% from current levels.

Interest Rate Projection In April, inflation was at its lowest point. It was also the month when the 'Liberation Day' tariffs were introduced, applying a 10% baseline tariff to most countries.
But it wasn’t until August—when the July Core CPI rose to 3.1% from its April low of 2.8%— and now investors began to question whether inflation will be trending higher in the near future with now higher tariffs set in after 1st August.
With a lower non farm payroll or job created the last three months, Fed has to pivot to the economy and likely to ease rates. The real challenge will be lower job numbers and higher inflation number in the coming months.
Which side will Fed pivot to?
Recession or Inflation?
10 Year Yield Futures
Ticker: 10Y
Minimum fluctuation:
0.001 Index points (1/10th basis point per annum) = $1.00
Disclaimer:
• What presented here is not a recommendation, please consult your licensed broker.
• Our mission is to create lateral thinking skills for every investor and trader, knowing when to take a calculated risk with market uncertainty and a bolder risk when opportunity arises.
CME Real-time Market Data help identify trading set-ups in real-time and express my market views. If you have futures in your trading portfolio, you can check out on CME Group data plans available that suit your trading needs tradingview.com/cme/
Fed rate cut timing: September or October? The Jackson Hole Symposium has set the stage for renewed downside pressure on the U.S. dollar, as investors increasingly position for a 25-basis point Fed rate cut in September.
However, Morgan Stanley assigns only a 50% probability to such a move, suggesting that a September cut is far from guaranteed.
Market focus is also turning to the prospects of a rate cut in October too. The market is assigning only a small chance of two cuts in a row by the Fed.
Perhaps Morgan Stanely’s outlook implies the Fed may delay the widely expected September cut until October instead.
In practice, the market impact could be similar either way. With a softer dollar and stronger equities if Powell signals in September that easing is on the way the following month.
Is USD/JPY Ignoring its Most Important Signal?Summary:
This analysis highlights a significant divergence in the USD/JPY currency pair. While the pair continues to trade at elevated levels, its most historically significant fundamental driver—the 10-year U.S. real yield—is showing signs of weakness. This growing gap is presented as unsustainable.
The core thesis of this analysis is that the divergence will likely close, probably through a notable correction in USD/JPY. The idea is based on an expected reversion to the mean, where one of the strongest correlations in the FX market reasserts itself.
The Core Fundamental Thesis: The Divergence
Experienced market participants know the historically strong, positive correlation between USD/JPY and 10-year U.S. real yields. Typically, when real yields rise, making the dollar more attractive, USD/JPY climbs. Conversely, when they fall, the pair tends to follow.
The Observation : A comparison between the USD/JPY chart and the chart for U.S. real yields reveals a recent decoupling. While real yields have been moving sideways or have even slightly declined, USD/JPY has either pushed to new highs or is holding at levels that appear overbought. This suggests the current exchange rate may no longer be fully justified by its core fundamentals.
Analysis of the Divergence and Potential Resolution
The decoupling appears to be driven by several powerful, but potentially transient, factors:
The Carry Trade : With the interest rate differential between the U.S. and Japan being so wide, the yen carry trade (borrowing in JPY, investing in USD) has become a dominant market force. This creates constant, structural selling pressure on the JPY and demand for the USD, making the pair resilient to slightly falling real yields.
Structural Capital Outflows : Large Japanese institutional investors continue to seek higher yield abroad, leading to significant capital outflows that structurally weaken the yen.
This analysis posits that these factors have caused the market to overheat. Two key catalysts are identified that could resolve this divergence and trigger a move lower:
Catalyst #1: The Threat of Intervention
The Japanese government (MoF) and the Bank of Japan (BoJ) have issued repeated verbal warnings against excessive yen weakness. The market's perceived "line in the sand" appears to be around the 155-160 level. An actual physical intervention (selling USD, buying JPY) would shock the carry trade and could trigger a cascade of long liquidations. The fear of intervention alone can act as a cap on the price.
Catalyst #2: A Shift in Fed Policy
Market focus remains squarely on the U.S. Federal Reserve. As soon as the Fed provides a clear signal that rate cuts are on the horizon, the appeal of holding long dollar positions, and thus the carry trade, would likely diminish rapidly. The anticipation of future lower U.S. rates could start to weigh on USD/JPY long before the first cut is even made.
Conclusion
This analysis of USD/JPY presents a bearish outlook based on a fundamental disconnect with its primary driver. The idea runs contrary to the prevailing market momentum and is instead a bet on the restoration of a historically strong economic relationship. The divergence is clear, but a resolution likely requires a specific catalyst, such as a shift in central bank policy or direct intervention.
Disclaimer:
This content is provided for informational and educational purposes only and does not constitute financial, investment, or trading advice, nor a recommendation to buy or sell any security or currency. The author is not a registered financial advisor. The views and opinions expressed in this analysis are those of the author and are subject to change without notice.
Trading foreign exchange on margin carries a high level of risk and may not be suitable for all investors. The high degree of leverage can work against you as well as for you. Before deciding to trade foreign exchange, you should carefully consider your investment objectives, level of experience, and risk appetite. The possibility exists that you could sustain a loss of some or all of your initial investment and therefore you should not invest money that you cannot afford to lose. Past performance is not indicative of future results. All trading strategies are used at your own risk.

Markets Eye Policy, Positioning, and PerformanceCME_MINI:NQ1! CME_MINI:ES1! CME_MINI:MNQ1! COMEX:GC1! FRED:FEDFUNDS
Happy 4th of August, Traders!
As we head into the new week, here’s a look at what’s on the calendar:
Key Economic Data Releases
Monday:
• Factory Orders (MoM) – June
• Supply: 3-Month Bill Auction, 6-Month Bill Auction
Tuesday:
• Trade Balance (June), Exports (June), Imports (June)
• S&P Services PMI (July), ISM Non-Manufacturing PMI (July)
• Atlanta Fed GDPNow (Q3) – Prelim
• Supply: 52-Week Bill Auction, 3-Year Note Auction
Wednesday:
• German Factory Orders (MoM) – June
• Crude Oil Inventories
• FOMC Member Daly speaks at 11:45 CT
• Fed Governor Cook speaks at 1:00 CT
• Supply: 17-Week Bill Auction, 10-Year Note Auction
Thursday:
• Bank of England Interest Rate Decision
• BoE MPC Meeting Minutes, Inflation Letter, MPC Vote
• BoE Governor Bailey speaks at 8:15 CT
• FOMC Member Bostic at 9:00 CT
• Supply: 30-Year Bond Auction
Crude Oil Update
OPEC+ V8 members have announced an additional 547K bpd unwinding of voluntary cuts. Notably, crude prices have not reacted significantly to the expected OPEC+ figures. As we’ve previously highlighted, the market's focus remains firmly on demand-side factors. Despite geopolitical shocks, trade tensions, and recession concerns, crude oil prices have remained relatively stable—trading within a consistent range for over two and a half years since August 2022. According to Amena Bakr at Kpler, the V8 will meet again on September 7th to potentially reassess the reinstatement of 1.65 million bpd of cuts, currently scheduled to remain in place until the end of 2026.
Earnings Recap
With over half of S&P 500 companies having reported Q2 earnings, YoY earnings growth is now projected at 9.8%, compared to the 5.8% estimate as of July 1, per LSEG data cited by Reuters. More than 80% of reporting companies have surpassed analyst profit expectations—well above the 76% average from the past four quarters.
Macro Outlook
Fed Vice Chair Williams provided further insight into the central bank’s posture ahead of the September FOMC meeting, stating he remains open-minded but continues to believe that modestly restrictive policy is warranted. Williams also emphasized that the notable downward revisions to May and June payrolls were the key takeaway from Friday’s jobs report, reinforcing the theme of softening labor market momentum.
In addition, the Fed announced on Friday that Governor Lisa Cook will resign from the Board effective August 8. A replacement is expected to be named in the coming days, though it is not anticipated to materially alter the policy outlook in the near term.
Looking ahead, if both inflation and unemployment tick higher between now and the September FOMC meeting, it would represent a worst-case scenario for the Fed. The August NFP report due on the first Friday of September and July and August 2025 inflation reports are key data points to monitor before the next FOMC Meeting on September 17th, 2025.
Although equity futures sold off on Friday following a disappointing jobs report, market pricing has adjusted notably. Participants now expect the Fed to deliver three rate cuts in 2025 and two cuts of 25bps each in 2026. This marks a shift from pre-NFP expectations of two cuts in 2025 and three cuts in 2026, per CME FedWatch Tool.
Market Implications:
On the back of rate cut expectations, in our analysis, this may help sustain upside in the equities complex. Although, it may be prudent to adjust portfolio and re-balance strategically according to sectors that may continue to outperform namely tech, AI, defense stocks, commodities and USD per our analysis.
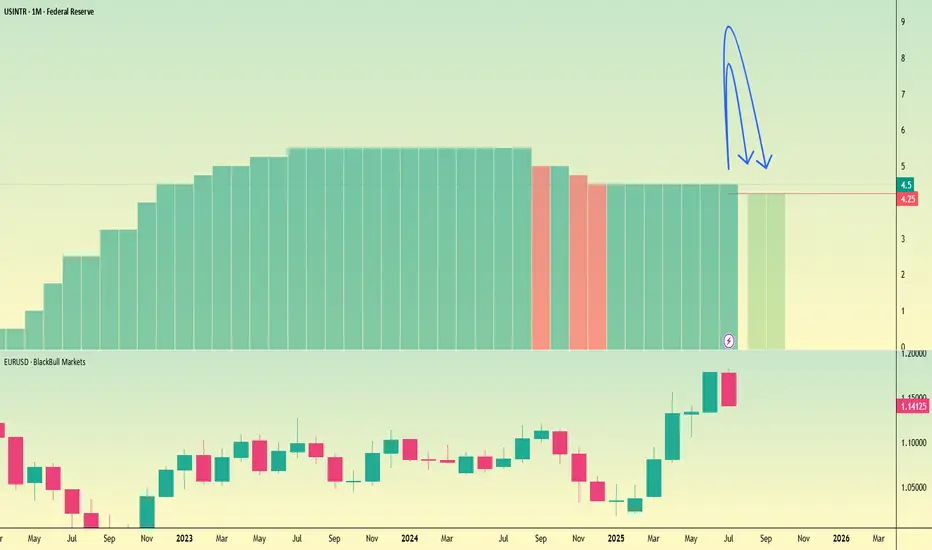
$USINTR -Fed Keeps Rates Unchanged (May/2025)ECONOMICS:USINTR
May/2025
source: Federal Reserve
- The Federal Reserve kept the funds rate at 4.25%–4.50% range for a third consecutive meeting as officials adopt a wait-and-see approach amid concerns about the effects of President Trump’s tariffs.
Policymakers noted that uncertainty about the economic outlook has increased further and that the risks of higher unemployment and higher inflation have risen.

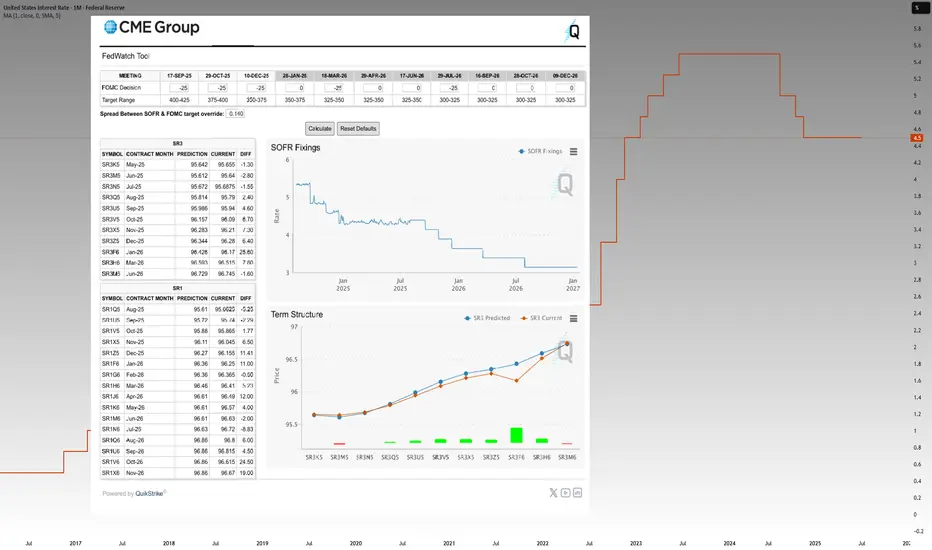
Decoding Fed Rate Changes via Federal Funds Futures Index◉ What Are Federal Funds Futures?
● Definition: Federal Funds Futures are financial contracts traded on the Chicago Mercantile Exchange (CME) that allow market participants to bet on or hedge against future changes in the federal funds rate (the interest rate at which banks lend to each other overnight).
● Purpose: These futures reflect the market's expectations of where the Fed will set interest rates in the future.
◉ How Federal Funds Futures Work?
● Pricing: The price of a federal funds futures contract is calculated as 100 minus the expected average federal funds rate for the contract month.
➖ Example: If the futures price is 95.00, it implies an expected federal funds rate of 5.00% (100 - 95 = 5).
● Contract Expiry: Each contract represents the market's expectation of the average federal funds rate for a specific month.
◉ Why Use Federal Funds Futures?
● Predict Fed Policy: Traders and investors use these futures to gauge the likelihood of the Fed raising, cutting, or holding interest rates.
● Hedge Risk: Institutions use them to protect against potential losses caused by interest rate changes.
● Market Sentiment: They provide insight into what the broader market expects from the Fed.
◉ Steps to Analyze Fed Policy Using Federal Funds Futures
● Step 1: Check Current Federal Funds Futures Prices
Look up the prices of federal funds futures contracts for the months you're interested in. These are available on financial platforms like Bloomberg, Reuters, or the CME Group website.
● Step 2: Calculate the Implied Federal Funds Rate
Implied Federal Funds Rate = 100 - Futures Price.
➖ Example: If the futures price for March is 95.5, the implied rate is 4.5% (100 - 95.5 = 4.5).
● Step 3: Compare Implied Rates to the Current Rate
If the implied rate is higher than the current federal funds rate, the market expects the Fed to raise rates. If it's lower, the market expects a rate cut.
● Step 4: Estimate the Probability of Rate Changes
By comparing the implied rates of contracts expiring before and after an FOMC meeting, you can estimate the probability of a rate change.
➖ Example: If the implied rate for March is 4.75% and the current rate is 4.5%, the market is pricing in a 25 basis point (0.25%) hike.
● Step 5: Monitor Changes Over Time
Track how futures prices change over time. Shifts in prices indicate changes in market expectations. For example, if futures prices drop (implying higher rates), it suggests the market is anticipating a more hawkish Fed.
◉ Practical Applications
● Trading: Traders use federal funds futures to speculate on interest rate movements.
● Economic Forecasting: Economists use them to predict the Fed's monetary policy and its impact on the economy.
● Investment Strategy: Investors adjust their portfolios based on expected rate changes (e.g., shifting from bonds to equities if rates are expected to rise).
◉ Limitations of Federal Funds Futures
● Market Sentiment: Futures prices reflect market expectations, which can be influenced by sentiment and may not always accurately predict Fed actions.
● External Shocks: Unexpected events (e.g., geopolitical crisis, pandemics) can disrupt rate expectations.
● Liquidity: Less liquid contracts (further out in time) may not accurately reflect expectations.
◉ Example Analysis
Let’s assume:
➖ Current federal funds rate: 4.5%
➖ March federal funds futures price: 95.5
● Step 1: Calculate the implied rate:
100 − 95.5 = 4.5%.
● Step 2: Compare to the current rate:
The implied rate (4.5%) is equal to the current rate (4.5%), suggesting the market expects no change in rates by March.
● Step 3:
If the futures price drops to 95.25, the implied rate becomes 4.75%, indicating the market now expects a 25 basis point rate hike..
◉ Why This Matters?
● For Traders: Federal funds futures provide a direct way to bet on or hedge against interest rate changes.
● For Investors: Understanding rate expectations helps in making informed decisions about asset allocation.
● For Economists: These futures offer valuable insights into market expectations of monetary policy.
◉ Conclusion
Federal funds futures are a powerful tool for analyzing and predicting the Fed's interest rate decisions. By understanding how to interpret these futures, traders, investors, and economists can gain valuable insights into market expectations and make more informed decisions. However, it's important to consider their limitations and use them in conjunction with other economic indicators for a comprehensive analysis.
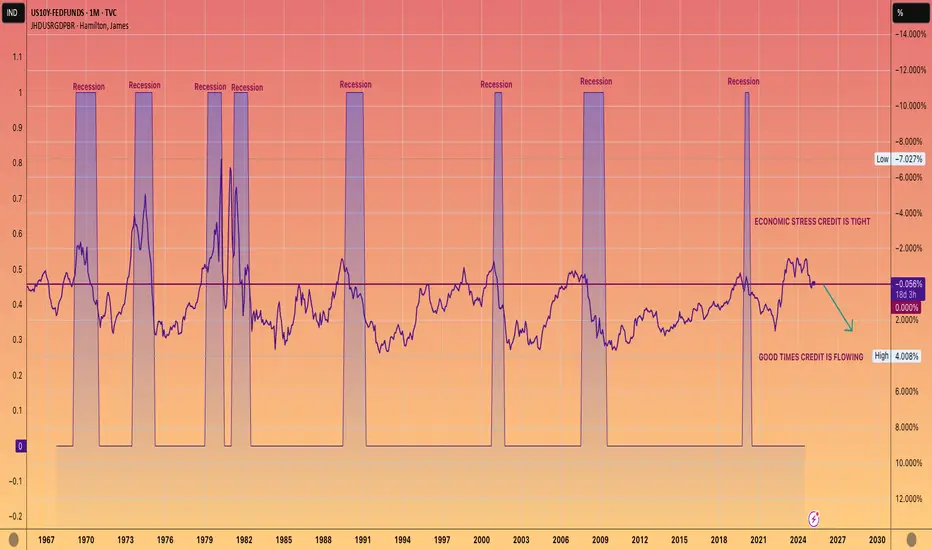
WE ARE COMING OUT OF A RECESSION. NOT GOING INTO ONE.This chart shows 10-year yield, which is closely tied to mortgage rates, minus the Federal funds rate.
When this figure is negative, it typically indicates that we are experiencing a recession or economic downturn.
Conversely, a positive number usually aligns with economic growth, often referred to as the good times.
While it's up to you to determine the reasons behind a official recession not being declared during the Biden administration, the undeniable data reflects a prolonged period of economic strain.
However, the current trend seems to be shifting towards a positive reading, which should lead to more accessible lending and economic growth.
AKA The good times are coming.
Rate Cuts Coming Up?Simply put, yes , the Fed has appeared to switch its position on the FRED:FEDFUNDS remaining flat and are expecting further rate cuts. So what can we hypothesize the market's reaction will be? Well, you guessed it, the market will probably like the news and cash will flow into "risk-on" assets including crypto assets and, of course, stocks. Furthermore, we can infer that the market is not currently pricing in any rate cuts and we have yet to see a TRUE correction specifically in the TVC:DJI , TVC:NDQ , and the $SP:SPX.
The image above shows an example of the 200 EMA significance and how it can be used to buy the dip at the right timing. PLEASE do not try to buy each top and bottom as it's virtually impossible to perfectly time the market. However, it should be suggested that you buy the day after the underlying bounces off the EMA. This is the most effective way to avoid a "fake out" in the trend. When this EMA it touched and rebounded, it could imply that a correction has taken place and that momentary downtrend is about to reverse to continue its previous bull trend. This could look as shown below.
Just because it is shown on the chart doesn't make it so. Please keep in mind an equal and opposite possibility, where the EMA is broken through and a Bear market begins. Even though the odds for this are less than likely, the market simply not getting a rate cut could lead to this situation becoming a reality. In this market, nothing is impossible so be ready for everything.
In conclusion, prepare for rate cut from not only the Fed, but ECB, and Bank of England as well. With this, we can expect rising markets as cash moves its way into risk assets. However, no one is a visionary, so if the markets don't get what they want (and we all know that it wants rate cuts more than anything), expect a lowering market and prepare to exit positions until a rebound appears reasonable.

THE LIQUIDITY PARADOX: Charting the Macro Environment for 2025WEN QE !?
TL;DR there will be NO Quantitative Easing this cycle.
YES the markets will still go to Valhalla.
LIQUIDITY DRIVES MARKETS HIGHER. FULL STOP.
Global M2 has a highly correlated inverse relationship with the US Dollar and 10Y Yield.
Hence why we have been seeing the DXY and 10YY go up while Global M2 goes down.
THE SETUP
We are in a similar setup to 2017 when Trump took office.
M2 found a bottom and ramped up, which toppled the DXY.
Inflation nearly got cut in half until July 2017, where it then slowly started to creep back up as M2 and markets exploded.
To much surprise, all this occurred while the Fed continued to RAISE INTEREST RATES.
This was in part due to policy normalization with a growing economy coming out of the financial crisis and having near 0% interest rates for so long.
In Q4 2014, the Fed paused QT, keeping its balance sheet near neutral for the next 3 years.
As inflation started rising, QT was once again enacted, but very strategically with a slow roll-off in Q4 2017. This allowed markets to push further into 2018.
THE PLAYBOOK
M2 Global Money Supply: Higher
Dollar: Lower
Fed Funds Rates: Lower
10YY: Lower
Fed Balance Sheet: Neutral
Inflation: Neutral
TOOLS
Tariffs
Deregulation
Tax Cuts
Tax Reform
T-Bills
HOW COULD WE POSSIBLY WEAKEN THE DOLLAR?
Trump has been screaming from the mountain tops; TARIFFS.
Tariffs will slow imports and focus more on exports to weaken the dollar.
The strong jobs data that has been spooking markets and strengthening the DXY will be revised to show it’s much worse than numbers are showing.
The Fed will pause QT, saying it has ample reserves, but not enable QE.
At the same time, they could pause interest rate cuts to keep a leash on markets and not kickstart inflation.
Then once all the jobs data is revised and markets get spooked at a softened economy (Q2), they will continue cutting.
WHY DOES THE FED KEEP CUTTING RATES EVEN WITH A STRONG ECONOMY?
In short, the Fed has to cut interest rates for the US to manage its debt.
THE US government is GETTEX:36T in debt.
In 2025, interest projections are well above $1T.
That would put the debt on par with the highest line items in the national budget such as social security, healthcare and national defense.
The Treasury manages its debt by issuing securities with various maturities. When rates are low, they can refinance or issue new debt.
As rates rise, the cost of servicing debt increases, and vice versa.
It’s one of the underlying reasons why the Fed cut (but no one will say it out loud)…
hence why everyone is so confused and screaming that they cut too early and the bond vigilantes have been revolting.
HOW DOES THE MONEY SUPPLY GO UP IF NO QUANTITATIVE EASING?
We’ve seen this before.
President Trump and Treasury Secretary Scott Bessent have been telling you their playbook.
In 2017, deregulation and tax cuts led to an increase in disposable income from individuals and corporations.
Banks created more money in the markets through lending based on increased economic activity.
Global liquidity increased in other major central banks like the ECB, BOJ, and PCOB who were still engaged in QE, and / or maintained very low interest rates, which created more liquidity in the US money supply.
We’re seeing the same thing now with Central Banks around the world.
The tax reform allowed for the repatriation of overseas profits at a lower tax rate, which brought a significant amount of cash back to the US.
Like 2017, the US Treasury will increase short-term bill issuance (T-Bills), providing an alternative to the Reverse Repo (RRP), which reduces RRP usage. This provides liquidity to the markets because once the T-bills mature, funds can use the proceeds to invest in other assets, including stocks.
Banks will buy T-bills and sell in the secondary market or hold til maturity, where they can then lend the cash or invest in equities.
Another strategy to inject cash into the banking system would be standard Repo Operations. Here the Fed buys securities from banks with an agreement to sell them back later. This would increase lending and liquidity.
Hopefully now you can see why markets DON’T NEED QUANTITATIVE EASING !
That would for sure lead to rampant inflation (see 2021), and blow up the system all over again.

The 3-way of Economic Nightmares.I recently had a discussion on X, with regard to the Forecasting ability of High Yield Spreads. I was making the claim they do possess Leading Indicator qualities, while a gentleman took the other side of this debate.
To illustrate my views, I've put together a chart of FedFunds Rate, Unemployment Rate, and said High Yield Spreads.
This chart shows the last ~28yr of the above mentioned series, and how they "play" with one another.
A) Shows the period leading into the "DotCom" Bubble. We see High Yield Spreads rise first - Leading the other two data series. In a Coincident fashion, FedFunds then rolls over, while Unemployment shoots higher. A successful "Forecast" by High Yield Spreads of the impending Downturn/Recession. A successful Leading Indicator.
B) Shows the period leading into the "GFC". We once again see High Yield Spreads rise, this time SHARPLY, albeit with much less "lead time" than the previous example. As with example A), FedFunds and Unemployment then begin their inverse (to each other) dance. Once again showing High Yields Spread giving us that Advanced/Leading warning that things were getting fragile in the economy. A successful Leading Indicator - with admittedly less warning time.
C) Shows us an outlier in this analysis, and for good reason. We see our 'significant' rise in High Yield Spreads, but what we do NOT see, is FedFunds and Unemployment doing their typical dance. Unemployment continues to head lower, while FedFunds begin to rise - the OPPOSITE of what they did in the prior 2 examples.
D) Shows the period surrounding Covid. Once again High Yield Spreads shoot up in a dramatic fashion, warning bells should be going off in markets. Much like 2 of the previous 3 examples, FedFunds had also been in a "hiking" cycle. And right on cue, Unemployment skyrockets; completing our 3-way from Hell.
We now find ourself in E). In the Oval we see our significant rise in High Yield Spreads, but this is accompanied by rising FedFunds, so we do not have our "danger" signal. Unemployment also remains low. We now however see High Yield Spreads beginning to turn up, with talks of Rate Cuts to FedFunds, as well as Unemployment rising.
History may not repeat, but it does often rhyme. Are we starting to see warning signs flashing? Only time will tell, but as stated in previous posts... It's definitely not a time to be leveraged, or riding on large gains you haven't secured.
TLDR; High Yield Spreads followed by Fallings FedFunds and Rising Unemployment = Market/Economic Stroke.
As always, good luck, have fun, practice solid risk management. And thank you for your time.

Oil giving us a HINTMarkets keep hitting ATHs, gold doesn't stop hunting for higher highs, and oil underperforms.
Anytime price reacts to a historic zone it either sells off or rallies, and then reverses to confirm if the reaction in price was indeed true/false.
In this example oil sold off brining us to point 'A' and is now at point 'B' which is the pullback phase also know as a continuation/pause to the overall trend. This happened during the times of 2019 and a larger pattern that lasted from 2011 - 2014. Each time this pattern played out in the oil markets negative outcomes occurred in the rest of markets.
To add more confluence to this TA I'm analyzing the MACD distribution patterns (the same way I analyze price action), the agreement and disagreement between the two, and how price action reacts around the EMA lvls.
We probably have about a year or less to earn more gains trading crypto and stocks till the market goes bust.

Macro Monday 58 - Recession Warning Charts Worth Watching Macro Monday 58
Recession Charts Worth Watching
If you follow me on Trading view, you can revisit these charts at any time and press play to get the up to date data and see if we have hit any recessionary trigger levels. They are very handy to have at a glance.
CHART 1
10 - 2 year treasury yield spread vs U.S. Unemployment Rate
Subject chart above
Summary
▫️ The chart demonstrates how the inversion of the Yield Curve (a fall below 0 for the blue area) coincides with U.S. Unemployment Rate bottoming (green area) prior to recession onset (red areas).
▫️ The yellow box on the chart gives us timelines on how many months passed, historically, before a confirmed economic recession after the yield curves first definitive turn back up towards the 0% level (also see circled numbers showing connecting bottoming unemployment rate).
▫️ Using this approach, you can see that the average time frame prior to recession onset is 13 months (April 2024) and the max timeframe is 22 months (Jan 2025).
▫️ This is only a consideration based on historical data and does not guarantee a recession or a recession timeline however it significantly raises the probability of a recession, and the longer into the timeframe we are the higher that recession probability.
▫️ We typically we have a recession (red zones) either during or immediately after the yield curve moves back above the zero level. At present we are at -0.08 and fast approaching the zero level which is one of the most concerning data points of this week.
▫️ The unemployment rate moved from a low of 3.4 in April 2023 to 4.3 in July 2024. This is a significant increase and is typical prior to recession onset.
Conclusion
▫️ If both the 10 - 2 year treasury yield spread and the U.S. Unemployment Rate continue in their upwards trajectory in coming weeks and months, this is a significant risk off signal and recession imminent warning.
▫️ The Sahm Rule triggered this week which has been one of the most accurate indicators of a recession starting. It is triggered when the three-month moving average of the U.S Unemployment Rate above rises by 0.50 percentage points or more, relative to its low over the previous 12 months. The Sahm rule triggering adds to recession concerns, however the designer of the rule has stated that I may not be accurate factoring in recent events like COVID-19 which has thrown unemployment and economic data to extremes.
What is the 10-2 year Treasury yield spread?
The 10-2 year Treasury yield spread represents the difference between the yield on 10-year U.S. Treasury bonds and 2-year U.S. Treasury bonds. It’s calculated by subtracting the 2-year yield from the 10-year yield. When this spread turns negative (inverts), it’s significant because it often precedes economic downturns. An inversion suggests that investors expect lower future interest rates, which can signal concerns about economic growth and potential recession. In essence, it’s a barometer of market sentiment and interest rate expectations
What is the U.S. Unemployment Rate
The unemployment rate is calculated by dividing the number of unemployed people by the total labor force in the U.S (which includes both employed and unemployed individuals).
CHART 2
Interest Rate Historic Timelines and impact on S&P500
Summary
▫️ This chart aims to illustrate the relationship between the Federal Reserve’s Interest rate hike policy and the S&P500’s price movements.
▫️ This is obviously pertinent factoring in the expectations of a rate cut in Sept 2024. This chart which I shared in Sept 2023 may have accurately predicted this likely Sept 2023 interest rate cut but is this positive for the market?
▫️ Interest Rate increases have resulted in positive S&P500 price action
▫️ Interest rate pauses are the first cautionary signal of potential negative S&P500 price action however 2 out of 3 pauses have resulted in positive price action. The higher the rate the higher the chance of a market decline during the pause period.
▫️ Interest rate pauses have ranged from 6 to 16 months (avg. of 11 months).
▫️ Interest rate reductions have been the major, often advanced warning signal for significant and continued market decline (red circles on chart)
▫️ Interest rates can decrease for 2 to 6 months before the market eventually capitulates.
▫️ In 2020 rates decreased for 6 months as the market continued its ascent and in 2007 rates decreased for 2 months as the market continued its ascent. This tells us that rates can go down as prices go up but that it rarely lasts with any gains completely wiped out within months.
Conclusion:
▫️ Rate cuts should signal significant concern as most are followed immediately by recession or followed by a recession within 2 to 6 months of the initial cut. This is high risk territory.
▫️ During the week I seen the 2 year treasury bill which matches closely the Federal Reserve interest rate cycle. The spread developing between the two suggests rate cuts are imminent. Remember point one above. The chart below:
CHART 3
Relationship between 2 Year Bonds and Interest Rate
▫️ Very briefly, you can see the red areas where gaps formed when the Federal Reserve interest rate was lagging behind the 2 year treasury bonds declines.
▫️ Currently there is a large gap of 1.74% between the two data sets. The last time we had gaps like this were prior to the 2000 and 2007 recessions. Even prior to COVID-19 you can see the Federal reserve was playing catch up.
What to watch for in coming weeks and months?
▫️ If both the 10 - 2 year treasury yield spread and the U.S. Unemployment Rate continue in their upwards trajectory in coming weeks and months, this is a significant risk off signal and recession imminent warning.
▫️ Since 1999 the Federal reserve interest pauses have averaged at 11 months. July 2024 is the 11th month. This suggests rate cuts are imminent.
▫️ The 2 year bond yield which provides a lead on interest rate direction is suggesting that rates are set to decline in the immediate future and that the Fed might lagging in their rate cuts. Furthermore, rate cuts are anticipated in Sept 2024 by market participant's.
▫️ Finally, rate cuts should signal significant concern as most are followed immediately by recession or followed by a recession within 2 to 6 months of the initial cut. Yet the market appears to be calling out for this. This is high risk territory. Combine this with a treasury yield curve rising above the 0 level and an increasing U.S. unemployment rate and things look increasingly concerning.
We can keep any eye on these charts for a lead on what might happen next. I will be reviewing some other charts over coming days around jobless claims and ISM figures to see how positive and negative we are looking.
PUKA

2 Year yields are weakeningWhich often signals a incoming recession.
The market leads the #FED who always raise and lower rates too late.
We have #Unemployment starting to tick up
Tight financial conditions, delinquencies on the rise.
So make hay over the next few months in memestocks, coins, bitcoin, alts, NVDA and so on.
But don't be left holding the hot potato when the music stops playings.
#Macro
#Meltup
#NVDA
#Nasdaq
#Stocks
#Bitcoin
#Altcoins
#Ethereum
#Pulsechain

Unemployment, FED Rates, SPXLooks like market bottoms just before the Unemployment peak.
Market peaks just before fed starts reducing the rates.
At the current situation, we have fed fund rates high and also unemployment started to climb.
Will be looking at the unemployment going high and markets roll over and fed cuts rates.
if FED keeps the same rate for long, something in the economy will break and they have to reduce the rate and if it happens then it's already too late.
Looks like CD's and earning ~5% interest on cash is much better than risking for very limited upside in the market.

UNEMPLOYMENT | FED FUNDS RATE | S&P500As requested (through a few personal DMs), I have created this companion post to allow for easy exploration of this relationship with respect to the S&P500.
As always your thoughts and inputs are appreciated.
Enjoy!

Bearish on DXYThis week we have CPI and US Fed funds rate announcements. Most probably we don't get a rate cut for now (as the market expects). However, I think this week the announcements are coming out with a more dovish tone.
Let's see what happens . . .
If the CPI number come out lower or equal to the expectations and the Fed Chair Powell signals 1 or 2 rate cuts for this year. I believe we can expect the yellow scenario. Otherwise, we can expect the red scenario happens in short term.
