Russell 2000: Is the lagging small-cap about to charge higher?Russell 2000 is the laggard, while the S&P 500, Nasdaq, and Dow scale new record highs.
Could small caps be next to break out?
While all major US equity indices are hitting new all-time highs, the Russell 2000 is still consolidating just below resistance. This sets up a pivotal moment for traders as the Fed decision looms and Q4 earnings heat up.
Price is holding above the lower trendline of a potential ascending triangle pattern, with buyers defending support and momentum building for a potential breakout above peak resistance.
RSI on a daily basis sits in the mid-50s (neutral), but with room for renewed upside if a breakout occurs. Alternatively, a reset down to oversold could lead to a short-term decline of around 5% to the prior bottom.
But October’s strong earnings and increased bets on Fed rate cuts provide a positive tailwind for small caps this quarter.
Watch for a shift in flows from big tech and mega-caps to small caps if market breadth improves post-Fed.
Keep an eye on the top, as a breakout could open the door to new all-time highs and fresh momentum for the Russell 2000. Don’t miss the rotation potential as Q4 trading picks up.
This content is not directed to residents of the EU or UK. Any opinions, news, research, analyses, prices or other information contained on this website is provided as general market commentary and does not constitute investment advice. ThinkMarkets will not accept liability for any loss or damage including, without limitation, to any loss of profit which may arise directly or indirectly from use of or reliance on such information.
FOMC

DXY Approaching 98.900 — Weak Labor Market Could Push Fed DovishHey Traders, in today’s trading session we’re monitoring DXY for a potential selling opportunity around the 98.900 zone.
The index continues to trade within a descending channel and is currently in a correction phase, approaching the upper boundary near 98.900, which aligns with channel resistance.
Fundamentals: Recent data continues to show signs of a weakening U.S. labor market, with job growth slowing and unemployment ticking higher. This softening backdrop increases pressure on the Federal Reserve to adopt a more dovish stance in upcoming meetings, potentially weighing further on the dollar.
Next move: Watching for bearish confirmations around the 98.900 zone — rejection here could resume the broader downtrend.
💬 What’s your outlook on the Fed’s next move? Drop your thoughts in the comments!

USDCAD Faces Pressure as DXY Correction Nears Key Resistance!!Hey Traders, in today’s trading session we are monitoring USDCAD for a potential selling opportunity around the 1.40200 zone.
The pair remains in a broader downtrend and is currently in a correction phase, approaching the trendline and resistance area at 1.40200.
From a macro perspective, the US Dollar Index (DXY) is testing its 98.900 channel resistance, where upside momentum may fade amid a weakening U.S. labour market and rising expectations for a dovish shift from the Fed.
A potential DXY rejection from that level could amplify downside pressure on USDCAD, especially if oil continues to find demand and supports the Canadian Dollar.
Next move: Watching for bearish confirmation near 1.40200 for potential continuation of the broader downtrend.
💬 What’s your view on USDCAD and the Dollar outlook this week? Share your thoughts below!

Live Trading - Breakeven pt.2Was aiming for a gap fill.
Sold at breakeven, and protected capital.
CBOT_MINI:YM1!

AUDUSD Eyes 0.6500 as Softer CPI and Weak Jobs Data Weigh on USDHey Traders,
In the coming week, we’re monitoring AUDUSD for a potential buying opportunity around the 0.65000 zone. The pair remains in a broader uptrend, with the current pullback shaping up as a healthy correction toward key structural support.
Structure:
Price continues to respect its ascending trendline, and the 0.65000 area aligns with a strong confluence of horizontal support and dynamic trend structure — a level that has previously attracted strong buying momentum.
Macro Outlook:
The latest U.S. inflation print came in softer at 3.0%, undershooting expectations, while labour market data continues to signal cooling conditions. Together, these developments reinforce a dovish shift in Fed sentiment, weighing on the U.S. Dollar Index (DXY).
At the same time, Gold continues to rally, underpinned by the weakening Dollar and rising safe-haven demand. Given the positive correlation between AUD and Gold, this macro backdrop strengthens the bullish case for AUDUSD in the coming sessions.
Next Move:
A sustained bid around 0.65000 could mark the start of another impulse leg higher — targeting a retest of recent highs if momentum confirms.
Trade safe,
Joe

116k in focus: breakout/fade and lower buy zones__________________________________________________________________________________
Market Overview
__________________________________________________________________________________
BTC is consolidating just below ~116k after a three-bar rebound, pressing into a clear HTF supply. Structure improved versus last week but momentum is stalling at a 2D pivot.
Momentum: Range with a slight bearish tilt 📉 — the advance is stalling under 115.9–116.1k (2D pivot), stay cautious until reclaimed.
Key levels:
• Resistances (2D/4H/6H): 115.9–116.1k (2D pivot), 118.0–118.5k (4H/6H), 126.6–126.9k (D/W).
• Supports (4H/3D/6H+): 114.3–113.65k (4H/2H), 111.97k (3D pivot), 104.84k and 102.4–102.9k (ISPD floors 6H + tight 1H/2H/12H cluster).
Volumes: Mostly moderate, with very high 30m prints into 116k — watch for exhaustion if no follow-through.
Multi-timeframe signals: 1D/1W up, 12H/6H down, intraday (4H/2H/1H) up but tiring at 116k — local bearish confluence at resistance; 113.65k/111.97k are the first downside shelves.
Risk On / Risk Off Indicator: NEUTRAL SELL — confirms tactical caution beneath resistance and aligns with the slowing momentum.
__________________________________________________________________________________
Trading Playbook
__________________________________________________________________________________
Strategic context: mixed trend with HTF resistance at 116k — trade on confirmation, react to clean breaks or rejections.
Global bias: Overall NEUTRAL SELL while 116.086 isn’t reclaimed/held; short bias invalidated on ≥4H close above 116.500.
Opportunities:
• Breakout buy: Buy the break/hold >116.086 then a clean 4H retest — aim 118.0–118.5k then 126.6–126.9k.
• Tactical sell: Fade 115.9–116.1k rejection; add on failed retest of 113.65k — target 114.3–113.65k then 111.97k/110.99k.
• Deep-dip buy: Scale at 104.84k and 102.4–102.9k on a ≥2H reversal signal.
Risk zones / invalidations:
• A break-and-hold above 116.086 invalidates the immediate fade.
• A HTF close below 103k would endanger the corrective-then-bullish thesis.
Macro catalysts (Twitter, Perplexity, news):
• FOMC: easing bias in focus — main driver of volatility and direction.
• US–China headlines: two-sided risk, can trigger a break or rejection at 116k.
• US earnings (MAG7): risk sentiment sensitivity with spillovers to crypto.
Action plan:
• Tactical short: Entry: 115.9–116.1k (confirmed rejection) / Stop: >116.5k / TP1: 114.3–113.65k, TP2: 111.97k, TP3: 110.99k / Approx. R:R: 1.5R→TP1, 2–2.5R→TP2.
• Breakout long: Entry: close >116.086 + held retest / Stop: <116.0k / TP1: 118.0–118.5k, TP2: 126.6–126.9k / Approx. R:R: 1.5R→TP1, 3R→TP2.
__________________________________________________________________________________
Multi-Timeframe Insights
__________________________________________________________________________________
Big picture remains firm, mid‑TFs lean down, and lower TFs are stalling at resistance — confirmation is key.
1D/1W: Stabilized up-bias; constructive structure but capped near ~116k. A clean close >116.086 opens 118–118.5k, then 126.6–126.9k.
12H/6H: Down filters; momentum fades at supply. Rejection favors 113.65k then 111.97k.
4H/2H/1H/30m/15m: Intraday up sequence with wicks below 116k and very high 30m volume — need a break-and-hold, else fade risk to 114.3–113.65k.
Major divergences/confluences: HTF supply at 116k + Risk On/Off neutral-sell; strong demand confluence lower (104.84k and 102.4–102.9k cluster) for asymmetric longs on deeper pullbacks.
__________________________________________________________________________________
Macro & On-Chain Drivers
__________________________________________________________________________________
A catalyst-heavy week led by the FOMC; 7‑day ETF flows are negative and sentiment cautious, limiting upside impulse at resistance.
Macro events: FOMC with high odds of easing — ups volatility; US–China/trade headlines are two-sided; busiest US earnings week (MAG7) shapes risk appetite.
Bitcoin analysis: Tactical pivot near ~114.9k; a break/hold above 116k targets 126k; conversely, CME/futures gap magnets around 112.3k and 110.99k if momentum fades.
On-chain data: Cautious tone — elevated put demand, trading below STH cost basis, higher implied vol; consistent with a transition/consolidation phase.
Expected impact: Technical “neutral sell” bias holds unless 116k breaks; FOMC may force resolution (clean break or sharp rejection).
__________________________________________________________________________________
Key Takeaways
__________________________________________________________________________________
BTC sits beneath HTF resistance at ~116k into a pivotal macro week. Trend is neutral with a local bearish lean; the highest‑probability plays are the fade of 115.9–116.1k or the confirmed breakout retest. The FOMC is the key swing factor that can validate or negate these setups. Stay patient, trade the confirmation, and size around event risk.

EURUSD BULLS Could be backBased on lower than expected CPI that was out last week and expected rate cut on Wednesday EURUSD is likely to maintain a slow bullish tone. I haven't modified my last week set up a lot but there is a small trendline 4hr time frame that is likely to be followed towards Wednesday's event. And if Powell maintains a dovish stance the uptrend will officially resume towards NFP. Traders are remaining bullish because of Fed rate cuts path, expecting a two rate cut this year. I am looking forward to making adjustments depending on how events will play out this. In line also is the ECB Main financing rate which is expected to remain unchanged thus giving the EURO stability. I will remain patient and make adjustments when necessary but for now I maintain a bullish but cautious tone.

27/10/25 Weekly OutlookLast weeks high: $115,481.36
Last weeks low: $106,688.94
Midpoint: $111,085.15
It's FOMC week again and with it comes speculation and volatility. With the Fed forecast to cut rates another 0.25% where does this leave Bitcoin?
After weeks of consolidation between $106,000 - $111,000 BTC broke above $112,000 resistance level suggesting that sellers have largely been absorbed and momentum is returning to the upside. Trading volume surged as BTC crossed the $112,000 threshold, indicating strong conviction from both institutional and retail participants.
Short-term volatility is expected around the FOMC announcement, I would not rule out a $112,000 retest, it would be a good indicator of just how strong this breakout move is. Macro conditions continue to favor Bitcoin’s long-term bullish case particularly if the Fed signals an eventual shift toward easing in 2026 which is already being discussed.
The next major test lies around $120,000 if weekly high resistance is flipped, but a decisive close above this threshold would likely trigger another wave of momentum buying toward $125K and beyond.
For the bear case a loss of $112,000 would mean a revisit of the same $106,000 - $111,000 range and an increasing loss of momentum for the bull run.
Good luck this week everybody!

NZDUSD Eyes 0.57350 as Fed Turns Dovish! Hey Traders,
In today’s trading session, we’re monitoring NZDUSD for a buying opportunity around the 0.57350 zone. The pair is trading in an uptrend and currently in a correction phase, approaching the 0.57350 support and resistance area, which aligns with the trend structure.
On the fundamental side, the U.S. labor market continues to show signs of cooling, with recent comments from Fed officials acknowledging that the slowdown “needs to be reflected in policy decisions.” This softer tone ahead of this week’s FOMC meeting could reinforce a dovish stance and weigh on the U.S. Dollar, potentially providing support for NZDUSD upside.
Trade safe,
Joe

Analyzing the Upcoming Trading Week, FOMC Interest Rate DecisionCBOT_MINI:YM1!
FOMC interest rate decision on Wednesday.
Trading plan for tomorrow.
Emphasis on moving stop to breakeven on future trades.
Predictions post-fed.

EURUSD Breakout and Potential RetraceHey Traders, in today's trading session we are monitoring EURUSD for a buying opportunity around 1.15600 zone, EURUSD was trading in a downtrend and successfully managed to break it out. Currently is in a correction phase in which it is approaching the retrace area at 1.15600 support.
Trade safe, Joe.

BTC: Range below 114k — breakout soon or fresh rejection?__________________________________________________________________________________
Market Overview
__________________________________________________________________________________
BTC is range-bound below 112,600–114,000, with improving intraday momentum but a firm HTF supply shelf overhead. The broader backdrop stays constructive while supports hold, pending a liquidity catalyst.
Momentum: Range with a bullish skew 📈 if 112,600 breaks and holds.
Key levels:
- Resistances (12H–1D): 112,600–114,000, then 116,000.
- Supports (2H–1D): 111,000–110,300, then 108,600.
Volumes: Normal to moderate (1H–4H), acting as an amplifier on rejections/breakouts.
Multi-timeframe signals: 1D Up, while 12H/6H/4H remain Down; intraday (2H/1H/30m/15m) Up but capped under 112,600–114,000.
Risk On / Risk Off Indicator: Mixed read (NEUTRAL SELL vs NEUTRAL BUY) → overall neutral stance, waiting for flow confirmation; this aligns with a range rather than a trend.
__________________________________________________________________________________
Trading Playbook
__________________________________________________________________________________
Strategically, the dominant trend is neutral below 112,600–114,000; stay opportunistic: buy a clean breakout or tactically sell a clear rejection.
Global bias: Neutral with buy-on-breakout skew above 112,600; key invalidation if 1D closes below 108,600.
Opportunities:
- Breakout long: Close + retest above 112,600 targeting 114,000 then 116,000.
- Buy the dip: 111,000–110,300 (or 108,600) on a bullish 2H–1D rejection.
- Tactical short: Rejection at 112,600–114,000 aiming 111,000 then 110,300.
Risk zones / invalidations:
- Below 108,600 on a 1D close: HTF structure weakens → risk of acceleration toward 106,800.
- Above 114,000 on 4H/1D: invalidates range shorts and opens 116,000.
Macro catalysts (Twitter, Perplexity, news):
- FOMC and liquidity tone (potential QT end) as key driver.
- US equities at ATHs: supportive risk backdrop while it lasts.
- BTC spot ETF flows mixed: uneven tailwind, needs confirmation.
Action plan:
- Entry: 112,650–112,900 (clean break/retest on 1H–4H).
- Stop: below 111,900 (breakout play) or below 110,300 (dip play).
- TP1: 114,000; TP2: 116,000; TP3: 118,500 (if extension).
- Approx R/R: 1.8R to 2.5R depending on stop and scaling.
__________________________________________________________________________________
Multi-Timeframe Insights
__________________________________________________________________________________
Overall, HTFs stay rangey under a stacked resistance shelf, while LTFs press into the 112,600 pivot.
1D: Uptrend but capped beneath 112,600–114,000; a clean reclaim/hold would unlock 116,000.
12H/6H/4H: Down/corrective; countertrend bounces likely capped at 112,600–114,000 absent confirmed closes.
2H/1H/30m/15m: Rising structure with higher lows; continuation on break & hold of 112,600, otherwise rotation risk toward 111,000–110,300.
Major divergences: Mixed 1D Up vs 12H Down; raises the bar for confirmation (retest + volume) on any breakout.
__________________________________________________________________________________
Macro & On-Chain Drivers
__________________________________________________________________________________
Macro/on-chain is mixed: potential risk-on via liquidity, but demand signals remain cautious below resistance.
Macro events: Fed QT reportedly nearing an end (near-term), risk supportive; US indices at ATHs; FOMC next → primary liquidity tone driver.
Bitcoin analysis: Pinned between the 200D (~108.5k) and STH cost basis (~113.1k); a daily close above ~113.1–116.0k unlocks higher; loss of ~108.5k risks 100–101k.
On-chain data: Below STH cost basis, demand fatigue; elevated LTH distribution; cautious options → need flow impulse to validate a breakout.
Expected impact: Constructive technical bias contingent on a confirmed break; without liquidity impulse, the range can persist.
__________________________________________________________________________________
Key Takeaways
__________________________________________________________________________________
Range beneath 112,600–114,000 with improving intraday but HTF supply still in control.
- Trend: Neutral, bullish if a clean break above 112,600; key supports at 111,000–110,300 and 108,600.
- Setup: Break & retest > 112,600 toward 114,000/116,000; alternative is disciplined dip-buys on bullish wicks at 110,300–108,600.
- Macro: FOMC + liquidity tone (potential QT end) is the main trigger.
Stay patient: wait for confirmation (close + retest + volume) and let flows lead risk. ⚠️
BTC: Breakout or a deeper dip into 105–102k?__________________________________________________________________________________
Market Overview
__________________________________________________________________________________
BTC is pinned just below 112.0–112.5k, with 12H/1D still trending up but capped by a risk‑off macro backdrop. Volatility is compressing and flows are mixed, favoring catalyst‑driven moves.
Momentum: 📉 Neutral‑to‑bearish tactically below 112.0–112.5k until a clean daily breakout confirms.
Key levels:
- Resistances (HTF): 112.0–112.5k (key pivot), 114.6–115.0k, 115.8–116.6k.
- Supports (HTF): 109.5–110.0k (demand block), 107.0–107.5k, 105.0–102.0k (ISPD staircase: 105.0 → 103.5 → 102.6–102.0k).
Volumes: Moderate to normal, no notable extremes (mainly intraday).
Multi-timeframe signals: 1D/12H = Up, 2H/4H = Down, 15/30m = Up; this mix warrants clear confirmation at key gates (112.5k up, 109.5k/107k down).
Risk On / Risk Off Indicator context: NEUTRE VENTE — a headwind that contradicts the HTF uptrend and argues for caution on break attempts.
__________________________________________________________________________________
Trading Playbook
__________________________________________________________________________________
Strategic stance: HTF trend remains constructive, but we favor patient, opportunistic execution while price sits below 112.5k.
Global bias: Neutral‑cautious (NEUTRE VENTE) while < 112.5k; bullish invalidation on a daily close above 112.5k.
Opportunities:
- Breakout buy: Buy a confirmed close/retest above 112.5k targeting 114.6k then 116.5k.
- Tactical sell: Fade a firm rejection at 111.9–112.5k with volume, target 110.0k then 107.0k.
- Buy‑the‑dip: Scale in on clean reversal within 105.0–102.0k (ISPD), add on hold above the reclaimed floor.
Risk zones / invalidations:
- Break below 109.5k opens 107.0k; losing 107.0k can accelerate toward 105.0–102.0k.
- Failed follow‑through after >112.5k breakout = trap; invalidate on a close back below 111.9k.
Macro catalysts (Twitter, Perplexity, news):
- US CPI ahead: a hotter print revives “higher for longer” and weighs on breakouts.
- US spot ETF flows: 7‑day average negative — headwind until it improves.
- Fed: 2025 cut cycle started but split views — volatility remains elevated.
Action plan:
- Breakout long: Entry 112.6k (validated retest) / Stop 111.9k / TP1 113.2k, TP2 114.6k, TP3 116.5k (R/R ≈ 1.8–2.0).
- Fade short: Entry 112.2k (confirmed rejection) / Stop 112.6k / TP1 110.0k, TP2 107.0k, TP3 105.0k (R/R ≈ 2.0).
- Dip long (scales): Entry 105.0–102.0k on ≥2H reversal candle / Stop below hit floor / TP1 107.0k, TP2 110.0k, TP3 112.5k (R/R ≈ 2–3).
__________________________________________________________________________________
Multi-Timeframe Insights
__________________________________________________________________________________
In sum, higher timeframes are constructive, but mid‑TF weakness still caps upside attempts.
1D/12H: Uptrend, yet 112.0–112.5k is the breakout “gate”; moderate volumes → demand a clean close/follow‑through before adding risk.
6H: Recovery stalls below 112.7–113.0k; watch 105.0k (6H ISPD) for a quality reversal‑buy trigger.
4H/2H/1H: Corrective bias; rallies fade near 112.9–113.4k while 109.3–110.0k holds — loss exposes 107.0k.
30m/15m: Micro uptrend inside the range; momentum trigger above 112.25–112.3k, but macro headwind argues for smaller size and confirmed follow‑through.
__________________________________________________________________________________
Macro & On-Chain Drivers
__________________________________________________________________________________
Macro is event‑driven (CPI, ETF flows), while on‑chain/derivatives point to a hedged, cautious regime.
Macro events: US CPI in focus (a “hot” print would weigh on breakouts); US spot ETF 7‑day average flows negative (risk‑off tone); the Fed started a 2025 cut cycle but remains split — volatility risk persists.
Bitcoin analysis: Range framed by 112k (daily close needed) and ~106–107k; volatility compression lifts breakout odds, but cooled flows argue for selectivity.
On-chain data: BTC below STH cost basis (~113.1k) and ~108.6k quantile; options put‑skew and elevated IV — a hedged transition regime.
Expected impact: Technical bias stays “neutral‑sell” until a daily close > 112.5k or a strong reversal on clustered floors at 105–102k.
__________________________________________________________________________________
Key Takeaways
__________________________________________________________________________________
BTC trades a liquidity‑heavy range below 112.5k with stepped supports toward 107k and 105–102k.
- Overall trend: neutral with a slight downside skew at resistance.
- Most relevant setup: confirmed breakout above 112.5k or quality reversal buy within 105–102k.
- Key macro factor: US CPI and persistently soft ETF flows shape timing and conviction.
Stay disciplined: wait for validation or quality dips before deploying risk.

GBPUSD Breakout and Potential RetraceHey Traders, in today’s trading session, we’re monitoring GBPUSD for a potential buying opportunity around the 1.32500 zone. The pair has recently broken out of its previous downtrend and is now in a correction phase, approaching a key retracement area at 1.32500, which also aligns with strong support on the 4H structure.
Fundamentals:
All eyes are on the upcoming U.S. CPI release, with markets expecting a slightly softer print. A weaker inflation figure could reinforce dovish expectations for the Fed, potentially putting further pressure on the Dollar and supporting GBPUSD upside into the end of the week.
Next Move:
Watching price action at 1.32500 for a possible bullish reaction and continuation toward recent highs.
Trade safe,
Joe

BTC: Risk-off range below 110k, focus on 106.5k/105k/103k__________________________________________________________________________________
Market Overview
__________________________________________________________________________________
BTC is range‑bound with a cautious tilt: sellers cap 110k while 106.5k keeps holding. The 12H pressure remains down even as higher timeframes stay resilient.
Momentum: Range with a bearish tilt 📉 — multiple rejections below 110k and repeated defenses at 106.5k; 12H risk filter points Down.
Key levels:
• Resistances (HTF→Mid): 109,800–110,200 (supply), 111,500–112,000 (supply), 112,800–113,200 (HTF supply).
• Supports (HTF→Mid): 106,500–106,700 (pivot), 105,200–104,900 (6H floor ~105,013), 103,200–103,500 (2H/4H cluster + D pivot).
Volumes: Moderate on 30m–4H; no outsized catalyst.
Multi-timeframe signals: 12H/6H/4H/2H/1H trending down, 1D/1W up; below 110k, risk of 106.5k then 105k retests unless price reclaims 110.8k with volume.
Risk On / Risk Off Indicator: NEUTRAL SELL — confirms the cautious bias and the cap near 110k.
__________________________________________________________________________________
Trading Playbook
__________________________________________________________________________________
Strategic stance: range market with a risk‑off tilt; favor tactical fades at supply and only take defensive longs on validated floors.
Global bias: NEUTRAL SELL below 110k; main invalidation: daily close > 110,800 with volume and follow‑through.
Opportunities:
• Defensive long at 105,200–104,900 if wick + ≥2H reversal close; target 108k/110k.
• Secondary long at the 103,200–103,500 cluster on clean 2H/4H signal; add if 106,700 is reclaimed.
• Tactical short on rejection at 109,800–110,200 (or 111.5–112k) aligned with 12H Down; add on breakdown of 106,500 with volume.
Risk zones / invalidations:
• Sustained break < 106,500 invalidates an immediate bounce and opens 105k then 103k.
• Impulsive reclaim > 110,800 invalidates tactical shorts and unlocks 112–114k.
Macro catalysts (Twitter, Perplexity, news):
• Cautious liquidity into FOMC week; CPI eyed as a decisive catalyst.
• Soft 7‑day BTC spot ETF flows (risk‑off tone), making rallies fragile under 110–112k.
• Potential geopolitics/energy headline risk that can amplify moves at key levels.
Action plan:
• Long Plan (105k): Entry 105,200–104,900 / Stop ~104,500 / TP1 108,000, TP2 109,800–110,200, TP3 111,500–112,000 / R:R ≈ 1.8–2.5.
• Long Plan (103k): Entry 103,200–102,900 / Stop ~102,400 / TP1 106,700, TP2 108,000, TP3 109,800–110,200 / R:R ≈ 2.0–2.8.
• Short Plan (110k): Entry 109,800–110,200 / Stop 110,800 / TP1 108,200, TP2 106,700, TP3 105,200 / R:R ≈ 1.6–2.2.
__________________________________________________________________________________
Multi-Timeframe Insights
__________________________________________________________________________________
Intraday timeframes (≤12H) lean lower while 1D/1W remain resilient above key supports.
1D/1W (Up): Constructive structure, but 112.8–113.2 remains a HTF supply cap; bullish confirmation needs a reclaim >110.8k with volume.
12H/6H/4H/2H/1H/30m/15m (Down): Lower highs below 110k; 106.5k then 105k as key demand; breakdown of 106.5k risks acceleration.
Major confluences/divergences: Strong confluence around 103k (2H/4H cluster + D pivot ~103.5k) and a 6H floor near 105,013; the deeper 102k+ zone sits lower — high quality if reached.
__________________________________________________________________________________
Macro & On-Chain Drivers
__________________________________________________________________________________
Macro is in “wait‑and‑see” mode into FOMC/CPI and ETF flows stay soft, weighing on rallies under 110–112k.
Macro events: Markets cautious into FOMC and CPI; USD/liquidity guarded; geopolitics/energy risks can add volatility near key levels.
Bitcoin analysis: 7‑day negative BTC spot ETF flows (risk‑off backdrop); technical structure centered on 106.5k/105k/103k versus 110–112k supply.
On-chain data: Price below STH cost basis (~113.1k) and below the 0.85 quantile (~108.6k); elevated LTH distribution; put‑leaning options skew; higher IV — a defensive stance.
Expected impact: Technical NEUTRAL SELL bias intact; rallies likely faded unless volume improves and a >110.8k close confirms.
__________________________________________________________________________________
Key Takeaways
__________________________________________________________________________________
BTC remains range‑bound with a risk‑off tilt between 106.5k and 110k.
- Overall trend: short‑term neutral/bearish, HTF still constructive but capped by 110–112k supply.
- Most relevant setup: fade 109.8–110.2 or take defensive longs at 105k/103k only on ≥2H reversal signals.
- One key macro factor: FOMC/CPI week with soft ETF flows leaves rallies vulnerable without volume.
Stay disciplined: respect invalidations and wait for confirmation before leaning into a direction.
__________________________________________________________________________________

FOMC ahead: tactical plan between 106k and 113.5k__________________________________________________________________________________
Market Overview
__________________________________________________________________________________
BTC rebounded from the 106k area after a liquidation flush and is pushing into a dense HTF supply (111,800–113,500). Momentum is improving intraday but capped below 113.5k within a mildly risk-off backdrop into the FOMC.
Momentum: 📈 Slightly bullish intraday, but broadly range-bound while 113.5k caps.
Key levels:
- Resistances (4H/1D): 111,800–112,300; 113,500; 118,000–120,000.
- Supports (2H/1D): 110,200–110,600; 109,400–109,800; 106,000–106,800.
Volumes: Moderate on the bounce; extreme prints belong to the prior selloff (HTF).
Multi-timeframe signals: 1D/12H/6H/4H/2H = neutral sell ; 1H/30m/15m = neutral buy . LTFs push into 111.9–112.3k, but HTFs remain constrained below 113.5k with non-expansive volume.
Risk On / Risk Off Indicator: NEUTRAL SELL — it contradicts the intraday uptick and favors patience below 113.5k.
__________________________________________________________________________________
Trading Playbook
__________________________________________________________________________________
The dominant setup is a post-flush range below 113.5k: stay tactical, buy only on confirmations, and sell disciplined rejections.
Global bias: Neutral-bearish while ≤113.5k; key invalidation: clean acceptance above 113.5k (HTF).
Opportunities:
- Breakout buy: 4H/12H close-and-hold >113.5k → target 118k then 120k.
- Tactical fade: Sell a clean rejection at 111.8–113.5k → target 110.6k then 109.4k, stop just above 113.9–114k.
- Breakdown sell: Lose 109.4k on volume → target 108.6k then 106k.
Risk zones / invalidations: Confirmed reclaim >113.5k invalidates defensive shorts; loss of 109.4k invalidates rebound longs.
Macro catalysts (Twitter, Perplexity, news):
- FOMC underway: binary volatility; wait for clear validations.
- US spot BTC ETFs: 3-day outflows, negative 7d average → risk-off tilt.
- “Gold fatigue” with mixed risk appetite: rotation narratives possible but unconfirmed.
Action plan:
- Entry: 112.3–113.6k after break/hold (successful retest).
- Stop: 110.8k (below structure).
- TP1/TP2/TP3: 118k / 120k / 124.6–126k.
- Approx R/R: about 1:1.8 to 1:3 depending on retest quality and traction to 120k.
__________________________________________________________________________________
Multi-Timeframe Insights
__________________________________________________________________________________
Overall, HTFs remain capped below 113.5k while LTFs grind into 111.9–112.3k, sustaining a range regime.
1D/12H/6H/4H/2H: Sequence of lower highs below 113.5k; 111.8–112.3k is the gate to convert, with 109.4k then 106k as downside checkpoints if it fails.
1H/30m/15m: Recovery channel into 111.9–112.3k with waning momentum; bullish trigger = acceptance at 112.3k then 113.5k.
Major confluences/divergences: LTF up vs MTF down = chop; moderate bounce volume → need a firm 113.5k reclaim to align TFs higher.
__________________________________________________________________________________
Macro & On-Chain Drivers
__________________________________________________________________________________
The macro tone is cautious (slight risk-off) into the FOMC, with softer ETF flows and a reset on-chain — a mix that calls for technical confirmations.
Macro events: FOMC in progress (potential volatility); yields biased higher; “gold fatigue” headlines; softer China data and EU sanctions chatter on the radar.
Bitcoin analysis: US spot ETF outflows (3-day streak; negative 7d) → headwind for HTF recovery; liquidity is improving but headline-driven; a reclaim above 113.5k would be the needed show of strength.
On-chain data: Historic deleveraging (~$19B), negative funding, ongoing LTH distribution, demand yet to return → reset consistent with a post-flush range.
Expected impact: Neutral-bearish while under 113.5k; a close/acceptance above 113.5k could quickly pivot structure toward 118–120k.
__________________________________________________________________________________
Key Takeaways
__________________________________________________________________________________
Post-liquidation range under HTF resistance, wrapped in a slight risk-off backdrop.
- Trend: neutral to bearish while 113.5k caps; 109.4k and 106k remain the key supports.
- Most relevant setup: breakout buy only on confirmed acceptance >113.5k toward 118–120k; otherwise tactical fades on 111.8–113.5k rejections.
- One key macro: FOMC + ETF outflows reduce odds of a clean breakout without confirmation.
Stay disciplined: let levels decide, size down into FOMC, and demand volume on any breakout.

20/10/25 Weekly OutlookLast weeks high: $115,965.44
Last weeks low: $103,546.52
Midpoint: $109,755.98
Following the flash crash of two weeks ago, Bitcoin opted for the "fill the wick" pattern last week with a steady continuation of the downtrend printing a low for the week 1.5% shy of completely backfilling the entire wick.
Because of the aggressive nature of the immediate recovery, I would estimate that a large number of stop losses would be placed just under the bottom of the flash crash wick and so as price approached that level, buyers stepped in to move price away from that danger area. I am still not convinced that $98,000-102,000 area is safe from a revisit, but when is a question I do not have an answer for.
This week we've seen an early move by the bulls to flip a very important $108,000 level. I could see BTC conforming to the weeks range quite strongly as both extremities of the range as well as midpoint line up very well with HTF S/R levels. I think any PA between those levels would give clues as to the strength of both sides, bulls and bears but the important moves will happen around the extremes. Of course the trade war news is a factor still in play as well as CPI later in the week.
This CPI release is also taking place during a government shut down, it's the first CPI on a Friday since 2018 and FOMC (rate cut predicted) takes place just 5 days after with massively reduced data releases due to the Government shut down. This to me is a volatility storm waiting to happen and many participants are going into it blind.
Good luck this week everybody!

Gold's Historic Rally: Why It HappenedGold approaches $4,500 per ounce for the first time in history. Up more than 50% in less than a year. Everyone's asking the same question: Is this a historic breakout, or the setup for a massive crash?
The answer requires looking at three things: what brought us here, where we are technically, and what could go wrong.
PART 1: THE MACRO STORY
Gold doesn't just rally because people are "scared." It rallies because of structural shifts in how the world's largest institutions view money, risk, and trust.
Central Banks Are Buying Gold at Record Pace
Here's a number that should get your attention: Central banks bought 1,045 tons of gold in 2024. That's the second-highest annual total on record.
In 2025, the buying hasn't slowed down. Poland alone has accumulated 67 tons year-to-date. Turkey, India, Kazakhstan, and others are following suit.
But here's what's really happening: This isn't about inflation hedging. If it were, Western central banks (US, Europe) would be buying too. They're not. Instead, emerging market central banks are diversifying away from the dollar.
Why? Because they watched what happened in 2022 when the US froze Russian reserves. When you hold dollar-denominated assets, they can be weaponized. Gold can't be sanctioned. Gold can't be frozen.
Central banks don't panic sell on a 5% dip. When they buy, they hold. This creates a structural price floor. Every pullback gets accumulated.
What this means: Central bank buying is the foundation of this rally, not a temporary catalyst.
The Federal Reserve is Cutting Interest Rates
According to the CME FedWatch Tool, there is a level of certainty that the Fed would cut rates in October 2025, with markets pricing in another cut in December this year.
When interest rates fall, something important happens to gold: its "opportunity cost" decreases.
Here's the simple version: Gold pays no interest. So when bonds also pay almost nothing (after inflation), holding gold looks pretty reasonable. But when real yields are high, bonds look better and gold looks worse.
Right now, the market is pricing in lower real yields ahead. That's bullish for gold. If the Fed doesn't cut as much as the market expects, that changes everything.
What this means: Rate cuts fuel the rally.
Geopolitical Instability & Currency Debasement
Global tensions remain elevated: Middle East instability, US-China friction, and the ongoing Russia-Ukraine conflict. But that's not the real driver here.
The real driver is the loss of faith in government money.
Gold is at an all-time high, not just in US dollars. It's also hitting all-time highs in euros, yen, and yuan. This isn't a dollar story. This is a global reassessment of what "money" actually means.
Meanwhile, the US national debt is over $35 trillion. Debt-to-GDP is at World War II levels. Other countries (Japan, Europe) are in similar situations, printing money and running massive deficits.
When governments print excessively, investors need a hedge. Gold can't be printed.
What this means: As long as deficits remain high and geopolitical chaos persists, gold has structural demand that goes beyond cycles.
The Bottom Line
Three powerful forces are all pushing in the same direction:
Central banks structurally accumulating gold (de-dollarization)
The Fed cutting rates (lower real yields = gold support)
Global monetary instability (currency debasement = safe-haven bid)
This combination hasn't existed in most traders' lifetimes. That's why this rally feels different. And why it's lasted this long.

BTC: 120.6k under pressure — Reclaim 121.5k or 120k next?__________________________________________________________________________________
Market Overview
__________________________________________________________________________________
BTC is cooling below 124.5k–126.2k after the ATH, ranging inside 120.6k–124.5k. The HTF structure remains bullish while intraday dips toward a key execution pivot.
Momentum: 📉 Intraday corrective move within an HTF uptrend, probing the 120.6k pivot that will decide the next leg.
Key levels:
- Resistances (4H–W): 121.5k (4H/1H pivot), 124.5k–126.2k (W/ATH).
- Supports (1H–D): 120.6k (240 pivot), 120.0k (intraday psych), 117.0k (D pivot/high turned support).
Volumes: HTF normal; 4H–1H moderate; 30m–15m very high (execution catalysts).
Multi-timeframe signals: 1D/12H/6H in Up; 4H→1H correcting into 120.6k; 15m shows a tactical BUY, only valid if the pivot holds.
Risk On / Risk Off Indicator: Overall NEUTRE ACHAT — daily constructive, intraday neutral/contrarian — aligns with the HTF uptrend but requires reclaim above 121.5k to confirm.
__________________________________________________________________________________
Trading Playbook
__________________________________________________________________________________
Dominant trend is up but in a pullback: favor buys on reclaim above pivots; treat shorts as tactical with tight risk.
Global bias: NEUTRE ACHAT while holding/reclaiming 120.6k; major invalidation on a D close < 117k.
Opportunities:
- Buy the reclaim > 121.5k and hold, targeting 122.7k then 124.5k.
- Confirmed breakout above 124.5k (retest holds) toward 126.2k and beyond.
- Tactical sell on break/retest-fail of 120.6k or clean rejection at 124.5k–126.2k.
Risk zones / invalidations:
- Confirmed loss of 120.6k opens 120k then 117k (invalidates intraday longs).
- Break and hold > 126.2k invalidates tactical shorts.
Macro catalysts (Twitter, Perplexity, news):
- Record T-bill issuance (“Treasury Twist”) → potential liquidity headwind.
- Strengthening USD (DXY) → near-term cap on BTC topside.
- Bitcoin ETFs: sustained inflow streak (8 straight days) → tailwind for clean breakouts.
Action plan:
- Long (reclaim pivot): Entry 120.8k–121.2k after close > 121.5k / Stop < 120.6k / TP1 122.7k, TP2 124.5k, TP3 126.2k / R:R ~1.8–2.5.
- Short (counter-bias): Entry on close < 120.6k + failed retest / Stop > 121.5k / TP1 120.0k, TP2 118.8k, TP3 117.0k / R:R ~1.6–2.2.
__________________________________________________________________________________
Multi-Timeframe Insights
__________________________________________________________________________________
Overall higher timeframes remain constructive, while lower timeframes correct into a high-volume pivot.
1D/12H/6H: Uptrend above 117k; consolidation beneath 124.5k–126.2k. A clean daily close above 124.5k unlocks a run at the ATH.
4H/2H/1H: Corrective drift into 120.6k with moderate volumes; reclaiming 121.5k would be the first tell for a push to 122.7k then 124.5k.
30m/15m: Very high volumes at 120.6k; micro BUY (15m) only actionable if the pivot holds and 121.2k/121.5k are reclaimed on rising volume.
Divergences/confluences: Bullish confluence if 120.6k holds + daily Risk On / Risk Off Indicator stays supportive; bearish if strong sell volume appears below 120.6k without responsive bids.
__________________________________________________________________________________
Macro & On-Chain Drivers
__________________________________________________________________________________
Macro remains broadly risk-on, yet USD strength and liquidity headwinds could cap upside until technical reclaims materialize.
Macro events: Dovish-leaning FOMC minutes (cut bias), data delays (shutdown) → lower visibility; record T-bill issuance and a stronger USD → near-term headwinds.
Bitcoin analysis: Post-ATH consolidation 120k–124k; 117k holds as HTF support; BTC dominance elevated — consistent with “debasement” hedges.
On-chain data: Sustained spot ETF inflows (8-day streak); high share of supply in profit with contained realized profits; rising IV, neutral skew, call-tilt — constructive but more sensitive to shocks.
Expected impact: Institutional flows support the NEUTRE ACHAT bias if 120.6k holds and 121.5k is reclaimed; otherwise, USD + “Treasury Twist” favor a probe of 120k/117k on technical weakness.
__________________________________________________________________________________
Key Takeaways
__________________________________________________________________________________
Structurally bullish market, testing the 120.6k pivot with amplified intraday volume.
- Trend: bullish HTF; corrective intraday until 121.5k is reclaimed.
- Top setup: buy the reclaim above 121.5k toward 122.7k/124.5k; plan B is a tactical short below 120.6k toward 120k/117k.
- Macro: ETF inflows are a tailwind, while USD strength and the “Treasury Twist” temper upside without clean confirmations.
Be patient and let 120.6k/121.5k decide the next leg. 🔍

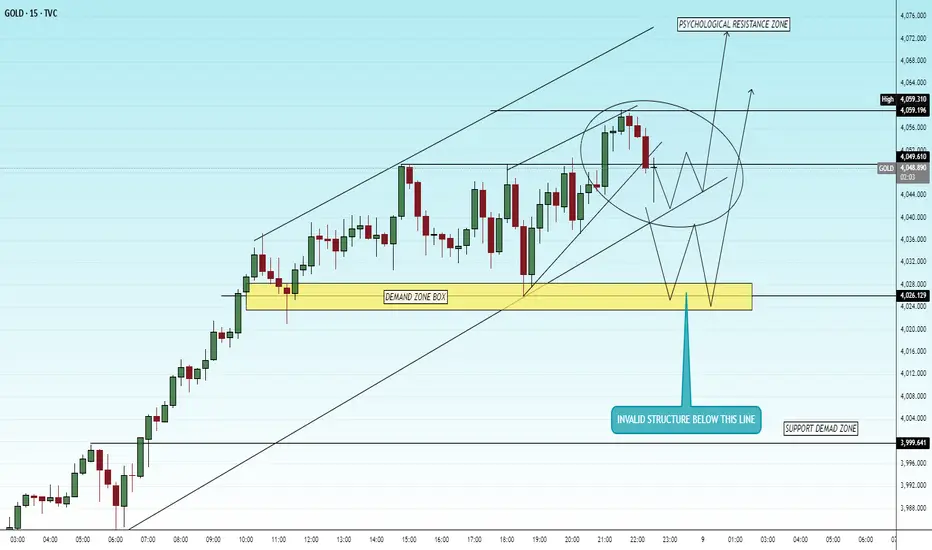
XAUUSD 15m – FOMC Setup AheadTVC:GOLD
Structure | Trend | Key Reaction Zones
Price still maintaining a descending channel structure.
Sitting near psychological and demand support zone (4030–4025).
FOMC volatility expected — final structure below 4025 could trigger continuation down, else a short-term bullish correction may occur.
Market Overview
Gold has been under intense selling pressure before the FOMC event, forming multiple lower highs within a bearish channel. The zone around 4030–4025 remains a key area where liquidity may sweep before a potential retracement toward upper levels if the market rejects strongly from this zone.
Key Scenarios
✅ Bullish Case 🚀 → Bounce from 4030–4025 → 🎯 Target 4068 → 🎯 Target 4085 → 🎯 Target 4100
❌ Bearish Case 📉 → Break below 4020 → 🎯 Target 4005 → 🎯 Target 3980
Current Levels to Watch
Resistance 🔴: 4068 / 4085
Support 🟢: 4030 / 4020
⚠️ Disclaimer: This analysis is for educational purposes only. Not financial advice.
EURUSD LONGI have maintained a buy position for quite a while, based on last week's performance, the bullish momentum is slowing down. Going forward the bulls will depend on a new catalyst. The fed officials have maintained a divergent rate cut rhetoric while at the same the US government is experiencing a shutdown. These has made traders to remain cautious. This week we have quite a number of events lined up, including FOMC and NFP. Any negative news towards the dollar while at the same time ECB's Christine Largade maintaining a stability will mean a retest for the pair towards the years high around 1.19200. Better news for the dollar will mean on lower time frames reversal and higher time frames deeper retracements.

EURUSD BULLSA lot of traders are anticipating sell direction, most have already sold at around 1.17700 zone. For me I still hold a bullish bias due to:
1. Although technical analysis leaves room to catch sells the pair still maintains an uptrend. Therefore, based on recent events claiming a US government shut down, conflicting views on rate cuts from Fed officials and NFP Lining up on Friday creating a risk on mood, I find it wise to sell towards NfP. Any lower than expected will confirm the bulls further and focus can shift to 1.192000 and later 1.20000. But higher than expected will mean that the Fed will keep interest rates steady and a reversal will be confirmed.

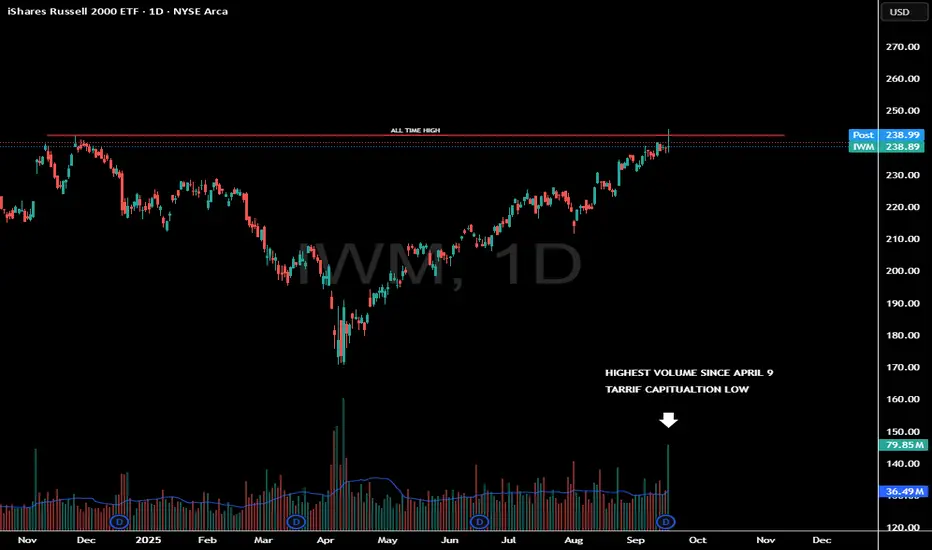
Highest Volume Candle Since Tarriff LowIWM saw a nasty reversal off the all time highs today.
A potential weekly topping tail is building.
What important about this reaction is the amount of volume that was traded.
This was the highest candle since April 9th.
High Volume reversals need to be monitored closely as it does show large money distributed into this strength.
A high volume candle marked the tariff bottom.
Will a high volume candle signal a near term top?