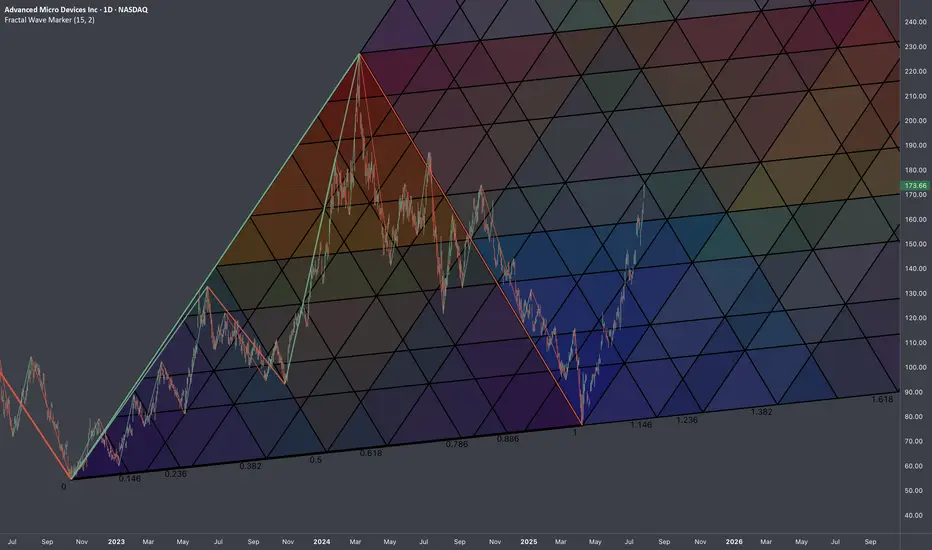
$AMD: Fractal Geometry (Cycle 2022-2025)🏛️ Research Notes
3 Coordinates used for base L-H-L
Fragmented with color spectrum fibs:
Extending structure with same scaling laws:
The chart intended to show objective structure covering unfolding progressions within cycles.
Fractal
$BTCUSD: Entanglement (Multi-Scale)🏛️ Research Notes
Continuation of the research on role of historically inherited angles and structure memory
Original Structure
BG Surgery
Resonation

$META: Narrative Extended🏛️ Research Notes
Exploring non-linear dynamics
Original Structure After witnessing the outcome I was intrigued to see how extended narrative would look like.
Logical Continuation

possible shorts on GJ The G-Spot, also known as the OB, is definitely in play here! We've already seen how the previous price levels reacted from a significant 4-hour area of interest. Now, things are getting exciting with a promising EQH just below our potential short area. Let’s keep an eye on this and see if the price makes its way into that zone.

BTC/USD History Repeating Itself?Full disclosure, I'm not a huge fan of fractals, especially those resulting from black swan events over 4 years ago.
That being said, the BTC/USD weekly chart is starting to look worryingly similar to the 2021 top, as I'm sure many other analysts have also spotted.
The strong bearish RSI divergence is also cause for concern, as BTC heads down to retest its long-standing support level (white line).
Do I personally think history will repeat/rhyme this time? Mmm, I don't think so. Yes, we should anticipate further downside in the short-term. It is Summer after all. But with potential rate cuts due in September, war peace talks underway, and plenty of headroom left above in this cycle (according to the current MVRV score and Pi Cycle indicator), we could potentially see renewed optimism return end of September (NFA).
For the immediate term, a lot hangs in the balance of the upcoming Jackson Hole conference.

BTC_TRADING IDEA 08/01/25So we had a nice retracement. I’m now patiently waiting in a discount zone, aiming for a MTF LQ.
I have plenty of reasons to wait here:
– FVG
– OB
– OTE
If it doesn’t play out, I’ll look for another PD Array.
Let’s see!

GOLD IDEA FOR AUGUST 2025After spending a long time inside a compression area, I think it’s possible to take a long position targeting HTF liquidity, but only if price bounces from this low area.

Alts idea. Still on track. One last drop to range low. Then PumpStill believe in this scenario since March. Alts will drops to range low. Then up
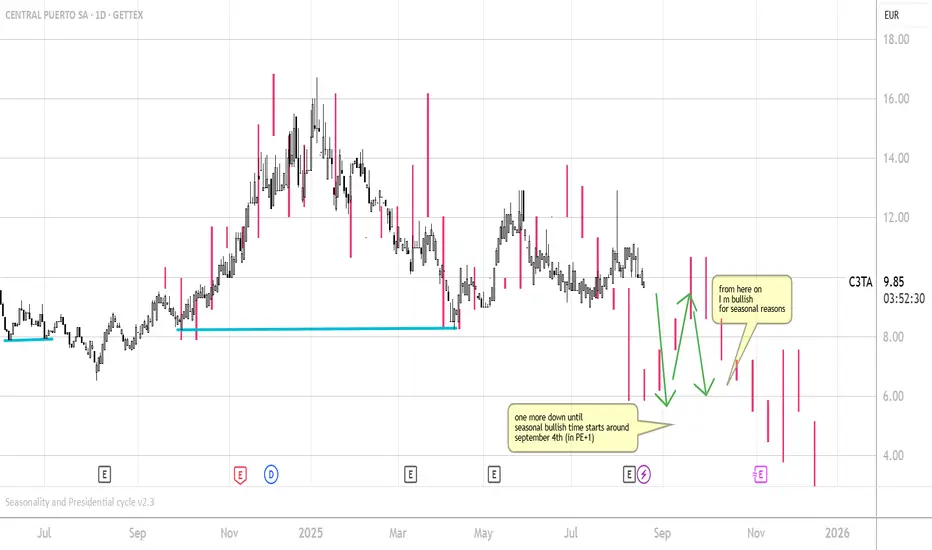
CEPU - CEENTRAL PUERTO - ForecastSee Describtion in the Chart.
From a fractals perspective I see one more down at least.
From a Seasonality standpoint and perspective
I am looking to get into a longerterm trade.
Bullish from Mid of October at latest.
Support my idea when you like it and find it valid.
Correct me in the comments or chat with me.
Cheers!
Gold OutlookMy personal outlook on gold, I expect a push to the upside before Gold decline back into the range

XAU/USD 19 August 2025 Intraday AnalysisH4 Analysis:
-> Swing: Bullish.
-> Internal: Bullish.
You will note that price has targeted weak internal high on three separate occasions which has now formed a triple top, this is a bearish reversal pattern and proving this zone is a strong supply level. This is in-line with HTF bearish pullback phase.
Remainder of analysis and bias remains the same as analysis dated 23 April 2025.
Price has now printed a bearish CHoCH according to my analysis yesterday.
Price is now trading within an established internal range.
Intraday Expectation:
Price to trade down to either discount of internal 50% EQ, or H4 demand zone before targeting weak internal high priced at 3,500.200.
Note:
The Federal Reserve’s sustained dovish stance, coupled with ongoing geopolitical uncertainties, is likely to prolong heightened volatility in the gold market. Given this elevated risk environment, traders should exercise caution and recalibrate risk management strategies to navigate potential price fluctuations effectively.
Additionally, gold pricing remains sensitive to broader macroeconomic developments, including policy decisions under President Trump. Shifts in geopolitical strategy and economic directives could further amplify uncertainty, contributing to market repricing dynamics.
H4 Chart:
M15 Analysis:
-> Swing: Bullish.
-> Internal: Bullish.
H4 Timeframe - Price has failed to target weak internal high, therefore, it would not be unrealistic if price printed a bearish iBOS.
The remainder of my analysis shall remain the same as analysis dated 13 June 2025, apart from target price.
As per my analysis dated 22 May 2025 whereby I mentioned price can be seen to be reacting at discount of 50% EQ on H4 timeframe, therefore, it is a viable alternative that price could potentially print a bullish iBOS on M15 timeframe despite internal structure being bearish.
Price has printed a bullish iBOS followed by a bearish CHoCH, which indicates, but does not confirm, bearish pullback phase initiation. I will however continue to monitor, with respect to depth of pullback.
Intraday Expectation:
Price to continue bearish, react at either M15 supply zone, or discount of 50% internal EQ before targeting weak internal high priced at 3,451.375.
Note:
Gold remains highly volatile amid the Federal Reserve's continued dovish stance, persistent and escalating geopolitical uncertainties. Traders should implement robust risk management strategies and remain vigilant, as price swings may become more pronounced in this elevated volatility environment.
Additionally, President Trump’s recent tariff announcements are expected to further amplify market turbulence, potentially triggering sharp price fluctuations and whipsaws.
M15 Chart:

▒₿▒ BITCOIN FORECAST | 6HR ▒₿▒COINBASE:BTCUSD
[ [ ]]
In my last analysis on July 25th, I laid out a bullish forecast targeting the $150K level, based on a fractal pattern that had been tracking well. However, the market has reached a critical divergent point. The recent price action, particularly the confirmation of major weekly bearish signals, requires us to reassess and adapt. As of today, the bullish case has been invalidated, and the inverse bearish fractal is now the primary scenario.
What Changed? The Confluence of Bearish Signals
Several major warning signs have now been confirmed, forcing this change in outlook:
The Double Shooting Stars: As noted on August 14th, two powerful Shooting Star candles appeared on the weekly chart. This was the first major indicator of a potential top. We needed a strong weekly close to invalidate this pattern, and we got the opposite.
Break of Major Trend Support: The price has now broken a major ascending trendline on the daily chart, a clear signal that sellers have taken control of the short-to-medium term trend.
The Fractal Inversion: The price action began to diverge from our bullish fractal and started to perfectly mirror an inverted, bearish version of the same pattern.
The New Forecast: Following the Bearish Fractal
The image above shows the original bullish fractal (in teal) and the now-active inverted fractal (in pink). The breakdown of the daily trendline was the trigger, and this fractal now provides a potential roadmap for the correction that is underway.
This isn't just a pattern; it's a visual representation of the path of least resistance, which is now clearly to the downside.
Key Levels to Watch
This fractal path aligns perfectly with the key technical levels we must now watch. These are the battlegrounds that will define this correction:
Established Resistance: ~$124,000. This is now the confirmed peak. The bears are in full control as long as we remain below this level.
Initial Warning Sign (Triggered): A close below $111,000. We have already breached this level, confirming the initial phase of the downtrend. The likelihood of this being a simple correction, rather than the start of a bear market, drops significantly with every day we spend below it.
Full Bear Market Confirmation: A decisive weekly close below $104,000. This remains the most critical level. According to the analysis, if we break below the $104k-$100k zone, there is an
80% likelihood that we are in a Bear Market and that the ~$124k high was the final top for this bull run.
Conclusion
The bullish forecast has been invalidated by a confluence of powerful, high-timeframe bearish signals. The market is now following a bearish inverted fractal, which aligns with our key technical levels.
The primary expectation is that this correction will continue, with the $104,000 support zone being the next logical destination. Stay safe and manage your risk accordingly.
This is not financial advice (NFA). This is for educational purposes only. Always do your own research (DYOR).
DISCLAIMER
I AM NOT A FINACIAL ADVISOR, NOR AM I YOURS. THIS IS NOT FINANCIAL ADVICE. MEARLY DOODLINGS ON A MATHMATICALLY DRIVEN GRAPHICAL INTERFACE, TRACKING AN INVISIBLE 256BIT MILITARY-GRADE ENCRYPTED ASSET. . . FOR ENTERTAINMENT/AMUSEMENT PUROSES ONLY. ENJOY!

DXY AnalysisI am Bullish on DXY
Daily $ identified
SSL swept 98.128
Bearish if 96.377 BOS
DXY Bullish, XXXUSD/Indices Bearish

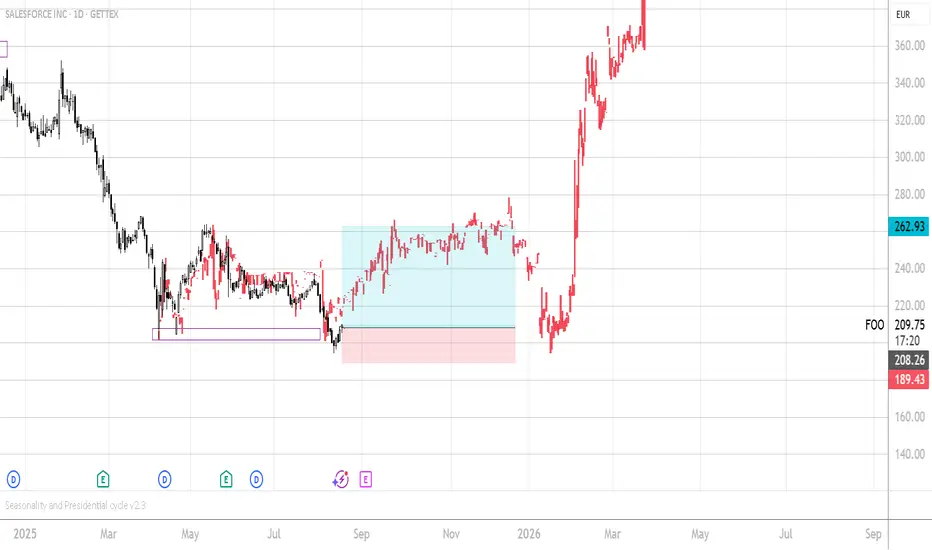
SALESFORCE - CRM - Fractal found and applied to the chart - LONGThis is not a trade call. I am new to fractals trading. ;-)
In addition to what I see a strong bullish move from a seasonal perspective.
Trade is active with a 7% stopploss which is historically the max drawdown for a CRM trade starting from today until early October.
Cheers and good luck!
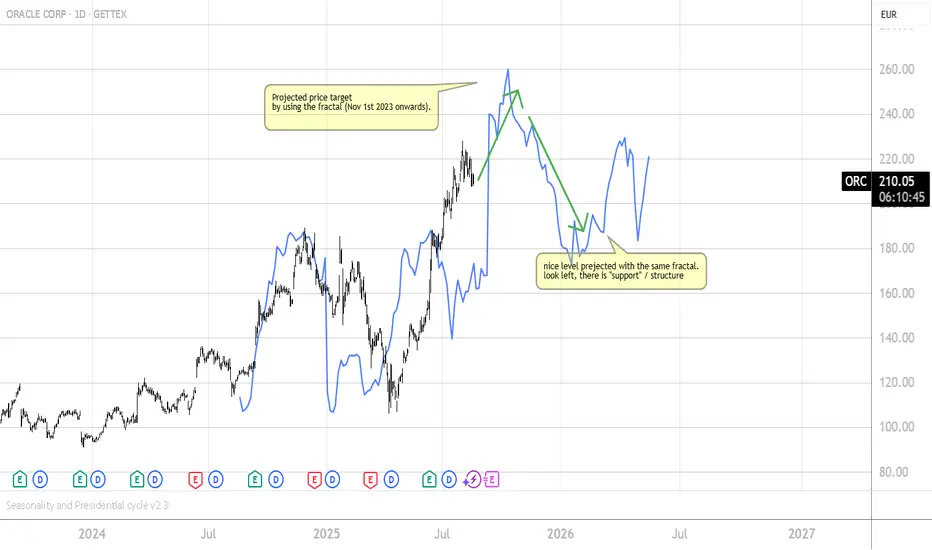
ORACLE ORCL Fractal ProjectionI applied fractal analysis and this worked out nicely on the chart.
the projection suggests, that there might be a last upmove to the level mentioned in the chart. afterwards a correction to the stracture level noticeable to the left side.
what did I do right? what did I do wrong? I am new to using fractals on the chart while knowing for a long time that -everything- is growing, decaying, going, moving,.... in factals.
leave a like or comment or say hello in the privat chat!
XAU/USD 18 August 2025 Intraday AnalysisH4 Analysis:
-> Swing: Bullish.
-> Internal: Bullish.
You will note that price has targeted weak internal high on three separate occasions which has now formed a triple top, this is a bearish reversal pattern and proving this zone is a strong supply level. This is in-line with HTF bearish pullback phase.
Remainder of analysis and bias remains the same as analysis dated 23 April 2025.
Price has now printed a bearish CHoCH according to my analysis yesterday.
Price is now trading within an established internal range.
Intraday Expectation:
Price to trade down to either discount of internal 50% EQ, or H4 demand zone before targeting weak internal high priced at 3,500.200.
Note:
The Federal Reserve’s sustained dovish stance, coupled with ongoing geopolitical uncertainties, is likely to prolong heightened volatility in the gold market. Given this elevated risk environment, traders should exercise caution and recalibrate risk management strategies to navigate potential price fluctuations effectively.
Additionally, gold pricing remains sensitive to broader macroeconomic developments, including policy decisions under President Trump. Shifts in geopolitical strategy and economic directives could further amplify uncertainty, contributing to market repricing dynamics.
H4 Chart:
M15 Analysis:
-> Swing: Bullish.
-> Internal: Bullish.
H4 Timeframe - Price has failed to target weak internal high, therefore, it would not be unrealistic if price printed a bearish iBOS.
The remainder of my analysis shall remain the same as analysis dated 13 June 2025, apart from target price.
As per my analysis dated 22 May 2025 whereby I mentioned price can be seen to be reacting at discount of 50% EQ on H4 timeframe, therefore, it is a viable alternative that price could potentially print a bullish iBOS on M15 timeframe despite internal structure being bearish.
Price has printed a bullish iBOS followed by a bearish CHoCH, which indicates, but does not confirm, bearish pullback phase initiation. I will however continue to monitor, with respect to depth of pullback.
Intraday Expectation:
Price to continue bearish, react at either M15 supply zone, or discount of 50% internal EQ before targeting weak internal high priced at 3,451.375.
Note:
Gold remains highly volatile amid the Federal Reserve's continued dovish stance, persistent and escalating geopolitical uncertainties. Traders should implement robust risk management strategies and remain vigilant, as price swings may become more pronounced in this elevated volatility environment.
Additionally, President Trump’s recent tariff announcements are expected to further amplify market turbulence, potentially triggering sharp price fluctuations and whipsaws.
M15 Chart:

GOLD TARGETS BUY STOPSgold targets buy stops from a reclaimed breaker block. An imbalance fill is a very strong point of interest , the breaker block aligns with an imbalance, this combination has proven to be lethal so many times, watch out for it

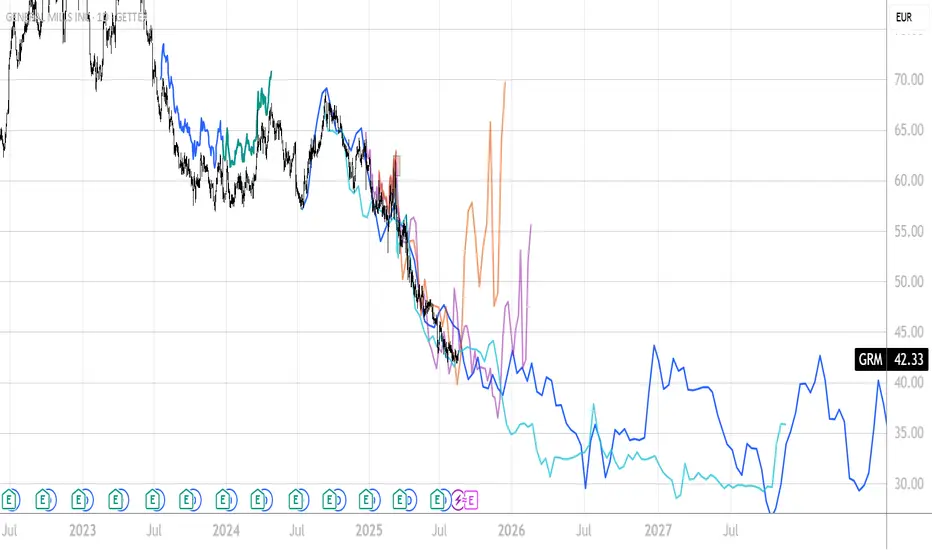
GENERAL MILLS - GIS - MY PROBLEM WITH FRACTALS - EDUCATIONAL... The Markets are definitly fractal.
But at the moment I can't decide...
Maybe someone can help me out?
All in all GIS dropped a huge lot and might present a good entry price for a medium to long term investor / trader...
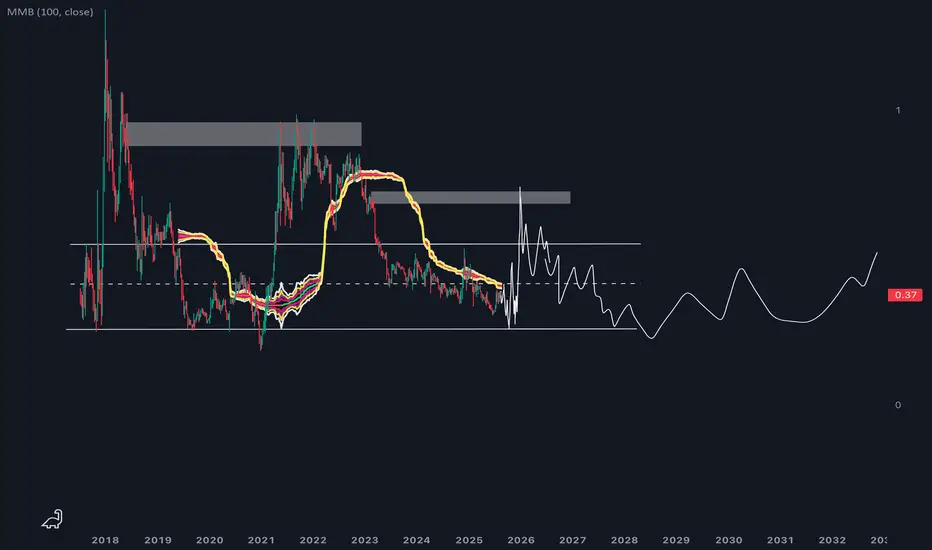
SP500 ETF: Fibonacci MappingAs you may know, Williams Fractals indicator identifies potential reversal points by marking a high (or low) surrounded by two lower highs (or higher lows) on each side, forming a five-bar pattern that signals possible turning points in price. Unfortunately, the simplicity of such indicator provides just tiny perspective, undermining broad implication of the concept.
Before I begin diving into processing geometric narrative of emerging price via fibonacci channels, I want to explain how I interpret fractals.
When I use the term "fractal", I'm not just talking about the points alone. Market continuously corrects itself, so analyzing it by price alone can bring more confusion than help. The object of observation shouldn't be limited to quantifying just by a single property. Chaos by default requires awareness from both price and time aspects. The easiest way to root it in my vision was through realization that price is a function of trading time intervals. Its activity can be described as cyclical progression, as if it is wired by multiple "springs" of different tensions.
Classic TA patterns known to literally anyone are great for anticipating a move in surface level forecasts. Since my line of work focuses on prediction over forecasts, it requires deeper structural awareness behind complex oscillations.
Let's observe the way selloff scales from ATH and how it impacts fractal hierarchy.
The first corrective bullish wave can be explained as a reaction to initial impulsive bearish wave. The bigger scale drop from ATH to a lower point explains why the corrective bullish wave looks the way it is. And so on:
In fractals, scaling laws describe how key properties change with size, typically following power-law relationships that reflect the structure’s self-similarity, where a characteristic scales with the size raised to an exponent.
To build a probabilistic model, we must keep in mind how the smaller bits make up bigger scale picture. ATH, established bottom and angle of progression defined by pullback highs, all those points have structural weight. Since psychology of masses that shapes price dynamics is governed by mathematical sequences found in nature, it's fair to use Fibonacci Channels to map the geometry of interconnectedness.
Similarly, all of those points can be referred by another fibonacci channel with opposite direction.
From my perspective, traditional TA patterns reflect just phases of cycle, this is why I unify those fragments into broader scalable shapes. This distinctive branch of Fractal Analysis allows to track systematic aspects of market behavior and explains how a pattern replicates itself in rhythmic continuity.

More Downside Expected for BitcoinBased on Bitcoin's recent movements, further downside is expected in this cryptocurrency

$XRPUSD: Limits of Expansion🏛️ Research Notes
Documenting interconnections where historic area and coordinates of formations are used to express geometry of ongoing cycle.
If we scale out the chart back starting from roughly 2016, we can see more pretext like how the price was wired before decisive breakout from triangle.
Integrating fib channel to the angle of growth phase of the previous super-cycle, so that frequency of reversals match structural narrative.

XUSDT on the Path to Higher PricesAccording to the chart, a buying opportunity has emerged for a potential XUSDT uptrend. Please make sure to apply proper risk management. As for me—I never do, but hey, I’m not sure about you!

GBPUSD BUY STOP 5 MIN TIMEFRAMEImpulse correction continuation trading. 10 20 EMA on 4hr on uptrend, on 30 min hitting off EMA. Targetting imbalance on 5min chart. Buy stop trade setup. Following mentfx strategy
