Gold structure mapped I usually stay up to date when mapping gold structure to find potential opportunities as it is one of my favorite pairs due to the amount of trades that gives me and then % of profit made with it. I still looking for longs after sweeping some important liquidity to the upside, trying shorts in gold for me it's a bad move unless you have your own BIAS, for me I'm still positive with longs over the week
Fundamental Analysis

Small continuation, all structure mapped out Overall BullishStructure is mapped out, really strong bullish Overall, I'm prioritizing longs when price reach our Fibo LVL, this is a beautiful continuation as price has been sweeping liquidity and fueling shorts moves for slow periods of time. I'm looking for this type of moves before hitting our Fibo and changing BIAS to longs
Mapping gold structure, positive with longs opportunities I usually stay up to date when mapping gold structure to find potential opportunities as it is one of my favorite pairs due to the amount of trades that gives me and then % of profit made with it. I still looking for longs after sweeping some important liquidity to the upside, trying shorts in gold for me it's a bad move unless you have your own BIAS, for me I'm still positive with longs over the week

Asia sessions already swept out, it was a go zone for meLooking for more continuation trades to the downside after taking the Asia session, the bearish pressure looks great here we aiming for a little TP at the Fibo level
Price create a couple of Market structure shift for me it's more about what price wants to do next

GOLD (XAU-GC) BUY PLAN📊 Market Sentiment
Market sentiment for GOLD remains strongly bullish. One of the key drivers is the aggressive accumulation by global central banks. Recession concerns and persistent inflation fears continue to position gold as one of the most attractive safe-haven assets.
📈 Technical Analysis
Price has completed the expected accumulation phase and broke out strongly from the accumulation range. This former range has now turned into a clear demand zone. Price has pulled back into this zone again and is currently testing the $4060 level.
📌 Game Plan
The $4060–$3900 zone is my primary buy zone. I will continue accumulating within this range.
My first target is $4250, followed by $4400, which aligns with new all-time-high expectations.
If price closes below $3900 on the daily, this idea becomes invalid. Therefore, my stop is a daily close under $3900.
💬 If this breakdown aligns with your outlook, like and comment below.
For deeper sentiment and strategy insights, subscribe to my Substack free access available.
⚠️ This analysis is for educational purposes only and does not constitute financial advice. Always conduct your own research before trading or investing.

UNIUSDT Better Long Setups Coming...Patience PaysI'm seeing a lot of bullish setups and decided to give me two cents.
Current UNI/USDT price action is raising a red flag for potential long entries. History shows this specific Rate of Change (ROC) zone has often marked a local top.
Historic ROC Overbought: Every time the price has pushed into this ROC zone in the past, it quickly resulted in a break of the bullish market structure. Followed by a corrective move down toward the support/accumulation zone. We are seeing that pattern play as of right now.
Balance Volume (OBV) indicator trendline has been broken. This confirms that buying volume is no longer supporting the price momentum.
This is not a good spot for a buy signal.
I personally would wait for the test of the support zone then look for buy. Then we can aim for our potential targets.
Good Luck!

JAPAN JUST KILLED THE GLOBAL MONEY PRINTER AND NOBODY NOTICEDJapan’s yield hit 1.71%. They’re pumping $110 billion stimulus into their economy while debt sits at 263% of GDP. The math just became impossible. At 1.7% rates, Japan pays $27 billion MORE in interest. Every. Single. Year.
The yen carry trade just reversed. $1.2 trillion in borrowed yen funding crypto, stocks, emerging markets must unwind.
Emerging market currencies collapse without Japanese capital inflows. Europe’s debt crisis returns because Italy and Spain lose their silent buyer.
Taken my first SELL POSITION, with a 25 pip stoploss and looking to take first profits at 1:2 Risk/Reward

HUGE PROFITS EURJPY Eurjpy in huge profits , hitting (TAKE PROFITS) and now will continue to the upside looking to take more trades in future


BTC Crash Warning! BEAR Market is here!BTC’s market structure is deteriorating. Order flow continues to weaken, and buyers are failing to absorb even modest sell-side pressure. The question now is whether the recent rally has reached its exhaustion point—and the evidence suggests it may have.
In a worst-case scenario, the broader market could push Bitcoin below 70k, with deeper downside levels at 50k, 40k, and an extreme capitulation zone near 28k. These levels are not predictions but plausible outcomes based on current momentum and structural breakdown.
The larger narrative is shifting. Cycles are no longer behaving as cleanly as before, and the era of “easy crypto money” appears to be fading. Potential reversal zones exist, but as long as the bearish structure remains intact, they offer limited reliability. Each attempt at a bounce has been met with stronger sell pressure, indicating absorption by larger players.
On the other hand, the 94–85k region stands out as an area where we could see a relief rally. However, expecting it to produce a new all-time high is optimistic under current conditions.
For now, I remain strategically bearish, not emotionally bearish. My first downside target is 92–90k, with the remaining levels outlined above depending on how the market reacts at each structural break.
For now BULL Market is OVER!
#Bitcoin #BTC #BTCUSD #Crypto #CryptoMarket
#BitcoinAnalysis #BTCAnalysis #CryptoAnalysis
#BearMarket #CryptoBearMarket #BTCBearish
#BitcoinCrash #BTCDowntrend #MarketBreakdown
#OrderFlow #PriceAction #MarketStructure
#CryptoTrading #TradingView #TechnicalAnalysis
#ReliefRally #LiquidityHunt #TrendReversal
#RiskManagement #SmartMoney

Market Insights with Gary Thomson: 17 - 21 NovemberMarket Insights with Gary Thomson: Fed Rate Cut Chances, UK Markets, NVIDIA Earnings
In this video, we’ll explore the key economic events and market trends, shaping the financial landscape. Get ready for insights into financial markets to help you navigate the week ahead. Let’s dive in!
In this episode of Market Insights, Gary Thomson unpacks the strategic implications of the week’s most critical events driving global markets.
👉 Key topics covered in this episode:
— FOMC Meeting Minutes
— UK Inflation Rate
— UK Retail Sales
— Corporate Earnings Reports
Gain insights to strengthen your trading knowledge.
Disclaimer: This video represents the opinion of the Companies operating under the FXOpen brand only. It is not to be construed as an offer, solicitation, or recommendation with respect to products and services provided by the Companies operating under the FXOpen brand, nor is it to be considered financial advice.

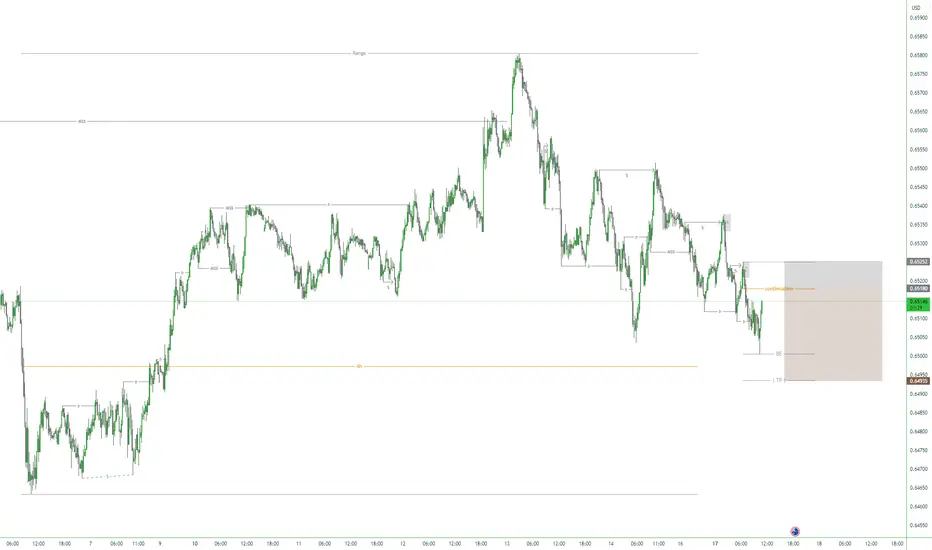
Quyet.P | EURUSD breaking down… Could 200 pips vanish this weekSomething’s cracking under the surface. You can feel the tension without looking at chart.
EURUSD keeps trying to breathe above weak supports near 1.0980–1.0950, but every bounce looks tired.
Sloppy. Forced.
My view? Down. Hard. Could see ~200 pips drop in next 2 weeks.
Price action
: last week candles → long upper wicks, no push from buyers. Lower highs stacking horizontally.
Liquidity pockets
: stops and pending orders around 1.0920–1.0900. If broken → fast move down.
Intermarket
: DXY up ~0.8% this week, S&P500 down ~1.2%, risk-off creeping. EURUSD reacts to dollar strength and equity weakness.
Macro whispers
OANDA:EURUSD : ECB still dovish, but flows favor safe havens.
I’m watching next bearish engulfing on H4. If it prints clean, dominoes fall faster.
Do you see the exhaustion too, or are some traders still pretending this pair is stable?

17/11/25 Weekly OutlookLast weeks high: $107,526.18
Last weeks low: $93,034.53
Midpoint: $100,280.35
Bitcoins downtrend continues as price reaches a 6-month low of $93,000. This price action came as a result of a failed attempt to flip the $107,000-$108,000 level, as this area rejected the bears gained momentum sending BTC sub $100k big even level and the most worrying part of all for the bulls losing the $97,000-$98,000 level. On the Higher timeframes this new lower low sets up for a trend shift. Should any reaction from the bulls fail to flip the weekly high and rollover, I would then have confirmation of a bearish trend and trade accordingly.
Despite the US Government shut down coming to an end, it appears this has not been enough to get the market in a risk-on mood, at least not yet. This compounded with Nvidia earnings in midweek and the larger question mark about the AI industry as a whole has meant buyers are just not will to step in yet. My opinion is that IF Bitcoin trades into the $89,000-$92,000 area that is where support may be found, that's because we have an area of imbalance that broke the previous downtrend in April earlier this year during the tariff war.
This week I expect Wednesday 19th November to be a day of volatility, and some formation of a local bottom in Bitcoin, at least in the short term.
Good luck this week everybody!

Weekly Outlook: XAUUSD, #SP500, #BRENT for 17-21 November 2025XAUUSD: BUY 4085.00, SL 4055.00, TP 4175.00
Gold enters the new week around $4,080 per ounce on Monday, November 17, 2025. The market focus is the release of the Federal Reserve minutes this week and the resumption of delayed U.S. macro data after the government pause ended: this shapes expectations for the future rate path and the dollar’s dynamics. Meanwhile, overall demand for gold is supported by sustained official purchases: according to the World Gold Council, central banks kept net buying elevated in Q3, and October marked a fifth consecutive month of inflows into gold funds. On the supply and alternative-yield side there are no notable new factors; 10-year Treasury yields remain near recent levels, which limits the cost of holding gold but does not negate safe-haven demand.
Fundamentally, the week looks moderately favorable for XAUUSD: the minutes may confirm a course toward gradual easing of conditions in 2026, while uncertainty in data and the geopolitical backdrop preserve interest in defensive assets. Risks for buyers include a tougher reading of the minutes and a stronger dollar; supportive factors include steady official purchases, continuing ETF inflows, and stable retail investment demand. In this environment, buying dips with a nearby loss limit is preferred.
Trade recommendation: BUY 4085.00, SL 4055.00, TP 4175.00
#SP500: BUY 6735, SL 6685, TP 6885
The S&P 500 starts the week near 6,734 at Friday’s close (November 14), while Monday futures trade modestly higher on expectations for key corporate earnings. The main catalyst is results from the leading producer of AI-focused semiconductors, viewed as a gauge of whether the investment cycle in AI and corporate capex continues. On the macro side, the Fed minutes and the return of several delayed indicators will help refine the monetary-policy path after recent rate cuts. Yields on 10-year U.S. Treasuries are holding around 4% with choppy swings, which does not add fresh pressure to equity multiples.
The weekly backdrop supports the benchmark: anticipated corporate drivers (AI investment, retailer reports as a read on consumer demand) and reduced data uncertainty as releases resume. Risks include softer guidance on AI capex, a jump in yields, or more cautious signals from the Fed minutes. The base case is a measured continuation of the uptrend if earnings resilience is confirmed and no negative surprises appear in the data.
Trade recommendation: BUY 6735, SL 6685, TP 6885
#BRENT: BUY 64.00, SL 61.80, TP 70.60
Brent crude on Monday, November 17, 2025, holds near $64 a barrel as the market digests the resumption of loadings at Russia’s Novorossiysk port after a brief halt while reassessing the global supply-demand balance. Recent assessments point to a growing surplus in 2025–2026: agencies note faster output growth alongside moderate demand, while OPEC+ signals readiness to manage supply flexibly against the backdrop of lowered official selling prices for Asia in December. At the same time, geopolitical risks and occasional disruptions periodically restore a risk premium, cushioning the pressure from oversupply.
This week, prices will be driven by news on OPEC+ discipline, stock/export data, regulator commentary, and the dollar’s path after the Fed minutes. The base balance is “moderately neutral” with elevated sensitivity to headlines: absent fresh signals of a larger surplus, the market tends to consolidate with potential for a recovery toward the upper end of the range as short positions are covered and risk appetite improves. Key risks to long positions are faster non-OPEC+ supply growth, softer Asian demand, and a lack of geopolitical premium in the news flow.
Trade recommendation: BUY 64.00, SL 61.80, TP 70.60

BTC corrective map: cluster buys vs 95.7k supply__________________________________________________________________________________
Market Overview
__________________________________________________________________________________
BTC remains in a corrective phase just above 93k after a sequence of lower highs, sitting on stacked demand while overhead supply caps bounces. Momentum is cautious and event-driven; treat key zones like checkpoints in a tough dungeon.
Momentum: Bearish-to-neutral drift with sellers fading bounces under 95.7k; 1D holds uptrend but 12H remains down.
Key levels:
- Resistances (3D/1D/4H): 95,700 (3D), 98,300 (1D), 100,400 (4H pivot zone).
- Supports (1D/12H/2–6H/3D): 93,900 (12H–1D floors), 92,900–93,400 (Cluster A, 2H–6H), 90,950 (3D pivot low).
Volumes: Moderate overall; notable very high spikes on 15m selloffs.
Multi-timeframe signals: 1D Up vs 12H/6H/4H/2H Down; average trend Down. Longs are tactical until 12H flips Up and price reclaims 93,900.
Harvest zones: 93,400 (Cluster A) / 93,915–93,924 (Cluster B) — ideal dip-buy zones for inverse pyramiding when ≥2H reversal confirms.
Risk On / Risk Off Indicator context: Neutral sell — risk-off tilt that tempers long follow-through, aligning with the corrective momentum.
__________________________________________________________________________________
Trading Playbook
__________________________________________________________________________________
With a corrective regime and mixed MTF, stay tactical: favor reactive buying at defined demand with confirmation and fading into first HTF resistance.
Global bias: Neutral sell while below 93,900–95,700; invalidation of bearish bias on strong reclaim and hold above 98,300.
Opportunities:
- Tactical buy: 92,900–93,400 reaction (≥2H reversal) aiming 93,900 → 95,700.
- Breakout buy: Acceptance above 93,900 opens 95,700; continuation through 98,300 targets 100,400.
- Tactical sell: Fade 95,700 or 98,300 rejections back toward 93,900/93,200.
Risk zones / invalidations:
- A sustained close below 92,400 hands control to sellers; a break below 90,950 invalidates the long thesis and exposes lower supports.
Macro catalysts (Twitter, Perplexity, news):
- FOMC Minutes, US jobs, and NVDA earnings could drive acceptance/rejection around 93k clusters.
- ETF outflows act as a headwind to durable breakouts.
- ECB balanced tone, Japan tax/policy shifts constructive medium term but not immediate.
Harvest Plan (Inverse Pyramid):
- Palier 1 (12.5%): 93,400 (Cluster A) + reversal ≥2H → entry
- Palier 2 (+12.5%): 89,700–87,800 (-4/-6% below Palier 1)
- TP: 50% at +12–18% from PMP → recycle cash
- Runner: hold if break & hold first R HTF (95,700)
- Invalidation: < HTF Pivot Low (90,900) or 96h no momentum
- Hedge (1x): Short first R HTF (95,700) on rejection + bearish trend → neutralize below R
__________________________________________________________________________________
Multi-Timeframe Insights
__________________________________________________________________________________
Across timeframes, HTF support is dense near price, but LTFs lean down and supply is heavy overhead.
1D: Still Up structurally; sitting on higher-timeframe demand with 93,900 as the nearby reclaim that improves odds toward 95,700/98,300.
12H/6H/4H/2H: Downtrends intact; bounces sold below 95,700; key support cluster at 92,900–93,400 for potential reversals.
1H/30m/15m: Weak intraday structure with sell spikes; liquidity magnets at 92,900 and 91,100–91,300; need strong wick rejections for tactical longs.
Major confluence: ISPD Cluster A (92,900–93,400) over AGG ≈ price with 3D pivot low at 90,950 below; together they frame asymmetric long attempts if ≥2H confirms.
__________________________________________________________________________________
Macro & On-Chain Drivers
__________________________________________________________________________________
Macro is mixed-to-risk-off: ETF outflows, policy/event risk, and stronger USD tone cap upside until reclaimed levels prove persistence.
Macro events: FOMC Minutes, US labor data, and Flash PMIs set the near-term volatility path; NVDA earnings can sway risk appetite; ECB is balanced but flags correction risk; Japan’s tax/policy headlines constructive medium term.
Bitcoin analysis: Sub-100k/102k regime with 97,500–100,000 as key reclaim to improve structure; below 92,000 opens deeper supports cited by multiple desks.
On-chain data: Not provided; flows narrative leans risk-off via ETFs, dampening sustained rallies.
Expected impact: Event-driven two-way trade; until 97,500–100,000 is reclaimed, respect downside tails and use confirmed reactions at clusters.
__________________________________________________________________________________
Key Takeaways
__________________________________________________________________________________
BTC trades in a corrective environment with dense support beneath and strong supply above.
- Trend is neutral-to-bearish short term while 12H remains Down; 1D resilience allows tactical bounces if 93,900 is reclaimed.
- Best setup: Confirmed ≥2H reversal in 92,900–93,400, scale out at 93,900 → 95,700; fade 95,700/98,300 if rejection.
- Key macro factor: ETF outflows plus FOMC/Jobs/NVDA volatility may decide the next leg.
Stay patient, define risk at 90,900, and harvest volatility only on confirmed signals.

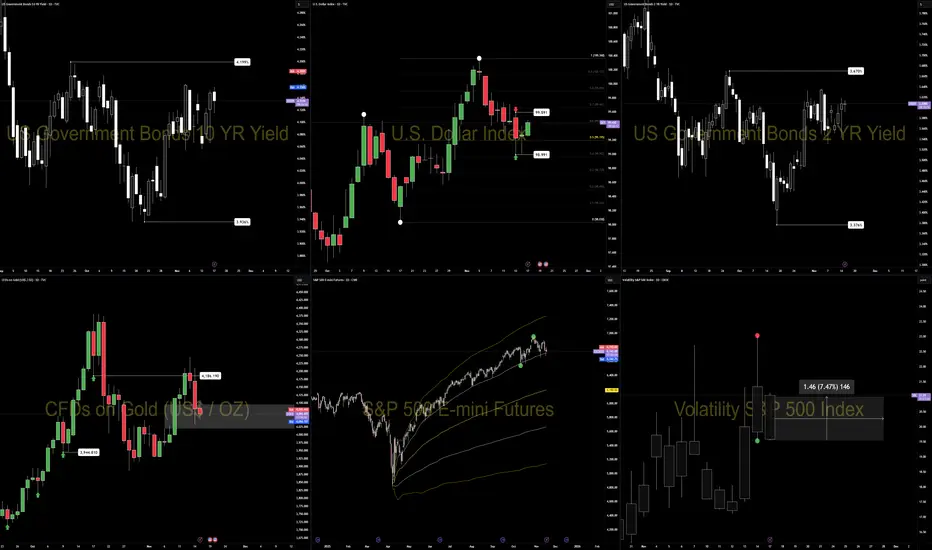
PRE-NY CONDITIONS — 17 November 2025New York inherits a defensive London session: steady Dollar, firm short-end yields, weaker equities, and rising volatility.
1. Market Environment (London → NY Transition)
Dollar:
DXY holds mid-range near 99.40. No shift in macro tone during London.
Yields:
US10Y near 4.15%, US2Y near 3.60%. Both stayed contained inside narrow ranges — policy tone unchanged.
Risk Tone:
ES weakened through London. Volatility elevated. Global tone remains cautious.
Liquidity:
Thinner into NY as VIX climbs and equities soften.
Quick Insight:
Stable 2Y = stable policy tone.
Rising VIX = cautious liquidity.
2. Six-Chart Snapshot (Operator View)
DXY:
Mid-range (98.991–99.981), inside-bar structure. No bias until a break.
US10Y:
Range-bound. Today’s move sits inside a 1.03% range.
US2Y:
Up 0.64% on low volume — quiet policy tone, data-waiting behavior.
ES:
Bearish through London with clear rotation lower into NY.
Gold:
Lower inside daily imbalance. Down 1.46% — weak safety demand.
VIX:
Up 7.47% — rising volatility regime.
3. Cross-Asset Signals
Yields:
Stable long-end + firm short-end → Dollar supported.
Equities:
ES weakness maintains defensive tone.
Gold:
Lower → no significant safety bid.
Volatility:
Higher VIX → cautious liquidity and reactive flows.
Global Risk:
Neutral-to-defensive.
4. Core Drivers for NY
• Dollar reaction inside the inside-bar range
• Short-end yield firmness (2Y)
• ES tone post-NY open
• VIX regime (expanding vs contained)
• Yield alignment (10Y + 2Y)
5. Execution Notes — CORE5 PEM
Follow higher-timeframe direction
Ignore noise from earlier sessions
Wait for structure + flow alignment
Act only on confirmation
One-Line Summary
NY opens into a defensive setup: steady Dollar, firm yields, weak equities, and rising volatility.
— CORE5DAN
Institutional Logic. Modern Technology. Real Freedom.
When Crypto Actually MovesCrypto trades around the clock, but the market doesn’t behave the same way at every hour. Volume, liquidity, and volatility cluster around predictable windows, and those windows shape how setups form and how price reacts. When you understand these shifts, you stop taking trades randomly and start aligning execution with the moments when the market truly moves.
Why Sessions Matter
Even though crypto never sleeps, human traders and institutional desks still operate in cycles. Liquidity providers adjust during business hours. Market makers re-balance at session opens. Macro news is released on a fixed schedule. These patterns create recurring volatility signatures.
Ignoring sessions means you treat every candle as equal. Understanding sessions means you add a layer of context that improves timing, risk control, and win rate.
Asia Session (00:00–06:00 UTC)
The Asia window tends to be slower and more range-bound.
Characteristics include:
– Moderate liquidity
– Clean consolidations
– Accumulation before Europe
– Fewer impulsive moves unless driven by news from Asia-Pacific regions
This period often sets the initial range of the day. Liquidity begins to cluster above highs and below lows, creating the conditions for later sweeps.
Europe Session (07:00–12:00 UTC)
Liquidity expands significantly as London opens. You often see the first engineered move of the day.
Key behaviors:
– Early sweeps of the Asia range
– Strong breakouts from overnight compression
– Directional push before New York volatility
This session frequently defines the directional bias into US hours. It’s a prime window for structured setups because market participation rises sharply.
US Session (13:00–20:00 UTC)
This is the most active window. The highest liquidity and most decisive moves occur here.
Typical features:
– Strong continuation or full reversal of the London move
– Reaction to economic news
– Trend acceleration during peak overlap hours
This is where major breakouts, deep liquidity hunts, and high-powered moves happen. If you trade momentum or breakout strategies, this session offers the cleanest conditions.
Weekend Behavior
Weekends operate on thin liquidity. Order books are lighter, market makers are less active, and volatility behaves differently.
Common outcomes:
– Sharp wicks that violate structure
– Sudden spikes without follow-through
– False breakouts with immediate reversals
Weekend moves often distort technicals. They can be useful for narrative-driven positions but carry higher risk for intraday traders.
How to Integrate Sessions Into Your Trading
Use sessions to filter when you participate and when you avoid noise.
Practical adjustments:
– Execute momentum setups during Europe or US hours.
– Treat Asia session as a range-building phase suitable for scouting zones.
– Avoid taking aggressive positions during weekend chop.
– Use session opens as key decision points for liquidity grabs.
When you layer session timing on top of structure, you refine entries and eliminate trades that lack the environment for follow-through.
The Strategic Advantage of Session Awareness
Session timing gives you clarity. You start anticipating where liquidity is likely to be engineered, where volume will enter, and when the market is likely to trend or stall.
This transforms your approach.
Instead of reacting to candles, you plan around expected volatility cycles.
Instead of forcing trades, you wait for session transitions that historically produce reliable movement.

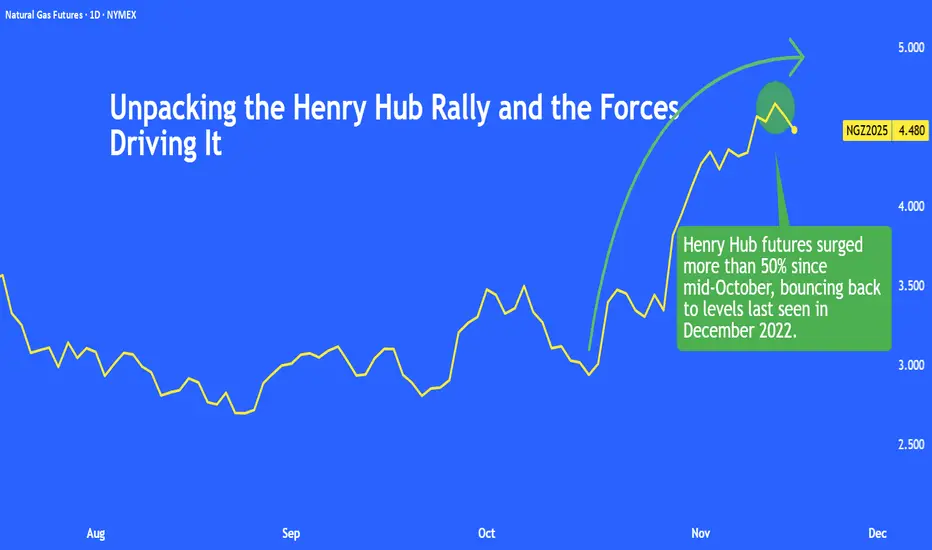
Unpacking the Henry Hub Rally and the Forces Driving It CME Henry Hub futures have surged since mid-October, reaching levels last seen in December 2022. This is an impressive rally given strong U.S. production and elevated inventories
This paper breaks down the key drivers behind the price spike and the market trends that continue to steer Henry Hub futures.
Surging LNG Demand Lifts Henry Hub Futures
The surge in CME Henry Hub futures was driven by strong export demand and record LNG activity. Flows to the eight major U.S. LNG terminals have averaged around 17.8 bcf/d this month, surpassing October’s record (16.7 bcf/d), as global buyers continue to seek U.S. supply.
Source: EIA
According to Reuters (via LSEG data), the U.S. became the first nation to export 10.1 million metric tonnes (mmt) of LNG in a single month in October, up from 9.1 mmt in September.
Europe remained the top destination, taking 6.9 mmt as the region rebuilt inventories ahead of winter and continued to diversify away from Russian gas.
Exports to Asia also climbed, supported by regional growth, energy transition policies, and Taiwan’s phaseout of nuclear power.
The EIA expects U.S. LNG exports to average 14.9 bcf/d this year (25% higher than 2024) and rise another 10% in 2026.
Rising domestic power demand, led by data centres’ soaring electricity use, adds another layer of structural support to gas consumption.
Together, robust export growth and strong power demand create a tighter domestic balance.
Colder Outlook Boosts Natural Gas Sentiment
Colder-than-expected winter forecasts sparked a mid-October rebound in Henry Hub futures as traders unwound shorts after weather models shifted toward stronger heating demand.
NOAA’s 16/Oct seasonal outlook indicated that La Niña conditions are likely to persist through winter, raising the probability of below-average temperatures across northern U.S. states.
These forecasts, while fluid, triggered a repricing of weather risk, with potential production disruptions and pipeline freeze-offs adding to market sensitivity.
The market is now focused on December’s cold risk: near-term demand may soften into Thanksgiving, but structural support and the prospect of a colder December continue to buoy sentiment. Meanwhile, record LNG exports provide a firm floor for Henry Hub prices this winter.
Henry Hub Gained Despite Rising Production and High Storage Levels
Henry Hub prices have continued to surge even as U.S. natural gas production in the Lower 48 states hit a record 109 bcf/d so far in November, up from 107 bcf/d in October. The rise in output typically acts as a bearish factor for prices.
Source: EIA
Over the past six weeks, storage injections have exceeded expectations in five of those weeks.
Source: Investing.com
Additionally, inventories are about 4.2% above the five-year seasonal average (2020–2024).
Source: EIA
While record production and elevated storage levels are weighing on sentiment, strong LNG exports and colder weather forecasts are providing enough support to sustain the recent rally in Henry Hub prices.
Options Skew Signals Caution Now, Optimism Ahead
The front-month November contract shows heavier put positioning, indicating short-term caution.
Source: CME QuikStrike
However, higher call open interest in subsequent contracts suggests that market participants expect Henry Hub prices to strengthen in the months ahead.
Source: CME QuikStrike
Despite the recent price surge, put OI remains concentrated around the USD 3 strike, indicating downside hedging. In contrast, call open interest is higher and more broadly distributed above USD 4.6, suggesting expectations for further upside potential.
Historical Trade Set-up
Winter-driven heating demand, combined with record U.S. LNG exports, provides a firm seasonal tailwind for Henry Hub prices.
Although natural gas prices tend to firm toward year-end, volatility remains high. For example, the January contract (NGF2025) between mid-November 2024 and the end of December, Henry Hub prices rallied but experienced sharp swings.
In 2023, an outright long in the January contract (NGF2024) ultimately finished at a loss by expiration.
Given the CME Henry Hub futures contract size of 10,000 MMBtu, the gross mark-to-market loss for going long on the NGF2024 contract would have been USD 6,080 per contract between 17/Nov/2023 and 27/Dec/2023:
PnL = (3.227 – 2.619) × 10,000 = USD 6,080
To mitigate volatility and hedge, traders often use calendar spreads. Entering one in mid-November 2023 would have generated a gain even though an outright NGF long had declined.
The gross mark-to-market profit on the NGF2024/NGG2024 calendar spread would have been USD 1,300 per contract.
The spread generated a profit because the later-month NGG2024 contract declined more than the front-month NGF2024 contract. In calendar spreads, gains occur whenever the later month lags the front month—either by falling more or rising less.
For Henry Hub, this typically happens when near-term demand or supply conditions keep the front month relatively firmer, allowing the trade to capture month-to-month price differences with lower overall market exposure.
This content is sponsored.
MARKET DATA
CME Real-time Market Data helps identify trading set-ups and express market views better. If you have futures in your trading portfolio, you can check out on CME Group data plans available that suit your trading needs at tradingview.com/cme .
DISCLAIMER
This case study is for educational purposes only and does not constitute investment recommendations or advice. Nor are they used to promote any specific products, or services.
Trading or investment ideas cited here are for illustration only, as an integral part of a case study to demonstrate the fundamental concepts in risk management or trading under the market scenarios being discussed. Please read the FULL DISCLAIMER the link to which is provided in our profile description.
Liquidity Basics: Equal Highs/Lows, Inefficiencies & POIsPrice doesn’t move randomly, it is always attracted towards liquidity.
Every wick, breakout, and fake-out tells a story of orders being filled.
If you can read where those orders are hiding, you stop trading noise and start trading intention.
Equal Highs & Lows — The Obvious Targets
Retail traders love to mark equal highs and lows as “strong support/resistance.”
Smart money sees them as fuel.
Above equal highs = cluster of buy stops.
Below equal lows = cluster of sell stops.
When price reaches them, it’s a collection of accumulated liquidity as a main driver behind that move.
Inefficiencies — Fair Value Gaps
Also known as Fair Value Gaps (FVGs) or imbalances, these occur when price moves too quickly, leaving unfilled orders behind.
Price often revisits these zones later to rebalance.
Spot them between large candles with no overlap, they often mark where institutions filled partial orders.
Points of Interest (POIs)
POIs are areas where liquidity and inefficiency converge , the zones of intent.
Look for:
Liquidity sweep of equal highs/lows
Return to imbalance or order block
Shift in market structure
That’s where high-probability setups occur.
Note:
Stop chasing every candle.
Start mapping why price moves.
Equal highs and inefficiencies are magnets, with proper plan and confluence this can represent your strong side of trading.

EURJPYEurjpy buy opportunity, using buy stop will wait for the trade to open , always keeping trading simple and straightforward remember to maximise profits and have a safety Stop Loss

USD/JPY — Monthly Outlook (Technical + Macro + Policy)USD/JPY — Monthly Outlook
(Technical + Macro + Policy)
* The USD/JPY pair remains under broad long-term downward pressure, driven by persistent rate differentials and Japan’s push for fiscal expansion.
* The current zone around 155 has historical significance as these levels were last seen in the early 1990s (almost 35 years ago), highlighting the extraordinary extent of yen depreciation.
* At the same time, Japan is now considering a ¥17 trillion fiscal stimulus package, which is fundamentally yen-negative.
* Expansionary fiscal policy, without matching monetary tightening, typically accelerates currency depreciation.
- This increases the probability that USD/JPY retests the psychological 160 handle.
Source of News: lnkd.in
Technical Structure (Monthly Inverted Chart)
- The pair remains in a long-term uptrend on the USD/JPY axis (yen weakening).
- Price continues to hold above the 145 support and is hovering above 150, around 154.80.
Key Levels:
- 155 → Historically watched intervention zone for BoJ; markets remember 2023–2024.
- 160 → The line where BoJ/MOF have repeatedly signaled discomfort and, earlier, intervened.
- 145–148 → Major multi-year support. A sustained break below this range would be structurally yen-positive, but that is unlikely without a major policy shift.
What to Expect Going Forward
- USD/JPY continues drifting higher toward 160
But
- It might fail to sustain any breakout above 160–162 due to intervention risk by BoJ/ MOF, creating the classic "intervention ceiling" scenario.

Gold Price Balanced Amid Heightened UncertaintyGold Price Balanced Amid Heightened Uncertainty
As the XAU/USD chart shows, last week gold prices fell sharply, interrupting the previous upward trend. This decline was driven by two main factors:
→ End of the US government shutdown. This is believed to have reduced short-term economic risks and lessened demand for gold as a “safe-haven” asset.
→ Hawkish statements from Federal Reserve officials, which lowered market expectations for rate cuts. This pushed up US Treasury yields, traditionally putting downward pressure on non-yielding assets like gold.
This week, the market is awaiting a wave of delayed US economic reports that were postponed during the shutdown, including:
→ Labour market data (Non-Farm Payrolls)
→ Inflation data (CPI)
These releases are expected to give traders greater clarity on the future trajectory of Fed interest rates.
Technical Analysis of XAU/USD
From a technical perspective, the price is currently trading at the intersection of two key lines:
→ Resistance line from the upper boundary of the descending channel originating at the all-time high. Buyers attempted to break through this level last week but were unsuccessful.
→ Support line from the lower boundary of the ascending channel, in place since early autumn.
Given the above, it is reasonable to suggest that:
→ the market is in a balanced position, with traders adopting a wait-and-see approach;
→ a breakout from the symmetrical triangle could indicate the direction of the next significant move in gold prices.
This article represents the opinion of the Companies operating under the FXOpen brand only. It is not to be construed as an offer, solicitation, or recommendation with respect to products and services provided by the Companies operating under the FXOpen brand, nor is it to be considered financial advice.
