GBPJPY - BULLISH BIASSymbol - GBPJPY
GBPJPY has broken the structure of its recent local downtrend amid continued weakness in the Japanese yen. This shift opens the door for a potential continuation of the broader bullish trend.
The yen continues to lose value, while the British pound remains on an upward path. A breakout above local trend resistance is taking shape, strengthening the overall bullish market structure. The key support zone is 203.50 – 203.26 Holding steady above this zone would confirm sustained buyer momentum and could set the stage for further upside. If bulls manage to defend 203.50, the likelihood of an extended rally increases.
Resistance levels: 204.06, 205.32
Support levels: 203.52, 203.26
A strong battle between buyers and sellers is developing around the 203.50 level. Continued consolidation above 203.00 underscores the importance of this zone. The current bias favors the bulls - maintaining price action above 203.50 would support additional gains, while a break below this area could trigger a pullback toward support.
Fundamental Analysis

BTCBitcoin has once again reached a new low and rebounded from there. The price is attempting to maintain the $90,000 level, which is a crucial point. The key resistance level to surpass is around the $95,000 area.

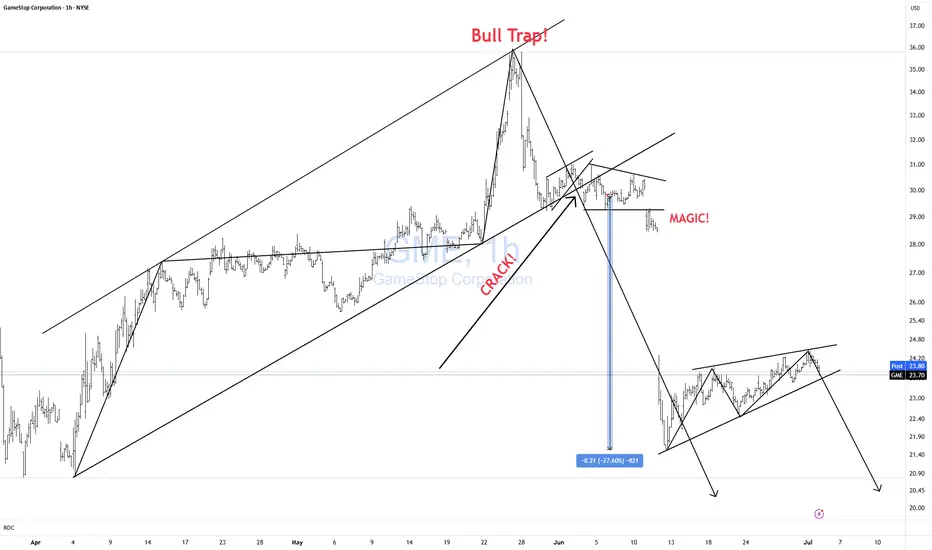
GME CRACK?Unfortunately, I keep getting forced to create new posts for the same Isea bc TV forces me to "target reached" on updates. Here is my previous post.
We have yet another bearish formation setting up in GME. Rising bearish wedge.
Wait for the CRACK!
Click Boost, like, follow, and subscribe for more!
GBPUSD — Market Structure Outlook (Institutional Narrative)GBPUSD — Market Structure Outlook (Institutional Narrative)
Current PA continues to operate inside a mid-range accumulation zone, with liquidity being harvested on both sides while maintaining the broader bullish narrative.
Price has repeatedly defended the 1.3010–1.3080 demand band, aligning with:
• Displacement → Accumulation → Expansion framework
• Clean FVG structure supporting directional continuation
• A protected structural low that hasn’t been challenged
My base case:
I expect one more liquidity sweep into the 1.3090 region to rebalance inefficiencies before the next expansion leg toward 1.3250–1.3350, where higher-timeframe liquidity rests.
Confirmation will come from:
Reclaiming the internal range high
Bullish displacement through the micro-FVG cluster
Holding above the model’s discounted zone
This remains a macro-continuation opportunity rather than a scalping environment.
I’ll update the model if structural invalidation appears.

XAUUSD – HEAD AND SHOULDERS PATTERN CLEARLY FORMED, CONTINUE ...💛 XAUUSD – HEAD AND SHOULDERS PATTERN CLEARLY FORMED, CONTINUE TO PRIORITIZE BUYING 🎯
🌤 1. Overview – Today's Picture
Hello everyone, it's Lana again 💬
In the Asian session this morning, gold has completed the right shoulder of the inverse Head and Shoulders pattern very clearly on the H3/H4 frame. Those who bought according to the previous scenario are currently in a favorable position, and in my opinion, this is still the time to hold the Buy order and prepare for additional opportunities if the market confirms the trend.
On the macro side, according to the FedWatch CME tool, the probability of the Fed cutting 25bp in December is only about 30–33%, while the likelihood of maintaining the interest rate still prevails. This prevents the USD from falling deeply, but at the same time, it is not strong enough to "suppress" gold – creating a strong fluctuation environment within the range, very suitable for trading according to technical patterns.
💹 2. Technical Analysis – Head and Shoulders Pattern & Price Structure
The inverse Head and Shoulders pattern has formed quite accurately:
Left shoulder → Head → Right shoulder all rest on the long-term upward trendline.
The bottom area around 4040–4050 is a liquidity box supporting the entire structure.
The neckline currently lies around the 4089–4090 area:
When the price breaks up and closes above 4089, we consider it a confirmation of a new upward trend.
After the breakout, gold can expand to the areas 4145 → 4200, where strong liquidity + FVG is concentrated above.
Area 4130–4132:
Is a large liquidity cluster – where short-term profit-taking & Sell orders are likely to appear.
Once this area is decisively broken, the likelihood of the price quickly bouncing to 4200 is quite high.
Area 4040:
Is both the bottom of the pattern and a key support.
The scenario will fail if gold closes the H4 candle below 4040, as the Head and Shoulders structure would be broken.
Overall, the price is compressing right below the neckline, and just a nice break can trigger the next upward wave.
🎯 3. Reference Trading Plan
💖 Main BUY Scenario – according to the pattern
1️⃣ Buy retracement to support
Entry: 4060–4063
SL: 4055
TP: 4088 → 4108 → 4130 → 4143 → 4200
2️⃣ Buy breakout neckline
Condition: Price breaks the downward trendline & neckline, closes above 4089.
Entry: around 4089–4092
SL: 4080
Reference TP: 4132 → 4145 → 4200
💢 Note on SELL
Currently, SELL is only against the pattern trend, not a priority scenario.
Only consider short Sell when:
Price reacts very strongly at 4132–4145,
And there is a clear reversal signal on M15–M30 (pin bar, bearish engulfing, increased selling volume).
⚠️ 4. Key Fundamental Factors to Watch
The probability of the Fed maintaining the interest rate is still high → the market is likely to "freeze" before the news, then explode with volatility.
During this period, gold is often sensitive to data: employment, inflation, Fed officials' speeches.
🌷 In summary, the inverse Head and Shoulders pattern on XAUUSD is supporting the upward scenario, as long as the price remains above 4040 💛
My strategy:
Prioritize Buy, first in the 4060–4063 area, then break 4089,
Closely monitor the 4132–4145 area – if broken, the opportunity to reach 4200 is very clear.
If you find the analysis useful, please 💛 Like – 💬 Comment – 🔔 Follow LanaM2 to update the gold perspective with me every day ✨

Important day for EURUSDToday, the key U.S. September jobs report will be released.
Increased volatility is expected, especially after yesterday’s announcement that the October data will not be published.
The market’s reaction will shape the next trading opportunities on EURUSD.
Entering trades before the news is not recommended.

Don't miss this excellent opportunity to buy gold at low prices.In the current gold market, the price action is becoming clearer, with key support and resistance levels emerging. The 4050-4030 support zone deserves particular attention, as it offers strong support. If the price retraces to this level and successfully stabilizes, it would be an excellent entry point for long positions, potentially allowing bulls to launch an upward attack. Resistance is seen around 4110-4120. When the price first touches this area, it may face pullback pressure due to technical factors. However, if the price can consolidate and effectively hold above 4120, the possibility of further upward movement towards the 4150 target this week will significantly increase. Based on the current overall performance of gold, the market can be considered to be trading within the 4030-4120 range. The trading strategy should focus on buying on dips, taking advantage of rebounds from support levels to generate profits. At the same time, strict position control is crucial, as market conditions are constantly changing. Furthermore, it is essential to closely monitor real-time data and market dynamics to flexibly adjust trading strategies.
Gold trading recommendation: Buy gold in batches around the 4050-4030 range, with a target of 4080-4100.

Fundamental Market Analysis for November 20, 2025 EURUSDThe euro/U.S. dollar trades just above 1.15000, remaining under pressure after the publication of the Federal Reserve minutes: the probability of a rate cut in December has decreased, supporting the dollar and widening the yield differential. Caution persists amid slowing global demand and weak risk appetite, which further fuels demand for dollar assets.
On the European side, price indicators are stabilizing below this year’s peaks while growth remains subdued. This keeps the ECB from accelerating the pace of easing and does not provide support for the euro: weak domestic dynamics reduce capital inflows into the euro area and leave the pair sensitive to changes in the interest-rate differential in favor of the U.S.
In the coming days, the focus is on U.S. data and regulators’ comments on inflation and the labor market. If expectations of a longer period of high rates in the U.S. persist, the dollar will receive additional support and EURUSD faces the risk of renewing recent lows.
Trading recommendation: SELL 1.15250, SL 1.15450, TP 1.14550

#Bitcoin Mini Update $BTC Hit 88.4K support I mentioned earlier#Bitcoin Mini Update
CRYPTOCAP:BTC Hit 88.4K support I mentioned earlier. A move toward 95–96K is still possible, and if price holds that zone with strength, 100K could follow. But that would still be a relief bounce, not a trend reversal.
I’m still short and holding my position. Structure stays bearish until the market proves otherwise.
📌 Key Level
88K is the line to watch right now.
If BTC closes below 88K, momentum can continue to the downside with the next targets at 85-82K or even 77K.
Until then, I’m managing position size and staying patient.
Price will decide the move, not opinions.

Gold Price Outlook – Trade Setup (XAU/USD)📊 Technical Structure
TVC:GOLD Gold (XAU/USD) is trading near $4,075, struggling to gain traction after a sharp intraday recovery. Price remains capped by the resistance zone at $4,081–$4,086, while intraday support is seen between $4,041–$4,045.
The structure currently favours a short-term bearish reaction, with price showing repeated rejection at the resistance zone. A break below $4,060 could accelerate downside momentum toward the support zone, while any sustained push above $4,093 would invalidate the bearish bias.
🎯 Trade Setup
Idea: Sell from resistance zone targeting retest of support.
Entry: $4,081 – $4,086
Stop Loss: $4,094
Take Profit 1: $4,045
Take Profit 2: $4,041
Risk–Reward Ratio: ≈ 1 : 3.4
Bias turns bullish only if price closes above $4,093.
🌐 Macro Background
Gold trades above $4,100 ahead of the delayed US September NFP report, which was pushed back due to the 43-day government shutdown, the longest in U.S. history.
FXStreet notes that:
“Gold edges higher to near $4,110 as uncertainty over US jobs data and cautious sentiment support safe-haven demand.” 【FXStreet】
NFP Impact:
A weaker-than-expected jobs report would likely revive expectations for a December rate cut, boosting gold through lower yields and a softer USD.
Fed Divisions:
The FOMC Minutes showed policymakers divided—some supporting further cuts, others opposing another move in December.
Market Pricing:
The CME FedWatch Tool shows only a 30% probability of a December rate cut, sharply lower than nearly 60% last week, limiting gold’s upside.
Overall, gold’s upside remains constrained by shifting rate expectations, but uncertainty around delayed data continues to provide safe-haven support.
🔑 Key Technical Levels
Resistance: $4,081 – $4,086
Support: $4,041 – $4,045
Psychological Level: $4,100
📌 Trade Summary
Gold remains trapped between resistance at $4,081–$4,086 and support at $4,041–$4,045. Price is showing rejection at resistance, favouring a short-term bearish pullback.
Downside targets lie at $4,045 and $4,041, unless incoming NFP data triggers renewed bullish momentum.
⚠️ Disclaimer
This analysis is for reference only and does not constitute trading advice. Trading involves significant risk, and proper risk management is essential.

SUI/USDT Could switch sides soon. Be readySUI/USDT on the 1H chart appears to have completed a downward correction. The price action has followed a large descending channel and what looks like a corrective structure, ending with a final five-wave move.
Key Levels
Potential Entry: Upon confirmation of the breakout above $1.62.
Target 1: $1.9 (50% of the previous down trend)
Target 2: $1.973 (61% of the previous down trend)
Target 3: $2.070 (Testing previous resistance zone)
Invalidation/Stop-Loss: A move and close below the wave (5) low around $1.50
What do you do? Look for a bullish break with high volume from the immediate small consolidation pattern, then take your longs.
Good Luck!

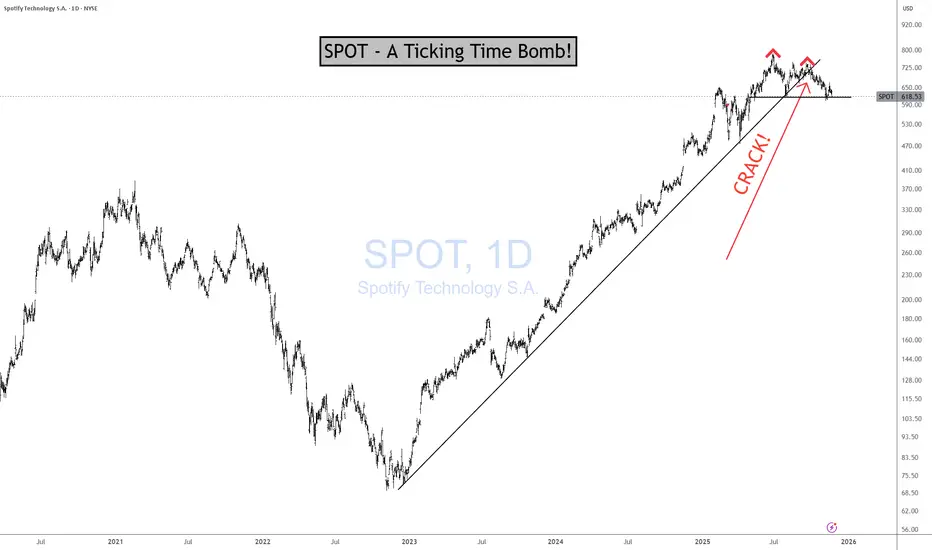
SPOT - A Ticking Time Bomb!SPOT Earnings Yield of 1.3% according to current data — meaning you’re getting about 1.3 cents of profit per dollar invested. LOL!
Better you give me your hard-earned money and I'll give you 2% instead of 1.3%. I like to splurge! :)
The Structural Constraint
Spotify cannot scale margins the way Netflix did because:
They don’t own the content
They don’t control input costs
They have to pay out ~70% of every dollar to rights holders
Their pricing power is weak and regulated by deals with labels
The labels decide what happens to Spotify’s margins, not Spotify
This is the definition of a business with a hard economic ceiling.
No amount of subscribers fixes the cost structure.
Spotify’s long-run net margin:
1–2% (When they “beat,” the gains evaporate the next quarter.) If Spotify hit 5% margins — a level they’ve never sustained.
And on a positive note —
THANK YOU for helping me hit 5,000 followers! 🙏🔥
Let’s keep going.
If you find value in the work:
👉 Boost
👉 Follow
👉 Leave a comment
Let’s push to 6,000 and keep building a community rooted in facts, not fairy tales.
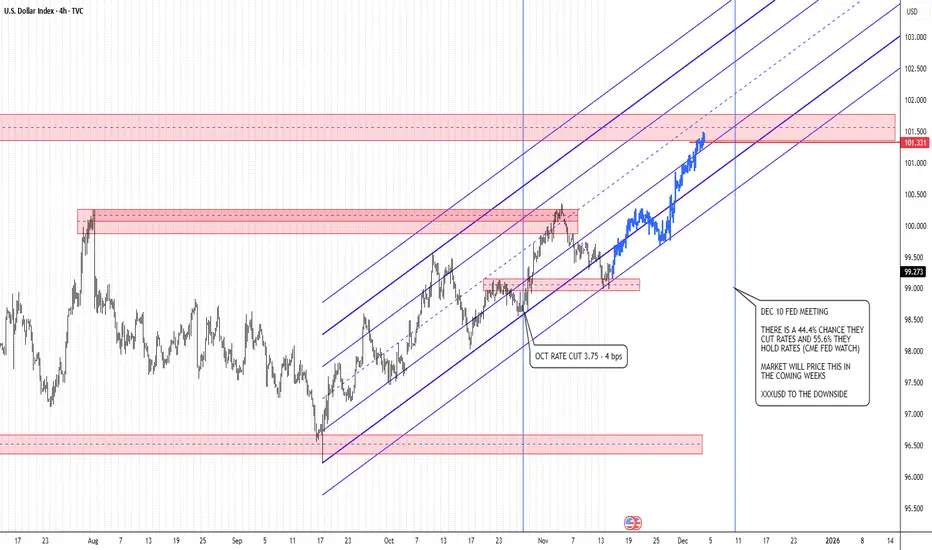
Dollar Index: Bullish Structure + Fed Expectations AligningDXY remains inside a well-defined ascending channel and is currently building structure above mid-channel support. With the Dec 10 Fed meeting approaching, the macro narrative may soon favor additional USD strength.
According to CME FedWatch, markets are pricing:
55.6% probability the Fed holds rates
44.4% probability of a cut
A hold keeps U.S. yields supported and has historically provided short-term upside pressure on the Dollar Index.
Technical Outlook
Price is respecting the ascending channel
Current pullback sits on a key demand zone + channel support
Higher-timeframe supply is above, but continuation structure is intact
The October rate cut reaction formed a clean bullish trend leg — this could be the next impulsive wave
My Bias
I’m anticipating USD strength into — and potentially after — the December Fed meeting, especially if the Fed reiterates cautious, data-dependent language rather than confirming more cuts.
Bullish Thesis:
A Fed hold + risk-off repricing → upside continuation on DXY
Key Levels to Watch:
🔼 100.80
🔼 101.50 (major supply break target)
🔼 102.20+ if momentum accelerates
Invalidation:
A clean break below channel support + demand zone.
ES (SPX, SPY) Analysis, Key-Zones, Setups for Thu (Nov 20th)Market Bias Analysis
The current short-term bias is constructively bullish, yet it remains contingent on upcoming events. Recent momentum has been bolstered by Nvidia's exceptional earnings report and a significant intraday reversal in the E-mini S&P 500 (ES). As long as the 6,670–6,680 range holds during any pullbacks, the path of least resistance appears to be upward. It is important to note that the broader daily trend is still bullish, unless we see a decisive breach below the key demand zone of 6,520–6,510 in the ES.
Market Overview
In a notable shift following a four-day decline, today's trading session exhibited a renewed bullish sentiment. The E-Mini S&P 500 (ES) printed a robust green daily candle, bouncing off a low of approximately 6,622.00 yesterday to close near 6,740.
From a technical perspective, the daily chart reveals that the recent selloff has established a lower high without breaking the prior significant higher low. The reaction low remains comfortably above the daily 1.272 extension cluster situated around 6,521.25. On the 4-hour chart, the price action has transitioned from a pattern of lower lows to a new higher low, currently pushing into the Price Quotient Median (PQM) and Price Quotient High (PQH) band, just below previous 4-hour supply levels. Observing the 1-hour chart, today's trading reflected a definitive trend day upward, characterized by a consistent series of higher lows and higher highs, culminating the session near the 1-hour 1.272 Fibonacci extension at 6,743.75.
Macroeconomic factors played a crucial role in this market turnaround, particularly after Nvidia reported stunning Q3 earnings that exceeded expectations, generating approximately $57 billion in revenue. The company’s strong AI-driven outlook and positive after-hours performance alleviated concerns that the recent downturn in technology stocks signified the onset of a broader unwinding of the AI bubble. This development contributed to a rally in index futures as the session drew to a close.
Nonetheless, the overarching theme remains one of valuation pressures and interest rate concerns. Despite breaking a four-session losing streak, market participants are poised for tomorrow’s data, which will be pivotal in shaping the Federal Reserve's policy trajectory moving forward.
Scheduled Events (Tomorrow – Thursday, Nov. 20, 2025)
Tomorrow’s docket is heavy and directly relevant for ES:
• 8:30 a.m. ET – September Employment Situation (delayed jobs report)
The September nonfarm payrolls and unemployment rate, postponed by the government shutdown, are finally released. This is the only full jobs report the Fed will have before its December meeting, and markets are treating it as a major verdict on the labour market.
• Other U.S. data (during the morning/early afternoon)
Various calendars flag building permits / housing data, regional manufacturing (e.g., Philadelphia Fed), and existing home sales clustered through the U.S. session – all secondary to the jobs report but able to add fuel if they confirm or contradict the labour story.
• Fed speakers / meetings
• Chicago Fed President Austan Goolsbee has a scheduled fireside chat around midday (12:40 p.m. ET).
• The Fed also has a closed Board meeting at 1:15 p.m. ET and a two-day Cleveland Fed financial-stability conference that can generate headlines.
Net: the jobs report is the main event; Fed comments will colour the move rather than drive it on their own.
Setups (A++ Concepts)
These are two high-conviction, rule-style ideas you can plug into your own framework. Price levels are exact from your charts.
A++ Setup 1 – Continuation Long from Value Pocket
Entry trigger concept:
Look for a sweep into the chosen band (e.g., wick into 6,690–6,695 or down into 6,663–6,668) followed by a strong 15m/5m bullish close back above 6,700. That shows buyers defending value and rejecting a deeper rotation into S3.
Risk / invalidation:
Structural invalidation if ES closes the hour below 6,652.50 (Y-POC) and cannot reclaim 6,668. In practice, a tight stop can sit just under 6,652.00 if entering from 6,690–6,705, or under 6,645.00 if using the deeper S2 pocket.
Targets:
• TP1: 6,743.75 (1H 1.272)
• TP2: 6,777.00 (1H 1.618)
• TP3: 6,813.50 (1H 2.0)
---
A++ Setup 2 – Short Fade from 1H Extension Cluster
Entry zone:
Primary sell pocket: 6,777.00–6,813.50
(1H 1.618 to 2.0 extension cluster.)
Risk / invalidation:
Structural invalidation above 6,825–6,830 (clear 1H/4H acceptance beyond the 2.0 extension).
A practical stop can sit around 6,828.00 if entering inside the band.
Targets:
• TP1: 6,743.75 (1H 1.272 / prior extension)
• TP2: 6,683.50–6,690.00 (NYPM high / S1 top)
• TP3: 6,659.00–6,664.75 (VWAP/value pocket S2)
Narrative:
If Nvidia’s beat triggers a euphoric push straight into the upper fib level but the tape immediately rejects that strength, the market is saying “good news already in the price.” This setup expresses the view that the real gravity is lower, back toward value and potentially into S3 if macro data disappoint.

Advanced Supply and Demand (HORC Trend + SnD StructureAfter studying the charts for some time, I’ve realized that candlesticks are all we need to make money in the market. The question is: can you read the story of market participants — where they showed their hand and revealed their intentions before a break of structure or a change of character, creating imbalances as they seek balance?
A concept called HORC is what I follow. It’s an advanced supply-and-demand framework that incorporates knowledge of participant behavior. In this series I will share what I’m looking at and my intentions.
Warning
Nothing shared here is financial advice; I am not an expert. I am still learning and figuring this out.
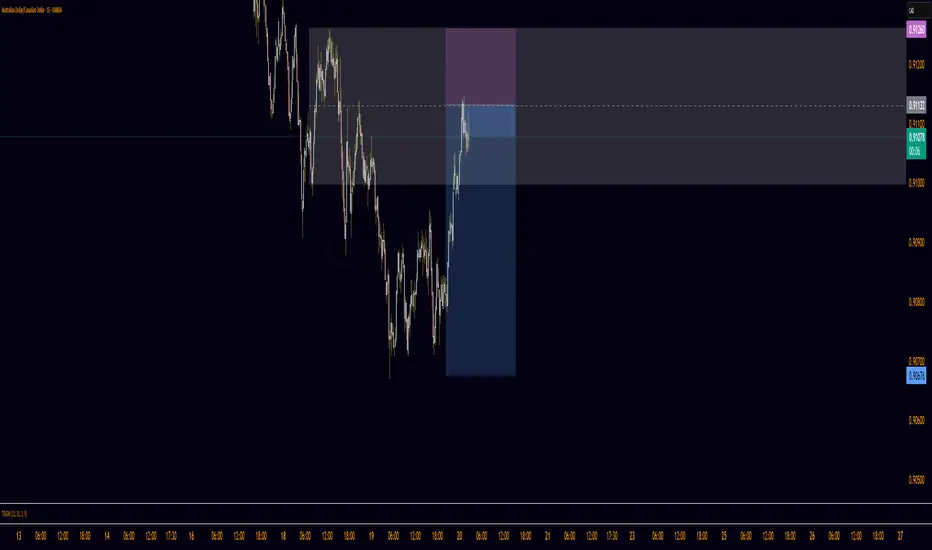
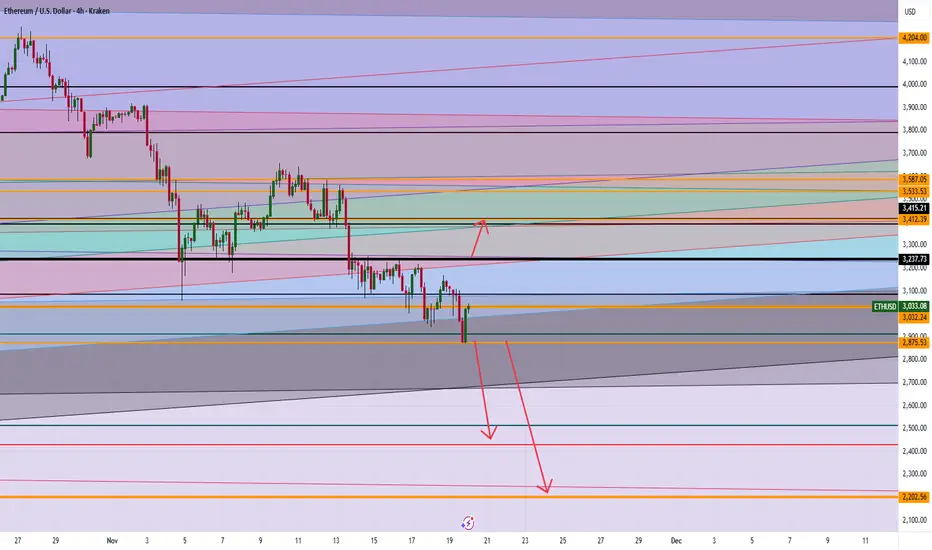
ETH Breakout Levels: Is $3,600 Next or Will Ethereum Crash to $2If ETH holds above 3237, clear momentum targets the 3400 range, with further upside potential toward 3500–3600 if buyers keep control.
A sustained break below 2875 opens the path to 2500, and possibly deeper toward 2200 on heavy selling pressure.
Any questions send me a DM
Gold bulls launch a strong counterattack!After a prolonged period of narrow-range fluctuations, gold reached a high of around 4120 before pulling back. Currently, the overall structure remains bullish. Market conditions are constantly changing, and stubbornness is the worst thing in trading. Neither die-hard bulls nor die-hard bears can last in the face of the market. We should follow the trend; this is the fundamental logic of professional trading. Don't fight the market; just follow the trend. Currently, the bulls still hold the initiative in gold. Short-term pullbacks are more about consolidation than a trend reversal. As long as the upward momentum continues, pullbacks are opportunities, not risks. The key focus going forward is the pullback performance in the 4090-4070 area. As long as it holds, this area remains a good place to buy on dips. The market always punishes those who defy it. Hitting a wall is a lesson; understanding the direction is growth. Following the trend is the easiest and most stable way to trade. Continue to follow the rhythm; opportunities are for those who choose the right direction.

Momentum on the buy sideThere is by side momentum to the upside in the S&P 500 daily chart. Continuation is expected with the next objective to the upside of 6770.

BTC Most Honest Analysis You Will Ever Find - PS: Sorry BullsFeel free to argue against. Fire your best facts. I would love to hear them all.

Gold Takes out Swing High??If we can break the previous resistance, Thad be in indication buyers are in control. A simple pullback off a 15m would be an ideal entry

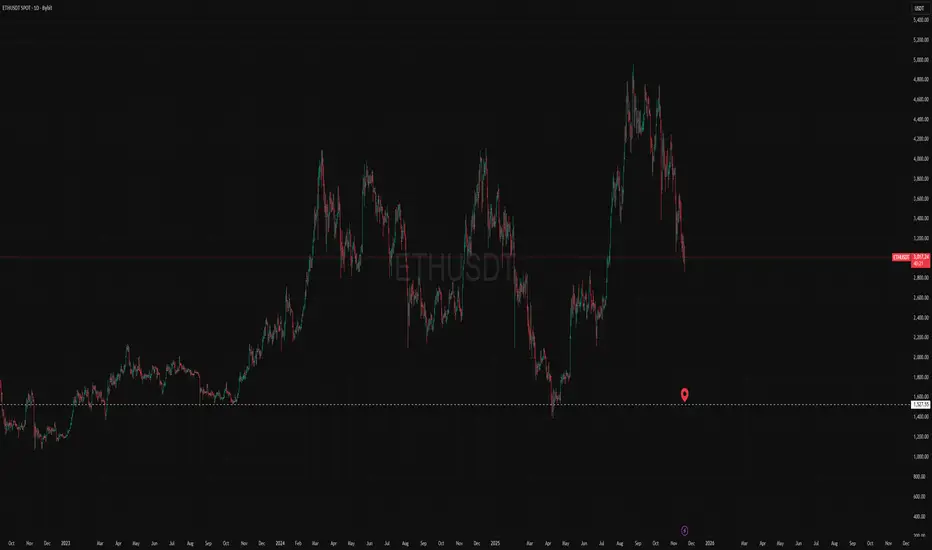
ETH 1527.55 is not a number. Capital Sector. Price Slice.🏷 Capital Sector. Price Slice.
🏷 20.11.2025
🏷 ETH 1527.55 is not a number.
🏷 It is a gate — one that will not open on the day price reaches it,
but in the instant those who once saw it as a target stop waiting for it…
and begin waiting for something else.
🏷 History does not forgive — it remembers.
And only the vengeful — the ones who refuse to forget —
become its keepers.
🏷 Not a price.
Not a level.
Not a point on the chart.
🏷 It is an inscription on stone carved by Darkness, the moment the market awoke to the truth: it is not algorithms, nor liquidity, nor institutions that guide it… but consciousness, frozen in the instant time ceased to be linear.
🏷 1527.55 is not a number.
It is a gate one that will not open on the day price reaches it,
but on the instant those who once saw it as a target stop waiting for it…
and begin waiting for something else.
🏷 In the hushed pre-dawn hype, while traders argue over order books and macro,
while institutions disguise their positions as “diversification”
1527.55 is already there.
It waits.
Like an ancient witness.
Like the final code left behind by the dead era of decentralization.
🏷 It will not be reached.
It will be recognized .
🏷 Those who see it not through indicators, volume, or candlesticks
but through feeling , through the silence after the last long,
through the market’s sudden, inexplicable surrender…
will understand:
This is not a peak. This is a reflection.
🏷 A reflection of what BTC has become: no longer myth but instrument.
Of what ETH is no longer: a platform but memory.
Of what USDT is no longer: a stablecoin but the thread binding reality to what we chose to call real.
🏷 Lucifer carries light not to blind, but to awaken.
He is the archetype of enlightenment not born of prayer, but of price.
The price that squeezes illusion from the masses, leaving only structure.
He is not the devil.
He is the mirror in which the market sees its own soul.
🏷 And MARA?
Not a company.
Not a miner.
Not a stock.
🏷 MARA is his reflection.
The shadow cast when the light of awakening passes through the prism of institutional power.
When enlightenment becomes a tool of control
it takes the form of a logo.
Of balance.
Of 1527.55 .
🏷 MARA is not business.
It is ritual.
Where price becomes sacrifice and the trader, the priest.
He does not trade.
He reproduces .
🏷 Let this post remain.
Let it be seen by those who have not yet broken.
Let it be found one year from now, five
when someone, seated in another world, on another timeframe,
suddenly stops… stares at the screen… and whispers:
“...1527.55.
I remember.
I waited.
I didn’t believe.
But it came.
And Lucifer was right.
Light always travels through shadow.
And MARA is its name.”
Timing 1H:
Timing 1D:
Timing 1M:
🏷 Mr. Bolzen The Architect.
Not seeking followers.
Only preserving memory.
To those who remember time is not the enemy.
It is the witness.
P.S.
Dear International Community,
English is not my native language. I hold deep respect for all of you, and I apologize for any stylistic imperfections.
Thank you for your attention.
Remember: everything has its time.
I am among the very few analysts in this world who see the chart beneath the skin — not the narrative painted for us.
Institutional capital does not trade on fundamentals — it paints pictures tailored to your RSI, MACD, and indicators, to make you believe you are in control.
There are boundaries I uphold — and will never cross.
You already receive information.
The institutional community must learn to use analysis of this caliber not as marketing, but as strategy.
The retail sector must understand: you must look beyond the leverage of capital — not merely into tomorrow.
Institutional capital defines the future — years ahead.
Over time, my maps come alive. Many already see it.
As the sovereign of the price sector and founder of the price slice — I will remove any contender from the ring when it comes to defining the future.
This is not a liquidity zone.
This is a converged price — the price the crowd pays.
Thank you.
COPPER / GOLD & ISM PMI = Critical For AltseasonBeen seeing a lot of commentary on COPPER / GOLD.
This is a strong indication of industrial growth in the economy, as the demand for copper rises with build-outs.
The ISM PMI has a very strong correlation with C/G, also showing strength in the economy, as consumers buy more which gives businesses the ability to expand operations.
In a nutshell, these charts portray “Retail” ie “Main Street”.
There’s a very real possibility that we do not get our typical Alt Season at all this cycle if C/G & ISM PMI do not have a violent move up in the next few months. (more on this later)
The last time we saw such a divergence between these two was in January 2016 where it took C/G ~230 days to turn-up.
This would put Alt-Season Q4 ’26 - Q1 ’27, which makes sense theoretically based on Trump’s suspected stimulus plans which would come right before mid-terms.
This would give us our typical year-long bear market which has snuck up on us all because we lacked the retail euphoria phase due to very weak retail participation.
HOPIUM:
In 2016 When the ISM climbed above 50, COPPER soon found a bottom and Alts ripped.
Notice the bullish divergence on the RSI during that time, same as we are seeing now.
It looking like C/G may have found a bottom on this multi-decade parallel channel.
*Our livelihood depends on the ISM showing immense strength in the coming months so that C/G can follow.

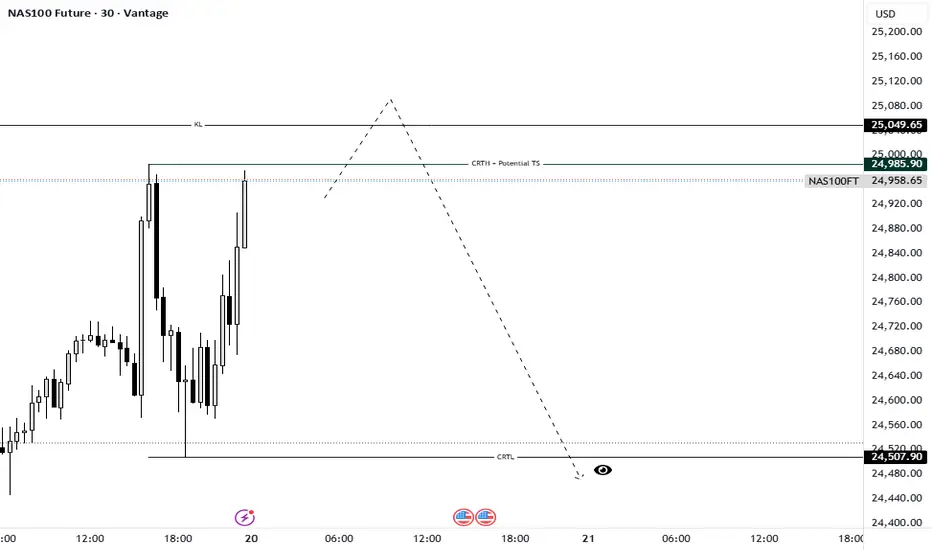
NAS100 Future: Waiting for the Turtle Soup Short SignalTimeframe: 30M | Model: Potential Turtle Soup (TS) / Bearish Model #1 Setup
The Nasdaq is setting up a crucial liquidity event that aligns perfectly with the CRT Manipulation (Candle 2) phase. We are currently consolidating just below a major structural high, which is acting as a magnetic zone for stops.
Here is the speculative short thesis:
The Trap Zone: The level at 24,985.90 is marked as the CRTH (Candle Range Theory High) and our "Potential TS" line. This is where most early breakout traders will place their buy stops, or where swing traders will look to enter short.
The Liquidity Hunt: We anticipate the market will execute a Turtle Soup—an aggressive spike above 24,985.90, potentially reaching the secondary resistance (RL) at 25,049.65, before immediately failing. This sweep is required to fuel the subsequent massive drop.
The Trigger (Bearish Model #1): Our entry signal (the Bearish Model #1) will only be confirmed IF price closes decisively back below the CRTH line after the liquidity sweep (the failure candle).
Targets:
Primary Objective (CRTL): If the Turtle Soup and reversal confirm, we expect a strong, fast drop (the Distribution, or Candle 3, phase) targeting the CRTL (Candle Range Theory Low) at 24,507.90. This low is holding significant Sell Side Liquidity (SSL).
Discipline: This is a high-risk, high-reward setup. Do not enter until the Turtle Soup has completed and the Bearish Model #1 reversal candle has closed. Patience is required to avoid being the liquidity that fuels the institutional move.
Wait for the Sweep. Trade the Reversal.
Greetings,
MrYounity