NVDA Head and Shoulders- Dec Rate Cuts has changed setupNvidia’s setup has shifted. With the Fed signaling a likely rate cut on December 10th, the market will start baking that optimism into asset prices ahead of time. When monetary conditions ease, high-valuation tech often gets an extra tailwind, which means the expected head-and-shoulders pattern on NVDA may fail to play out cleanly. The chart might still roll over, but the macro backdrop now works against a decisive breakdown. Short positions here demand caution.
Original post
Nvidia’s bear case rests on one core idea: the stock price assumes a flawless, world-eating AI future, and markets almost never deliver on “perfection narratives.” NVDA trades at extreme valuation multiples for a hardware-driven, highly cyclical business. Those multiples only hold if AI infrastructure spending keeps compounding at its current breathtaking pace for years. But that demand is dangerously concentrated in a handful of hyperscalers who are spending now and rationalizing later. Michael Burry’s recent argument sharpens this point: he claims true end-demand for AI horsepower is vastly overstated, and that much of the current GPU frenzy is a self-reinforcing loop of capital, hype, and accounting gimmicks rather than broad, organic need. If boards pause to question real ROI, or if the circular funding loop breaks Nvidia’s revenue curve can flatten quickly, dragging the valuation down with it.
Competition, long dismissed by NVIDIA bulls, is another structural headwind. AMD is now shipping accelerators that hyperscalers are actually integrating, and every major cloud provider is building in-house silicon to reduce dependence on NVDA’s margins. Even if Nvidia maintains leadership, it doesn’t need to lose the crown to lose the multiple, slight shifts in workload allocation or a handful of missed design wins are enough to pressure margins. And Burry’s critique deepens this point: he argues Nvidia’s reported profitability is flattered by depreciation assumptions and massive stock-based compensation that buybacks have failed to offset, meaning the “true” economic profit is less bulletproof than headlines suggest. Add to that the fact that U.S. export controls have effectively erased the China data-center market, once 20–25% of revenues and expectations of a seamless global TAM look increasingly unrealistic.
Technically, NVDA is doing exactly what a euphoric, overowned stock does when gravity starts tugging: momentum is fading, the price is slipping under short-term moving averages, and reactions to spectacular earnings have been strangely sluggish. That’s often the early signature of distribution rather than accumulation. And this lines up directly with Burry’s broader thesis: when a narrative becomes crowded and reflexive, the slightest wobble triggers violent air pockets. NVDA has become the ultimate proxy for the AI boom, the most crowded long in the market, meaning it’s the first thing funds sell when risk appetite cools, and the last thing buyers chase during corrections.
Put simply, Nvidia is a phenomenal company priced as if nothing can ever go wrong, while Burry is arguing that much of what looks “perfect” is not what it seems. The bear case isn’t that Nvidia collapses. It’s that the AI boom normalizes, competition accelerates, accounting realities catch up, margins slip toward something earthbound, and investors recalibrate how much they’re willing to pay. In that world, NVDA doesn’t need bad news to fall. It only needs the news to arrive slightly less euphoric than the fantasies currently baked into the price.
#NVDA #Bearish #HeadandShoulders #MichaelBurry
Fundamental Analysis

LINK TECHNICAL ANALYSIS — 1D📊
1. MARKET STRUCTURE
Long-term trend
The price is currently approaching this line, but has not yet tested it directly.
This is a key support level for the entire LINK market.
2. SUPPLY & DEMAND ZONE
Demand Zone — $9.6 – $4.8
The large red area. This is
a historical accumulation zone,
an area where LINK has been repeatedly defended,
an area to which the price has returned with each major dump.
Supply Zone — $15 – $20
The green area from which:
the price has been rejected repeatedly,
this is the selling wall from 2021,
a key target for bulls after the rebound.
3. CRITICAL LEVELS
Very important support
Type Level Description
Trendline ~11.5–12.2 USD We are very close to a test.
Horizontal 9.63 USD First major historical support.
Horizontal 4.84 USD Final low (strongest demand).
If the trendline breaks, the → ** LINK will almost certainly fall to 9.63**, and if that breaks too, → 4.8 USD is very likely.
4. MOMENTUM – STOCH RSI
On the Stoch RSI chart:
is extremely oversold,
similar to previous lows (2023, 2024),
signaling the possibility of a rebound within a few days/weeks.
5. PRICE SCENARIOS
🟢 BULLISH (bounce)
Condition: Maintaining the trendline
Expected movements:
Bounce around 11.5–12.5
Target 1: USD 15
Target 2: USD 18–20
Possible breakout → USD 22–24
This scenario is realistic if Bitcoin doesn't make another strong dump.
🔴 BEARISH (falling)
Condition: Breakout of the trendline with a daily candle below ~11.5
Expected movements:
A quick drop to USD 9.63
This could result in:
a bounce to ~12
or a continuation of the decline
If 9.63 falls → a practically certain target of USD 4.8
This level represents a significant historical accumulation and will not fall without a fight.
➤ Price is currently hanging by a thread.
The trendline is one of the most important support levels on the LINK chart.
Momentum is oversold → signal for a short squeeze/bounce.
But the local structure remains bearish.
➤ If the trendline holds → a thick long swing.
➤ If it collapses → we fall to 9.63 and possibly 4.8.

TRON (CRYPTO: $TRX) Shift After Ending USDJ Strengthens Its CoreTRON (CRYPTO: CRYPTOCAP:TRX ) has entered a new phase after officially retiring USDJ, its algorithmic stablecoin that has existed for over five years. Holders can now redeem at a fixed rate of 1 USDJ = 1.5532 TRX, closing the chapter cleanly and without market disruption. The shutdown signals TRON’s transition toward fully collateral-backed stablecoins like USDD and the massive USDT supply already dominating the chain. Globally, regulatory pressure continues moving the industry away from algorithmic models, making TRON’s timing strategic and aligned with long-term stability.
The shift also clears legacy risks and simplifies the ecosystem, helping new users and institutions navigate TRON more easily. Analysts view this move as a maturity milestone that prepares TRON for its next wave of products and infrastructure upgrades.
TRON’s dominance in the stablecoin sector remains unmatched. The network now hosts over 60% of the entire USDT supply, exceeding $78.5 billion, and continues to lead global settlement volume. In October, TRON processed $775.2 billion in monthly transactions, supported 76.4 million transfers, and maintained near-zero fees with sub-second finality. These metrics highlight why TRC-20 USDT is the preferred digital dollar across emerging markets, remittance corridors, and high-frequency commercial systems.
This dominance directly reinforces TRX utility. Higher settlement flows create more demand for bandwidth and energy, increasing long-term token usage. TRON’s infrastructure remains reliable, with protocols like JustLend, SunSwap, WINkLink, and JustStables anchoring billions in TVL. Tether’s consistent preference for TRON further accelerates liquidity growth.
Technicals
TRX rebounded strongly from the $0.28 demand cluster, forming a narrowing wedge with higher lows. Holding above $0.280–$0.285 keeps bullish momentum intact. Breaking $0.31 opens the path to $0.34, with a stretch target at $0.37. Losing support risks another retest of lower levels.

Solana (CRYPTO: $SOL) ETFs Surge as Price Tests Major SupportSolana (CRYPTO: CRYPTOCAP:SOL ) trades at $127.45 after a sharp 31% decline over the past month, but institutional activity is telling a different story. While retail sentiment weakens, capital continues flowing into newly launched Solana ETFs—creating one of the clearest divergences in the crypto market heading into late 2025.
Six U.S. spot Solana ETFs are now live, with issuers including 21Shares, Fidelity, VanEck, Canary Capital, Bitwise, and Grayscale. Fidelity’s FSOL on NYSE Arca quickly captured attention thanks to its staking component, making it the largest traditional asset manager offering staked SOL exposure. 21Shares also added competitive pressure by launching its ETF with a 0.21% fee after securing Cboe approval.
Combined ETF holdings now exceed $2 billion, and the inflows haven’t slowed—Solana ETFs recorded $26.2 million in net inflows on November 18, marking the 15th consecutive positive day. Remarkably, these inflows outpaced those of Bitcoin and Ethereum for the week. When institutions accumulate during market selloffs, it often reflects long-term conviction in underlying fundamentals such as Solana’s high throughput, low transaction costs, and increasingly mature ecosystem.
Technicals
Despite the correction, SOL is testing a major ascending-trendline support that has been respected several times. Price recently dipped into liquidity near $127, a level that has previously marked swing turns.
If support holds, the bullish continuation scenario comes into focus. The first target stands at $253, followed by $295. A breakout above both levels would strongly support new all-time highs heading into 2026.
If support fails decisively, the next demand zone lies between $110 and $100. A breakdown of that zone increases the probability of a deeper move toward $80. For now, buyers continue defending trend support, keeping the broader structure intact.

NVDA Head and Shoulders- Neckline BrokenNvidia’s bear case rests on one core idea: the stock price assumes a flawless, world-eating AI future, and markets almost never deliver on “perfection narratives.” NVDA trades at extreme valuation multiples for a hardware-driven, highly cyclical business. Those multiples only hold if AI infrastructure spending keeps compounding at its current breathtaking pace for years. But that demand is dangerously concentrated in a handful of hyperscalers who are spending now and rationalizing later. Michael Burry’s recent argument sharpens this point: he claims true end-demand for AI horsepower is vastly overstated, and that much of the current GPU frenzy is a self-reinforcing loop of capital, hype, and accounting gimmicks rather than broad, organic need. If boards pause to question real ROI — or if the circular funding loop breaks — Nvidia’s revenue curve can flatten quickly, dragging the valuation down with it.
Competition, long dismissed by NVIDIA bulls, is another structural headwind. AMD is now shipping accelerators that hyperscalers are actually integrating, and every major cloud provider is building in-house silicon to reduce dependence on NVDA’s margins. Even if Nvidia maintains leadership, it doesn’t need to lose the crown to lose the multiple — slight shifts in workload allocation or a handful of missed design wins are enough to pressure margins. And Burry’s critique deepens this point: he argues Nvidia’s reported profitability is flattered by depreciation assumptions and massive stock-based compensation that buybacks have failed to offset — meaning the “true” economic profit is less bulletproof than headlines suggest. Add to that the fact that U.S. export controls have effectively erased the China data-center market — once 20–25% of revenues — and expectations of a seamless global TAM look increasingly unrealistic.
Technically, NVDA is doing exactly what a euphoric, overowned stock does when gravity starts tugging: momentum is fading, the price is slipping under short-term moving averages, and reactions to spectacular earnings have been strangely sluggish. That’s often the early signature of distribution rather than accumulation. And this lines up directly with Burry’s broader thesis: when a narrative becomes crowded and reflexive, the slightest wobble triggers violent air pockets. NVDA has become the ultimate proxy for the AI boom, the most crowded long in the market — meaning it’s the first thing funds sell when risk appetite cools, and the last thing buyers chase during corrections.
Put simply, Nvidia is a phenomenal company priced as if nothing can ever go wrong — while Burry is arguing that much of what looks “perfect” is not what it seems. The bear case isn’t that Nvidia collapses. It’s that the AI boom normalizes, competition accelerates, accounting realities catch up, margins slip toward something earthbound, and investors recalibrate how much they’re willing to pay. In that world, NVDA doesn’t need bad news to fall. It only needs the news to arrive slightly less euphoric than the fantasies currently baked into the price.
#NVDA #Bearish #HeadandShoulders #MichaelBurry

BTC 1D: watching 64–73k box for Nov 25–26 FED weekBearish channel intact unless 80k is reclaimed. Map, not signal.
Key idea: the bearish channel guides price into 64–73k. If we drift there by Nov 25–26, FED could trigger the next major move.
Not advice: I act only if price respects the box and vol/volume confirm. Until then this is a roadmap, not a signal.
Which side of 64–73k breaks first?

Bitcoin Retesting 3 Year Inverse & Shoulders ? Bullish ?From April 2021 to November 2024 it seems that Bitcoin formed an inverse head and shoulders as viewed with monthly candles. BTC broke the neckline to the upside in November 2024 at 75k and ended the month around 95k, a nice move. It retested the neckline in March 2025, and now seems to be retesting the neckline again. As of today November 21, 2025, it is around 80k, with a retest of the neckline at 78K.
The next few days/weeks will be interesting to see which way it plays out.
This is my first post, I hope you find it interesting!

Bitcoin Monthly Chart — Fisher Transform Oscillator AnalysisThis chart displays the long-term monthly price evolution of Bitcoin alongside the Fisher Transform oscillator, highlighting key turning points and trend reversals from bear market lows.
Fisher Transform measures market cycles and helps visualize extreme conditions, with horizontal dashed lines marking typical reference levels near ±2.0.
By spotting these extreme negative values, long-term investors can use the Fisher Transform as a guide for systematic accumulation—gradually averaging in when the oscillator bottoms out and signals oversold conditions. This approach aligns with dollar-cost averaging and can help build a position ahead of subsequent bull runs, without relying on perfect market timing.

GBP/USD faces key test in week aheadWith the US government re-opening we are starting to see the flow of data, but question marks remain about the December rate decision. Fed's Williams said that the downside risks to employment have increased and that he’s open to near-term rate cut. UoM Consumer Expectations hit a record low. The US dollar weakened and stocks rebounded off the lows. That caused the GBP/USD to hold near 1.3100 resistance. But could it resume lower?
From the UK side, Chancellor Rachael Reeves will step up for the Autumn Budget Wednesday, and the pound is treading carefully. Gilts have been volatile and the pound has drifted lower as traders weigh up the government’s fiscal credibility. Reports that the government may ditch income tax increases have only amplified concerns over how a £30bn fiscal hole will be plugged. Reeves will need to deliver a convincing plan next Wednesday; if she doesn’t, UK assets could face a rough ride.
The pound has been struggling lately, with GBP/USD forming lower highs and lower lows. The pair has broken decisively below the 1.3140 support zone—a level that held in April and later formed a double bottom in July. An attempted recovery back above the area failed, reinforcing the bearish momentum.
With the trend now pointing lower, 1.3000 becomes the next obvious downside target, and a break beneath it could open the door to further weakness.
By Fawad Razaqzada, market analyst with FOREX.com

SPX - Hours Of Work To Buy 1 ShareHours of work needed to buy just one share of the S&P 500 just hit a new all-time high: 187 hours.
That’s:
150% more work than 2007
60% more than pre-COVID (2019)
10% more than “Liberation Day”
As I tell my kids:
Don’t look at the price tag.
Look at how many hours of your life — your blood, sweat, and effort — it takes to buy the thing.
Then decide if it’s actually worth it.
When the amount of work required keeps rising while what you get keeps shrinking, that’s not “innovation” or “AI magic.”
That’s over-speculation.
Buffett said it best:
Price is what you pay. VALUE is what you get.
Everyone screams about the price going up…
but nobody asks whether the VALUE justifies the hours of work required to own it.
That’s the truth — not the narratives.
THANK YOU for getting me to 5,000 followers! 🙏🔥
Let’s keep climbing.
If you enjoy the work:
👉 Boost
👉 Follow
👉 Drop a solid comment
Let’s push it to 6,000 and keep building a community grounded in truth, not hype.

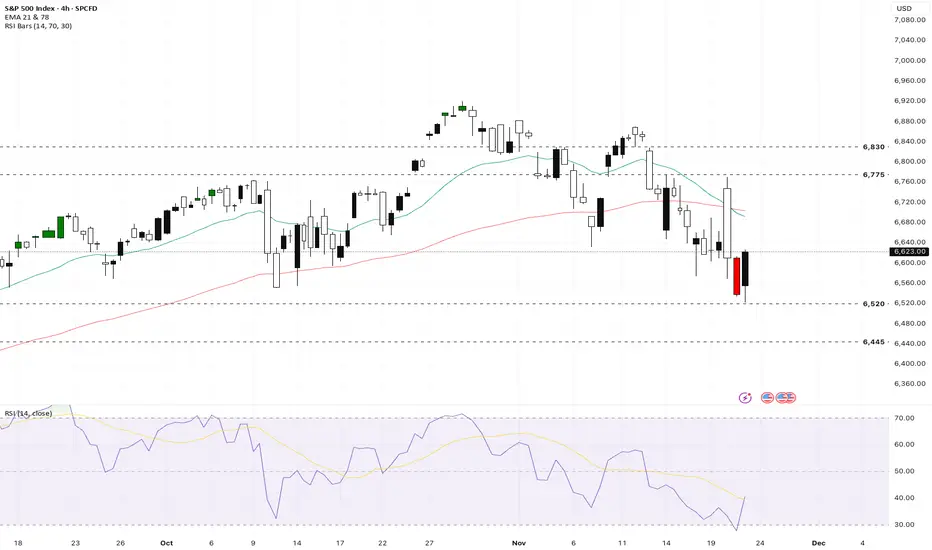
US500 remains under pressure as technology sector momentum coolsThe US500 moved lower after a volatile session marked by fading momentum in technology stocks and renewed macroeconomic uncertainty. Despite short-term weakness, the index remains up almost 10% year-on-year compared to this period in 2024.
Fundamental analysis
The US Federal Reserve policy is now in sharp focus, with remarks from policymakers supporting expectations for a possible interest rate cut in Dec, which is inspiring a slight rebound and giving traders hope for year-end support. Fed New York President Williams said the central bank has room to cut rates again soon as the labor market softens, which improved sentiment. Recent strong US earnings, including from key US 500 members, have offered some relief but have not reversed the current downward trend as AI-driven enthusiasm cools. Renewed fiscal uncertainties, increasing debt issuance, and mixed economic data have weighed on sentiment.
Technical analysis
The index charted a bearish engulfing candlestick below its EMA21, suggesting sellers still control price action in the short term. Key resistance is observed near 6775 and 6830, while immediate support is now at 6520 and a major support at 6445. The volatility index (VIX) jumped by nearly 12% to 26.42, signaling rising market stress and a defensive posture by portfolio managers. In a technical warning that sellers have seized control, charts show Thursday’s losses fully erased the previous session’s advance. The Bearish Engulfing pattern was unusually large and swift and echoed a similar setup in early Mar that preceded a 5% drop in the index. The US500 broke below both its EMA21 and EMA78, levels that many traders view as key lines of support.
Sentiment and outlook
A $5 tln slide in global equities has left investors questioning how much further the tech-led pullback can go. US stock futures swung between gains and losses in volatile trading amid a sustained retreat from the market’s riskier corners. However, seasonality is historically positive heading into Thanksgiving week, and many market participants expect a rebound into year-end, especially with the Fed likely leaning dovish and volatility peaking. Risk appetite remains subdued, but technical and macro catalysts point toward possible stabilization and recovery if central bank signals remain supportive.
Analysis is by Terence Hove, Senior Financial Markets Strategist at Exness
ETH Weekly Outlook: Critical Support – What Happens Next?📌 Scenario 1 — Bullish Rejection From Support → Break of Liquidity Zone
Price continues to pull back into the 2,500–2,650 support zone, which also aligns with previous structure and mitigation levels.
If buyers defend this area strongly:
Price forms a higher low inside the support zone.
Bullish momentum pushes ETH back above the broken trendline.
ETH targets the liquidity zone around 4,500–4,600.
A breakout and close above this level could lead to a strong continuation rally, sweeping previous highs.
Bias: Bullish continuation after correction.
📌 Scenario 2 — Deeper Sweep Into Major Support → Strong Reversal
If current support fails to hold:
ETH may dip deeper into the major support + imbalance zone (around 2,250–2,400).
This area contains a liquidity pool, meaning price may intentionally sweep it before reversing.
After the liquidity grab, a sharp bullish reaction is expected.
Price climbs back toward 3,000–3,200, retests structure, and then targets the 4,500–4,600 liquidity zone again.
Bias: Liquidity grab → Market structure shift → Strong bullish recovery.

XRP Bullish after 3 YearsXRP in consolidation. Once its breakout we may take entry for long.
For longer period investment you can buy some XRP now.

LYFT: The Hidden Gem in My October Top 3 PicksAs I’ve mentioned in my recent videos, LYFT is one of my top 3 priority stocks for October — and for good reason.
The fundamentals have exploded while the price is still lagging far behind.
🔸 Fundamentals
EPS growth has been massive .
– In March, EPS was up +128% YoY,
– and by June, it jumped to +234% YoY.
EPS has finally moved into positive territory , which is a strong signal.
Revenue continues to rise steadily, and EPS literally took off while the price hasn’t followed yet.
To put it in perspective — when LYFT traded around $60, EPS was negative .
Now, EPS is many times higher, but the stock still trades far below those levels.
Even emission has stopped increasing (we saw –0.25% in June 2025), and the forward P/E is only 15.3 ,
which is extremely low for this kind of EPS acceleration.
→ In short: LYFT looks deeply undervalued from a fundamental standpoint.
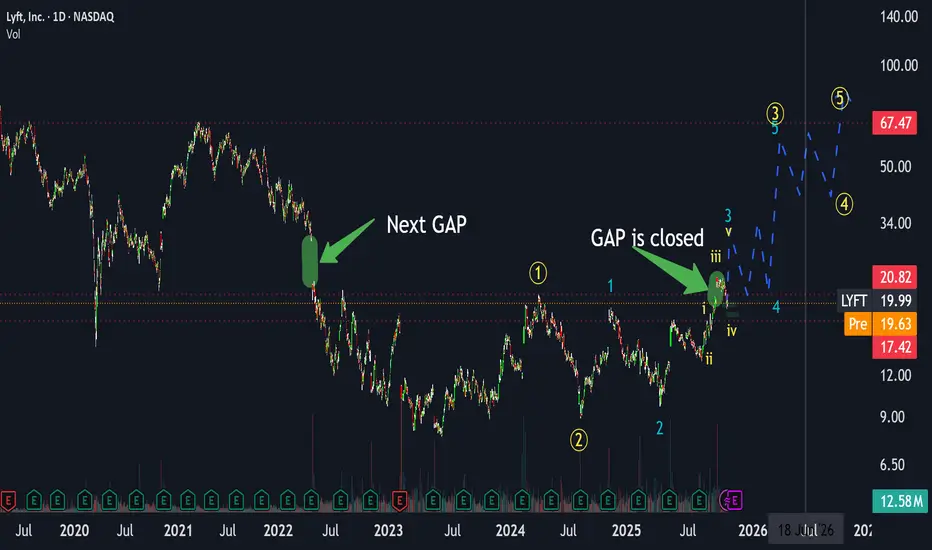
🔸 Technical Picture
Technically, LYFT has just closed a local gap , exactly as expected.
We are currently finishing the fourth sub-wave of the third global wave .
This means the fifth wave is coming next, and the current target around $70 represents only the peak of the third sub-wave — there is still additional upside expected beyond $70.
In the short term, we could see a retest around $18 ,
followed by the next major move — closing the May 2022 gap near $30 , forming the third wave of this cycle.
After that, some consolidation is likely in the $20–30 range,
followed by the next impulse targeting $50–70 .
This will be the fourth wave pullback, eventually leading into the fifth wave breakout above $70 ,
with potential for even higher upside as the global third wave continues.
Summary
Overall, LYFT shows a perfect mix of improving fundamentals and bullish technical structure.
As I’ve said in my latest videos, this stock could take off soon —
and it remains one of my Top 3 picks for October .
Call to Action
If you enjoy this type of analysis or would like me to review other tickers, tap on rocket 🚀 and leave a ticker in the comments .
I’ll make sure to cover your suggestions in upcoming posts soon!
(Full breakdown and context discussed in my recent videos — you can find them via my profile.)
CAD/JPY – Wedge Breakout Pattern (21.11.2025)📝 Setup Overview OANDA:CADJPY
CAD/JPY has broken below a rising wedge structure, signaling weakening bullish momentum. After multiple rejections at the resistance zone, price is now losing steam below the Ichimoku cloud, showing early bearish pressure.A clean breakout + retest scenario opens the door for downside continuation toward the next demand zones.
📌 Trading Plan📍 Entry Idea:
Look for bearish continuation below the wedge support + cloud rejection.
🎯 Targets (Support Levels):
1st Support: 111.022
2nd Support: 110.561
🛑 Resistance Zone:
112.014 – 112.294
This zone continues to act as a strong supply area where sellers took control repeatedly.
📉 Today’s Fundamentals – Bearish CAD Bias
1️⃣ Crude Oil Pullback → Weakens CAD
Canada’s economy is heavily tied to oil prices. Today’s dip in crude oil puts pressure on the CAD, giving JPY an advantage.
2️⃣ Safe-Haven Demand Supports JPY
With global markets showing risk-off sentiment (concerns over slowing global growth + uncertain central bank guidance), investors favor safe-haven currencies like the Japanese Yen.
3️⃣ BoC Policy Tone Still Cautious
Recent Bank of Canada communications show limited confidence in economic momentum.
Markets expect slower growth → bearish CAD outlook.
➡️ Combination of oil weakness + JPY strength + wedge breakdown = bearish continuation setup.
🔖 Hashtags
#CADJPY #ForexAnalysis #PriceAction #WedgeBreakout #Ichimoku #FXTrading #TechnicalAnalysis #FundamentalAnalysis #SmartMoney #TradingViewCommunity #Kabhi_TA_Trading
⚠️ Disclaimer
This analysis is for educational purposes only.
Not financial advice. Always manage your risk and trade based on your plan.
💬 Support the Work
If you found this analysis helpful, please LIKE & COMMENT on the post ❤️
Your support motivates more high-quality setups daily!

i don't know what i am doing i don't know what i am doing but looks very bullish by mid 2025 to late 2025 in shaa allah

Could the drop be over?Technical: The index is sitting around 22,078 points, dropping approximately 2.15%.
Fundamental: The decline is linked to a reversal of momentum after NVIDIA Corporation’s strong earnings; although the results were solid, the market interpreted that risks related to interest rates and valuations may still persist.
Key: Keep an eye on the upcoming Federal Reserve interest rate decision and the evolution of employment data, as the market remains sensitive to whether rate cuts will occur or not.

What's Happening or The Shadow of a Quantum Apocalypse💥 Birth of a Threat
Quantum Dawn and Shor's Algorithm
Quantum computers using the principles of superposition and entanglement are no longer science fiction. Major players like IBM and Google are actively working on creating machines capable of solving problems beyond the capabilities of classical supercomputers.
The main threat to the digital world, including the entire cryptocurrency industry, lies in Shor's algorithm.
Shor's Algorithm (1994)
Mathematician Peter Shor proved that a quantum computer can efficiently (in polynomial time) factorize large numbers and solve the discrete logarithm problem.
Vulnerability: The RSA and ECDSA cryptographic systems that underpin the public/private key security of most blockchains (including Bitcoin and Ethereum) will become useless. A public key revealed during the first transaction would allow a quantum computer to compute the private key almost instantly.
When Will "Q-Day" Happen?
Timelines for the emergence of a quantum computer capable of breaking widely used cryptographic schemes vary, but the trend points to an acceleration. This point has been dubbed "Q-Day" (the quantum equivalent of Y2K).
Probability Estimates:
A Global Risk Institute survey (2025) estimates a 22.7% chance of breaking RSA-2048 by 2030 and a 50% chance by 2035.
Expert Opinions:
Vitalik Buterin (November 2025) estimated the chance of Ethereum being hacked at 20% by 2028. The Cloud Security Alliance associates "Y2Q" with the date April 14, 2030. IBM plans to release the Nighthawk chip with over 2,000 logical qubits by 2029.
"Harvest Now, Decrypt Later" Strategy:
Recognizing the inevitability, intelligence agencies and attackers are already collecting encrypted traffic (including transactions) for subsequent hacking when quantum machines become available.
Cryptocurrency: The Perfect Victim and the Price of Inaction
Cryptocurrencies are an ideal target because many addresses contain funds associated with already compromised public keys.
Vulnerable Assets:
An estimated 25-30% of all Bitcoin (4-6.65 million coins), including Satoshi Nakamoto's funds, are held in vulnerable P2PK addresses.
Consequences:
Collapse of trust and asset losses exceeding $2.4 trillion (estimated for 2025) if timely migration is not implemented.
🛡️ Survivors: Cryptocurrencies that have adopted PQC
Blockchain's survival in the era of quantum computers depends on one key condition: abandoning vulnerable cryptographic primitives (RSA and ECDSA) and transitioning to post-quantum cryptography (PQC). PQC solutions (based on lattices, hash functions, or Winternitz OTS) are resistant to Shor's algorithm. The market for quantum-resistant (QR) cryptocurrencies is growing, offering ready-made solutions for hedging risks.
Leaders of the QR Resistance and Their Technologies:
Not all blockchains will give in. Since the 2010s, pioneers have been building "quantum-resistant" coins using lattice-based, hash-based, or Winternitz OTS schemes—they ignore Shor like a rock ignores waves. The QR crypto market is growing at 28.6% annually until 2034. Top 9 as of November 2025:
Zcash (ZEC): shielded pool on BLS12-381 + Groth16—fully quantum-resistant as early as 2022; NU7 (October 2025) added PQ signatures even for t-addresses. A ready-made "quantum safe" without migration.
Quantum Resistant Ledger (QRL): Fully XMSS/SPHINCS+ since 2018. PoS migration in Q1 2025; +33% growth in June. Ideal for a "Y2Q" hedge.
IOTA: Lattice + hash chain without ECDSA. IoT focus; resistant to NISQ computers.
Nervos Network: CKByte with PoW + QR scaling for dApps.
Algorand (ALGO): Falco/Dilithium in signatures; fast migration.
Hedera (HBAR): SPHINCS+ hash-based; enterprise focus.
Starknet: Poseidon hash (QR primitives); v0.14.0 in September 2025.
Ripple (XRP): Dilithium in 2025; for cross-border payments.
Cardano: Q-Index group; PQ wallets 2025–2026.
Internet Computer (ICP): ZK + lattice since 2021; Groth/Cerulli plans.
Major Networks in the Adaptation Process
Industry giants are forced to invest in PQC solutions:
Bitcoin (BTC): The community is developing BIP-360 (P2QRH), which proposes the implementation of hybrid signatures (a soft fork combining ECDSA and ML-DSA) to ensure gradual but mandatory migration.
Ethereum (ETH): The project is investing heavily in R&D ($32.6 million), testing Dilithium and STARKs through initiatives like EIP-7932.
Assets in Urgent Need of Migration:
Monero (XMR): Despite the high level of anonymity provided by Ring Signatures and Ring Confidential Transactions (RingCT), Monero uses ECDSA for its underlying transaction digital signatures. This makes it vulnerable to Shor's algorithm. A successful PQC migration will require a comprehensive upgrade to integrate post-quantum signatures without breaking existing cryptographic privacy primitives.
Dash (DASH): Like most altcoins, Dash uses ECDSA for transaction signing. While its InstantSend and PrivateSend features improve speed and coin mixing (CoinJoin), they do not provide quantum resistance. Dash will also face the need for a forced soft fork to implement hybrid PQC signatures to protect users' assets from future attacks.
Therefore, survival is guaranteed for those projects that are either initially built on a PQC foundation or successfully migrate, replacing ECDSA with NIST-standardized PQC algorithms.
Zcash: A Ready Bridge for Migration Today
Zcash is one of the migration leaders. Its shielded pool (z-addresses), implemented after the NU5 (2022) and Halo 2 updates, is already quantum-resistant (thanks to the BLS12-381 curve). This allows it to be used as a "quantum safe" to protect assets transferred across bridges.
🔄 Migration: Technological Inevitability and the Cost of Transition
The transition to post-quantum cryptography (PQC) is critical for the survival of blockchains. This task has become a priority not only for the crypto community but also for institutional players such as BlackRock, which manages large Bitcoin ETFs.
Standardization and Protocols
A central element of the migration is the standardization of PQC algorithms:
NIST Standards: The US National Institute of Standards and Technology (NIST) finalized key PQC algorithms (FIPS 203–205) in 2025. These include Kyber (for key exchange), Dilithium, and SPHINCS+ (for digital signatures).
Bitcoin (BIP-360): A soft fork of BIP-360 (Pay to Quantum Resistant Hash, P2QRH) is proposed to implement hybrid signatures (ECDSA + PQC, e.g., ML-DSA). This scheme ensures backward compatibility during the transition period.
Bitcoin Migration Phases (Lopp, 2025): The transition will be gradual and mandatory:
Phase A: Banning spending from the most vulnerable P2PKH/SH addresses; reserving block space for "rescue" transactions.
Phase B (2 years): Completely blocking spending via legacy ECDSA signatures. Assets in unmigrated addresses will be "burned" (QRAMP).
Phase C: BIP-39 Proof-of-Possession for final activation.
Process and Timing
Activation of such changes (e.g., via UASF/BIP9, like SegWit) is expected in 2025-2026. Ethereum is following a similar path with the EIP-7932/Dilithium testnets. Zcash, as mentioned, has already partially completed the migration.
However, the key challenge lies in manual migration:
Manual Work: Only wallets and exchanges can automate the process. Regular users will have to manually transfer their coins to new P2QRH addresses (e.g., bc1r...) or QR-resistant pools (e.g., Zcash z-addresses).
Grace Period: The expected grace period for transfers is 3-5 years (until 2026-2030). After this period, funds remaining in old addresses will become vulnerable or be locked.
Losses and the Cost of Inaction
The cost of inaction will be inevitable financial losses:
Loss Percentage: Deloitte estimates that 20-35% of the total Bitcoin supply (5-7 million coins, including Satoshi's holdings and long-lost coins) is held by addresses that will not be able to migrate or will not have time to do so.
Complete Crash: Low-liquidity or low-activity blockchains that fail to achieve consensus for migration may be completely wiped or frozen.
Migration is a complex technological soft fork that requires coordinated action from developers, exchanges, and users. Success guarantees the preservation of assets, while failure leads to their irreversible loss.
USDT and USDC: Stablecoins at the Forefront
Stablecoins are also vulnerable because they use ECDSA chains (Tron/Ethereum). Tether (USDT), with a market cap of $155 billion (2025), is actively migrating to Dilithium. However, USDC (Circle), which is regulated and actively adopting PQC standards (e.g., Algorand and Hedera), is positioned as a more stable leader in the post-quantum world.
🚀 The Endgame: A Hybrid Post-Quantum World
By 2030, Q-Day will likely strike, but by then the market will already be hybrid. Bitcoin will survive, but with losses; Zcash, QR, IOTA, and other QR-based cryptocurrencies will become beacons of security. The financial sector will rely on quantum-resistant stablecoins (USDC, XRP stablecoins). The success of migration will depend on user vigilance: if you don't migrate, you lose.

So What now ??Hey everyone,
let's cut the noise and talk seriously about where Bitcoin (BTC) is at right now.
For months, I've been saying what a lot of people didn't want to hear: the ideal trading range for BTC has to be somewhere in the $40,000 to $60,000 zone.
I got mocked, ignored, and even straight-up cursed out for saying that when the price was flying high. Everyone was chanting "$100k, $200k!" and acting like gravity didn't exist.
Well, look where we are now. BTC is roaming around $80-85k, a significant drop from those all-time highs.
The future feels... well, unknowable to those who only looked up.
But for those of us who kept one foot on the ground, this pullback isn't a shock; it's a return to a healthier balance.
🧐 Why the Fall Happened: No Magic Money Tree
The drop didn't come out of nowhere. It's a combination of simple market mechanics and shifting sentiment. Let's break down the three big reasons why the party ended:
1-The $100k+ Support Just Wasn't There:
Let's face it, sustained price action above $100k requires an insane amount of new, constant capital. The demand just couldn't keep pace with the towering valuation. When the buying dried up, the price had to correct to a level where new investors saw value again, or where old holders decided to take profits. The market ran out of steam, and the volume needed to hold those upper levels simply wasn't there.
2-Long-Term Holders Got Tired of Waiting:
You call them "Diamond Hands," but even the most dedicated long-term holders (LTHs) have a breaking point. After a massive run-up and then an extended period of stagnation at the top, many LTHs started thinking, "This is good enough." Taking profit after a multi-year hold is a natural part of the market cycle, and when enough big wallets decide to cash out, it creates a powerful selling pressure that crushes the price floor.
3-The Altcoin Allure:
The ETH Factor: As BTC got super expensive, the percentage return on a $1,000 price move started to feel insignificant. At $100k, a $1k move is just 1%. Meanwhile, competitors like Ethereum (ETH) offered a more appealing risk-to-reward ratio. When $1,000 means a 3-5% gain on a mid-level price, traders and even institutions start to migrate to where the potential for profit is mathematically greater. Traders are profit-driven, and ETH offered a more "profitable range" for active players.
🔮 What Now? The Balance of Waves
So, what's next? More brutal crashes? Unlikely. What we are likely entering is a period of choppy, sideways consolidation—a return to that healthy $40k–$60k range over time, or at least a deep, volatile consolidation between $60k and $85k as the dust settles.
This is the cycle: Euphoria leads to Correction, which leads to Consolidation.
The fall won't be a straight line. It will continue in waves—sometimes up, sometimes down. We'll see dead-cat bounces that trick new money into buying, followed by more downside.
The goal for the market now is to find a new balance between risk and profitability. This balance isn't found at the peak; it's found in the middle ground.
Why? Because the standard profitable range for retail and even whales is when smaller price differences still mean meaningful percentage gains.
Remember the Math:
At $100,000, a $1,000 move is 1%.
At $50,000, a $1,000 move is 2%.
At $30,000, a $1,000 move is ~3.3%.
The lower range offers a higher percentage return for the same absolute dollar change, making it a much more attractive area for accumulating or trading. The price needs to drop to where the perceived risk of a further fall is balanced by the reward of those higher percentage gains.
🧭 So What now ??:
Trade the Range, Ignore the Noise
The days of easy 10x returns might be on pause, but the opportunity for smart, methodical trading is back. We are entering a trader's market, not a HODLer's dreamland.
Stick to your charts, define your support and resistance, and trade the range, not the rumor. The market is giving us a second chance to accumulate at realistic prices. Don't waste it by listening to the ghosts of "$200k."
Good luck , Good hunt and Trade safe guys !

Native x402 Infra KITE listed on Coinbase Nov 3. It's shown relative strength since then and has developed its initial base w/ higher lows. It's an infrastructure play on x402 protocol as it's the only blockchain to have x402 running natively. If AI agents transacting is the near future, then KITE will be a huge beneficiary.
Backed by Coinbase Ventures, General Catalyst, Paypal Ventures, etc.

PANW Positioned to Pop?Palo Alto Networks is one of the most important companies in modern network and cloud security. As the digital world expands and AI-driven systems become central to business operations, corporations are investing heavily in cybersecurity to protect themselves from increasingly sophisticated threats.
Palo Alto works with major global names such as Amazon, Alphabet, Microsoft, Nvidia, and countless Fortune 500 companies. Around 75–80% of its revenue comes from recurring subscriptions, making its income highly predictable and sticky. Many customers are locked into 3–5 year contracts, and the company also secures multi-year deals with federal and military agencies. Fundamentally, Palo Alto remains one of the strongest cybersecurity companies in the sector.
Technical View
NASDAQ:PANW is currently trading inside a clear ascending channel and is now sitting near the lower boundary support of that channel. If this support holds, it could offer an attractive risk-reward opportunity.
However, for higher-probability confirmation, I would personally wait for:
- A bullish MACD crossover, and
- A recapture of the 200-day EMA, signaling a stronger trend reversal.
If those conditions align, Palo Alto looks like a compelling long-term buy in an AI-driven economy where cybersecurity is becoming non-negotiable.

BTCUUSD - Market outlookThere was another round of market chatter about quantum computers cracking Bitcoin this week, the kind of discussion that usually gets going when BTC is on sale and someone tries to tie price uncertainty to pressuring narrative, but this time Adam Back stepped in and shut the whole narrative down with a single explanation that may have took the tension out of the room for some.

Reliance Looking Good...Buy REL at current level and all dips
Target1 - 3000
Target2 - 3200
Target3 - 3627 (if close above 3210)
Disclaimer :-
I am not SEBI registered. The information provided here is for education purposes only.
I will not be responsible for any of your profit/loss with this channel suggestions.
Consult your financial advisor before taking any decisions
