XNG ( Natural Gas)⚡ Natural Gas Showing Stronger Short-Term Potential Than WTI! 🌿
While crude oil (WTI) is struggling to find firm direction, Natural Gas is heating up with renewed momentum.
✅ Weather shifts are boosting short-term demand.
✅ Technical structure looks cleaner with higher lows forming.
✅ Fundamentals favor gas — seasonal consumption is rising while supply remains tight.
Meanwhile, WTI is consolidating under resistance, showing less conviction from buyers.
📊 Short-Term View:
👉 Natural Gas — Bullish Bias
👉 WTI Crude — Neutral
Energy markets often move together, but this time Natural Gas looks ready to lead the way. 🔥
#NaturalGas #WTI #Commodities #EnergyMarkets #TradingView #BullishSetup #GasVsOil #ShortTermTrade
Fundamental Analysis

XAUUSD 🟡 Gold Market Update | XAUUSD Outlook [
Gold is currently trading around 4040, showing strong signs of bearish momentum as traders continue to lock in profits after the recent rally.
From a fundamental perspective, gold remains under pressure as major institutions and banks appear to be taking profits, suggesting that the upside momentum could be losing steam.
If this selling pressure continues, we could see further downside moves toward the following key support targets:
3965
3905
3850
3800
3650 and below
Technical Bias: Bearish
Fundamental Bias: Bearish
Trading Plan: Watching for lower highs and potential breakdown confirmations on the 4H and Daily charts.
📉 A break below 3965 could accelerate the bearish move toward deeper support levels.
RISK : This is Not investment Advice

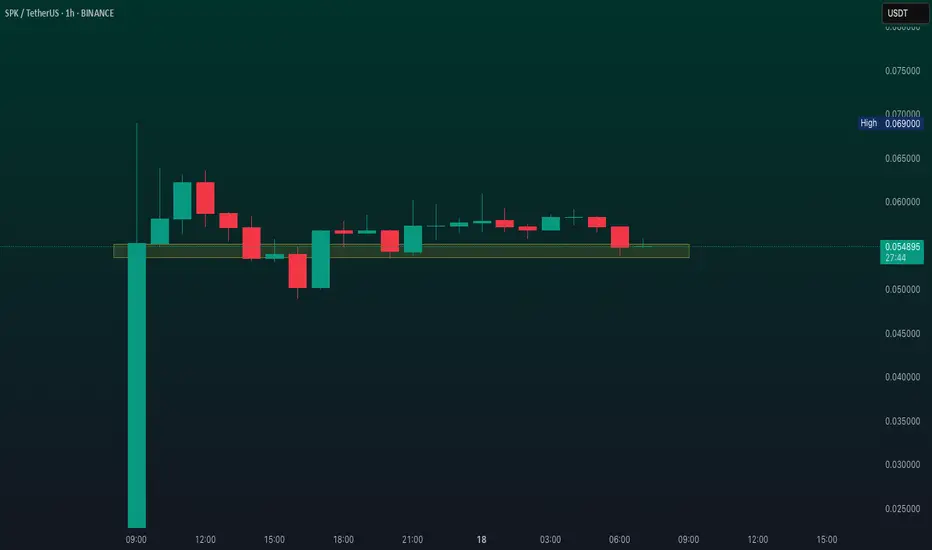
What Happened to SPK?SPK’s Binance HODLer airdrop distributed 200M tokens (2% of total supply) to users who staked BNB between June 10–14. Recipients immediately sold ~300M SPK ($18M at peak prices), overwhelming demand. With 17% of supply circulating at launch, the sell-off triggered a liquidity crisis on exchanges like Bybit, where order books lacked depth to cushion the drop. This mirrors historical airdrop failures (Arbitrum, Starknet), where tokenomics prioritized short-term rewards over sustainable demand 👀
BTC: 112k caps, 108.5k–106.5k defends__________________________________________________________________________________
Market Overview
__________________________________________________________________________________
BTC trades in a range with a bearish intraday tilt, while 12H/1D remain constructive. ETF outflows and a risk-off tone still cap sustained upside.
Momentum: 📉 Bearish within a 112k–106k range; rebounds capped below the 111.9k–112.2k flip.
Key levels:
• Resistances (4H/12H/1D): 111,900–112,200 (flip), 115,500–116,030 (HTF supply), 120,800–121,000 (1D/2D cap).
• Supports (12H/4H/1H): 108,482 (12H pivot), 106,050–106,500 (Cluster A 30m/4H), 102,530–102,790 (Cluster C 1H/2H/12H).
Volumes: Overall normal; very high prints at the recent 15m low — more “flush” than fresh catalyst.
Multi-timeframe signals: 1D/12H up; 6H/4H/2H/1H/30m/15m down — bearish confluence below 112k; key supports at 108.5k then 106.05–106.50k.
Risk On / Risk Off Indicator context: NEUTRE VENTE — it contradicts HTF momentum and argues for caution until 112k is reclaimed.
__________________________________________________________________________________
Trading Playbook
__________________________________________________________________________________
Strategic stance: range with intraday pressure — favor reactive entries at HTF floors, avoid chasing.
Global bias: NEUTRE VENTE near current prices; tactical invalidation on firm acceptance > 111,972 with volume.
Opportunities:
• Buy: confirmed reaction at 108,482 or 106,050–106,500; target 111,972 then 113.5–115.5k.
• Breakout buy: acceptance > 111,972 with volume; target 115.5–116.0k, stretch 120.8–121.0k.
• Tactical sell: rejection at 111,900–112,200 or 115.5–116.0k, aiming 108.5k then 106.5k/106.05k.
Risk zones / invalidations: Clean break < 106,048 opens 104.59/103.66 then 102.53–102.79; acceptance > 112k opens 115.5–116k.
Macro catalysts (Twitter, Perplexity, news):
• Fed to end QT on Dec 1 → liquidity tailwind, timing uncertain.
• Spot BTC ETF outflows → near-term headwind for trends.
• LTH distribution; STH cost basis near ~113k → rallies capped below 112–113k.
Action plan:
• Long (reactive): Entry: 108.6k (12H/2H confirmation) or ~106.3k (Cluster A) / Stop: below floor / TP1: 111,972, TP2: 113.5k, TP3: 115.5k / R:R ≈ 1:2–1:3.
• Short (tactical): Entry: rejection 111.9–112.2k / Stop: above the rejected band / TP1: 108.5k, TP2: 106.5k, TP3: 106.05k / R:R ≈ 1:2.
__________________________________________________________________________________
Multi-Timeframe Insights
__________________________________________________________________________________
HTFs (12H/1D) support buy-the-dip, while intraday frames remain bearish below 112k.
1D/12H: Uptrend but range-bound 112k–106k; 108,482 holds as pivot; acceptance above 111,972 opens 115.5–116.0k.
6H/4H/2H/1H/30m/15m: Lower highs persist; repeated failures at 111.9–112.2k; watch for a sweep into 106,050–106,500 if 108,482 fails. The tight 102,53–102,79 cluster is a magnet if pressure extends.
Major confluences: The 111.9–112.2k flip governs any relief; 106.05–106.50k concentrates multiple floors (30m/4H), with depth at 102.53–102.79.
__________________________________________________________________________________
Macro & On-Chain Drivers
__________________________________________________________________________________
Macro liquidity is set to improve, but crypto-specific flows remain hesitant — fostering two-way volatility inside the range.
Macro events: Fed ending QT on Dec 1 (liquidity positive); calmer European rates backdrop; managers heavily long risk with abundant cash sidelined — selective deployment.
Bitcoin analysis: Recent spot BTC ETF outflows weigh on upside attempts; pivot near 108.6k, with sub-106k flush risk if 108.5k gives way.
On-chain data: Elevated LTH distribution; STH cost basis near ~113k — a tactical lid until reclaimed.
Expected impact: Risk-off flows support a cautious bias below 112k; strong reactions at HTF floors can still spark relief.
__________________________________________________________________________________
Key Takeaways
__________________________________________________________________________________
Range-bound with a bearish intraday skew.
- Overall trend: neutral-to-bearish short term; turns constructive only above 112k with volume.
- Most relevant setup: reactive buys at 108.5k or 106.05–106.50k with confirmation; or tactical sells on 111.9–112.2k rejection.
- One macro driver: QT ends in December, but ETF outflows remain a headwind.
Stay disciplined: let levels lead, react to holds/breaks — don’t pre-empt. ⚠️

Can Short-Term Holders Rescue Ethereum From a Drop to $3,500?At the time of writing, Ethereum is trading at $3,846, holding just above the $3,802 support level. The altcoin king is likely to remain rangebound as market conditions show limited volatility.
Ethereum’s price currently fluctuates between $4,154 and $3,802. This consolidation range could persist in the coming sessions, with ETH possibly retesting resistance if short-term momentum returns.
However, if bearish conditions intensify and Ethereum loses the $3,802 support, a further drop could follow. A breakdown below this level may send the price under $3,742 and toward $3,500, invalidating the bullish thesis and signaling deeper market weakness ahead.

Mullen Group Ltd. (TSX: MTL) - Swing Trade💰 MTL — Swing Trade Breakdown
🏢 Company Snapshot
Mullen Group Ltd. (TSX: MTL) is a Canada-based logistics and trucking services company with operations across Canada and the U.S., covering less-than-truckload (LTL), warehousing & logistics, specialized services, and international freight. It’s attracting attention due to its moderate valuation, attractive monthly dividend, and potential swing-trade opportunity as the freight/transportation sector hints at recovery.
📊 Fundamentals
P/E: ~13.6× (slightly undervalued vs peers)
P/B: ~1.2× (modest book multiple)
Debt/Equity: ~1.17 (moderate leverage)
ROE: ~9.9% (lower than peers)
Dividend Yield: ~5.8% (appealing income component)
Free Cash Flow: Positive, modestly improving
Cash on Hand: Provides short-term flexibility
Summary: Balanced fundamentals — moderate valuation, decent dividend, but profitability is weak and debt is non-trivial.
📈 Trends & Catalysts
Revenue Growth: ~5.5% YoY
EPS Trend: Slightly declining year-over-year
Cash Flow Trend: Positive and improving
Balance Sheet: Moderate debt, adequate cash reserves
Catalysts: Potential rebound in freight demand, high dividend yield, possible growth through acquisitions
Risks: Rising fuel and regulatory costs, margin pressure, competitive market, leverage risk
🪙 Industry Overview
Weekly: Slightly down, short-term softness in freight demand
Monthly: Moderate uptrend, signals of capacity tightening
12-Month: Underperforming broader market, freight cycle correction and cost pressures
Industry commentary: Canadian trucking faces rising costs, driver shortages, and regulatory challenges, but gradual stabilization or recovery is possible.
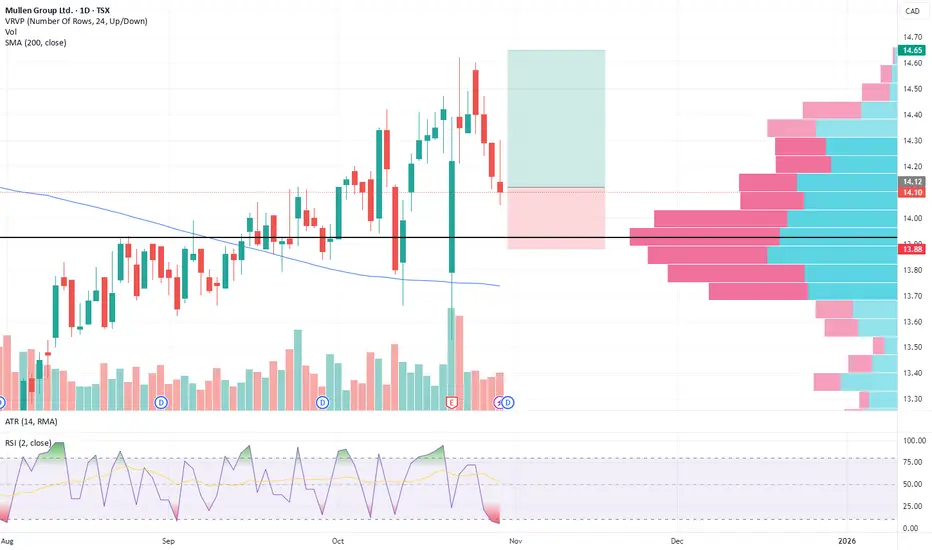
📐 Technicals
Price: ~CAD 14.10
50-SMA: ~CAD 13.89 (current price above)
200-SMA: ~CAD 13.76 (long-term trend confirmation)
RSI(2): 4.9
Pattern: Consolidation around moving averages
Support: CAD 13.00–13.50
Resistance: CAD 15.50–16.00
Volume: Average, no breakout yet
🎯 Trade Plan
Entry Zone: CAD 13.30–14.00 (near support or pullback)
Stop Loss: CAD 12.80 (below key support)
Target: CAD 16.00 (next resistance / swing target)
Risk/Reward: ~2×
Alternate Setup: Breakout above CAD 16.00 could target CAD 18.00
🧠 My Take
MTL presents a moderate bullish swing-trade opportunity. Fundamentals are balanced with an attractive dividend, but profitability is low and debt is moderate. Technically, it’s consolidating, so I’d look for a pullback to support or a strong breakout above CAD 15.50 before entering. The 1:2 R/R swing setup is favorable if executed near key levels.
Gold (XAUUSD) Intraday Trade Plan
Analyzing the XAUUSD 4-hour chart for a potential fast scalp setup. Key levels are in focus, with a buy zone identified around 3,975. The trade plan highlights the importance of being cautious of external catalysts, specifically noting "TRUMP twit" as a potential source of volatility. Discipline in risk management is key when trading around such high-impact zones. #GoldTrading #XAUUSD #ForexAnalysis #TradingSetup #RiskManagement

EURGBP 31.10.2025+ CB (ECB: held, no cuts in the near term; BoE: the rhetoric and data suggest cuts are coming—just at a slower pace.)
+ EU GDP Beat; DE CPI Beat
- UK Budget, stagflation risks

NZDUSD 31.10.2025+ Fed-RBNZ policy divergence (Fresh update: Fed cut 0.25, but not sure when to cut again and if to cut at all, super data-dependent)
~+ CN NBS Mfg PMI Miss

AUDNZD 28.10.2025~+ RBA-RBNZ divergence
~+ AU data beat (recent S&P Serv&Mfg, expected and released AU CPI Beat)

AUDJPY 27.10.2025* Risk-on on a possible deal between Trump with XI
* New JP PM is pro-stimulus
~+ BoJ isn't sure when to hike again

XAUUSD 27.10.2025* Bullish Narrative about gold is still in play, but the move needs some technical correction
* Shift to risk-on around due to the US gvt shutdown ending and a possible meeting Trump with Xi - good trigger for a technical-based trade

EURUSD 24.10.2025+ EU Data Beat, US CPI Miss
~+ ECB doesn't see the need to cut soon
* Seems like dollar positioning is still stretched to the downside

Nikkei225 23.10.2025~+ New PM is pro stimulus
~+ BoJ held; isn't sure when to hike; more data needed
~+ Expected meeting of Trump with Xi Jinping (risk-on)

Gold (XAU/USD) Technical AnalysisGold (XAU/USD) Technical Analysis – Potential Rebound Toward Key Resistance Zone
On the 1H timeframe, Gold (XAU/USD) shows signs of a short-term recovery after a period of consolidation near the $4,000 psychological support. Price action has formed a higher low, hinting at potential bullish momentum building up in the short term.
Currently, the market is attempting to recover from the recent dip, and the next upside target lies around the $4,080 – $4,100 resistance zone, where previous supply and structural rejection occurred. This area also aligns with the 38.2% Fibonacci retracement of the recent downward swing, making it a critical level to monitor.
Key Levels to Watch
Resistance: $4,080 – $4,100 (short-term supply zone)
Support: $3,980 – $3,950 (recent swing low area)
Trading Plan
Scenario 1 – Buy on pullback:
If price holds above $3,980 and confirms a higher low, traders may consider buying toward the $4,080–$4,100 zone.
Scenario 2 – Rejection at resistance:
Should price face strong selling pressure at $4,100, it could trigger another correction back toward $3,950. Watch for bearish signals before shorting.
Technical Outlook
Overall, Gold remains in a corrective phase within a broader downtrend. Short-term buyers may drive a recovery toward $4,100 before stronger sellers re-enter the market. A clean breakout above $4,100 could shift intraday sentiment to bullish.

BTCUSDT — Full Report (Oct 31, 2025 09:30 UTC)1. Macro and Fundamental Facts
- US Fed (Oct 30): Rate cut by 25 bps to 3.75–4.00%. This policy easing supports risk assets.
- Quantitative Tightening: From Dec 1 the balance sheet runoff stops; the Fed will reinvest, increasing dollar liquidity.
- US GDP Q3 (preliminary): +3.1% QoQ, confirming a soft landing.
- PCE Inflation (Oct 31, 12:30 UTC): Expected moderate growth; may cause short-term volatility.
- BTC ETFs (US): Mixed flows; after mid-month outflows, moderate inflows observed (Farside). Institutional demand remains stable.
2. Market Statistics (CoinGecko, weekly)
- 7-day range: $108,604–$115,957
- Today's 24h range: $108,201–$113,567
- Mid-point: $112,280
- Range / mid ≈ 6.55%
- October ATH: $126,080 (Oct 6)
- Market has stabilized after the early-October peak around 125‑126k.
3. Sentiment & Forecasts
- Fear & Greed Index: 37 (Fear) → cautious mood.
- Polymarket probabilities for 2025: ≥$130k ≈53%, ≥$150k ≈15%, ≤$80k ≈10%; market volume ≈$38M.
- Social tone: discussion of Fed easing and a possible retest of the ATH.
4. Key Levels This Week
- Support S1: $108.0–$108.6k (lower bound of the 7-day range)
- Support S2: $106–$107k (October accumulation zones)
- Resistance R1: $113–$116k (upper bound of the 7-day range)
- Resistance R2: $118–$120k (gateway to retest $125k).
5. Microstructure (SSE, Binance BTCUSDT)
Snapshot time: 2025-10-31 08:57:51 UTC (real-time SSE feed; delay ~80 ms).
- Last price (LTP): $110,043.82
- Bid / Ask: $110,043.81 / $110,043.82 → balanced.
- Spread: $0.01 ≈ 0.91 m-bps (ultra tight).
- Bid sum (top-20): 0.46 BTC → thin support below.
- Ask sum (top-20): 11.55 BTC → dense overhead layer.
- Imbalance: −0.923 → seller dominance.
- Orders per second: 46 orders/s → active flow.
- Net flow: +0.58 → orders coming into the market; buyers active.
- Micro-price: $110,043.81 ≈ mid → neutral.
- Health score: 80/100 → good liquidity.
Observation: there is instant dominance in the ask side. Order flow is positive, but for price to rise, the cluster at $110,043–110,045 (~5 BTC) must be absorbed. The book below is thin; a downward spike could drop $30–50 without much resistance.
6. Probability Assessment (1-week horizon)
Model: normal distribution around the mid ($112,280) with σ ≈1.64%.
- Range scenario ($109–$114k): ≈60%
- Upward scenario (> $116k; requires inflows): ≈12%
- Downward scenario (< $108.5k; reaction to inflation or ETF outflows): ≈12%
- Tail events (<$106k or >$120k): ≈4–6% each.
Microstructure indicates ask-side dominance, so a short-term pullback within the range is slightly more likely than an immediate breakout.
7. Practical Observations (no advice)
- Spread <1 m-bps → optimal conditions for limit orders.
- Rise in orders/sec above 50 with imbalance moving toward zero → market ready for an impulse.
- Spread >3 m-bps → decreasing depth and higher liquidity risk premium.
- Monitor FGI and ETF flows: FGI >40 and two days of ETF inflows often coincide with a break out of the range.
- Watch Polymarket: an increase in the ≥$150k probability above 20% signals stronger long-term optimism.
8. TL;DR
- The Fed eased policy (−25 bps; QT stop from Dec 1).
- BTC trades between $108.6k and $116k; mid ≈$112k.
- Sentiment is cautious (Fear 37).
- Microstructure: LTP $110,043.82; spread $0.01; ask dominance (imbalance −0.92); 46 orders/s; net flow +0.58.
- Probabilities for the next week: range 60%, upside 12%, downside 12%, tails 4–6%.
- Conclusion: the market is stable within the range; the macro backdrop is softening. A breakout requires absorption of ask clusters and confirmation from ETF inflows.

Supreme Court Limits Retroactive Deductions, IBEX Giants on AlerBy Ion Jauregui – Analyst at ActivTrades
The Spanish Supreme Court has set a significant precedent by preventing companies from deducting expenses corresponding to already prescribed fiscal years, restricting the possibility of making retroactive tax adjustments. The ruling, issued on October 7, establishes that expenses recorded outside their natural fiscal period cannot alter the taxable base of closed years, even under the principle of full regularization.
This decision, originating from a dispute between a company and the Spanish Tax Agency, clarifies that only expenses properly recorded in their corresponding fiscal year can be deducted for Corporate Income Tax purposes. Otherwise, such amounts must be charged directly to net equity, without affecting the accounting or tax results of the current year.
The impact of this ruling particularly affects large IBEX 35 companies with complex financial structures or long-term assets. Construction and infrastructure companies such as ACS, Ferrovial, Sacyr, and Acciona may be most exposed, as they often manage multi-year contracts, concessions, and disputes involving retroactive economic adjustments.
Likewise, energy and utility companies — Iberdrola, Endesa, Naturgy, Repsol — manage multi-million euro provisions for regulatory compensations or tax disputes, which could be non-deductible if identified after the prescription period. In the financial sector, banks and insurers such as Santander, BBVA, CaixaBank, and Mapfre may also face limitations when adjusting provisions or impairments from previous years.
The ruling reinforces the importance of accounting prudence and timing in expense recognition, noting that the tax authorities can review negative tax bases up to ten years back, but deductions only affect the last four non-prescribed fiscal years.
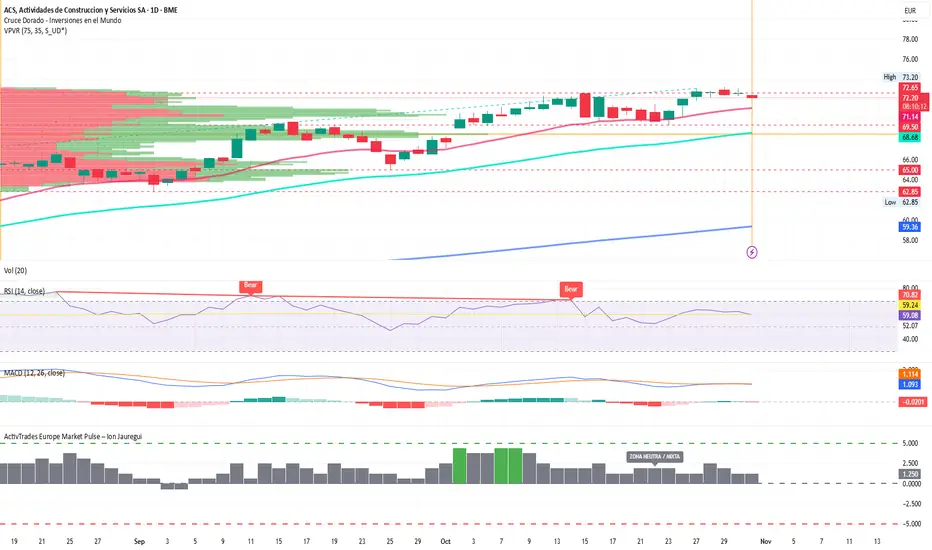
Technical Analysis of ACS
ACS shares closed yesterday at €72.60, slightly down for the week after reaching an all-time high of €73.20. The daily chart confirms a solid bullish structure in both medium and long term, supported by an ascending trendline initiated in January 2024. The 50-, 100-, and 200-day moving averages remain aligned upwards, reinforcing the consistency of the trend.
In the short term, the stock shows a phase of lateral consolidation around the October 15 price range, seeking momentum to reach its next technical target of €75, which aligns with the projection of the ascending channel. It will be crucial to monitor whether the buying momentum holds, as the stock could pause before breaking resistance.
Key support levels are at €69.50, €65, and €62.85, zones where the stock has historically reacted positively. A break below these levels could trigger a deeper correction toward the €60 area.
The RSI, currently at 61.6, indicates a mild healthy overbought condition, consistent with trend continuation, while the MACD remains in a positive lateral phase, showing no bearish divergence. The Point of Control (POC) of the volume profile is at €68.50, acting as dynamic support, with a secondary congestion zone around €71, where recent trading activity has concentrated.
According to the ActivTrades Europe Market Pulse, market risk has normalized toward neutral levels, indicating a balance between supply and demand following the recent bullish impulse.
In conclusion, ACS maintains a structurally strong bullish trend, supported by solid technical foundations and sustained buying flow. However, in the short term, it may undergo a phase of consolidation before attempting to surpass the €75 resistance, which would confirm the continuation of its long-term upward momentum.
In the context of the recent Supreme Court ruling limiting deductions for prescribed fiscal years, a higher degree of accounting prudence is expected among IBEX 35 giants. This new framework could temporarily moderate margin evolution — especially in the infrastructure sector — favoring lateral or technical adjustment behavior in stocks like ACS, despite the structural strength of its primary trend.
*******************************************************************************************
The information provided does not constitute investment research. The material has not been prepared in accordance with the legal requirements designed to promote the independence of investment research and such should be considered a marketing communication.
All information has been prepared by ActivTrades ("AT"). The information does not contain a record of AT's prices, or an offer of or solicitation for a transaction in any financial instrument. No representation or warranty is given as to the accuracy or completeness of this information.
Any material provided does not have regard to the specific investment objective and financial situation of any person who may receive it. Past performance and forecasting are not a synonym of a reliable indicator of future performance. AT provides an execution-only service. Consequently, any person acting on the information provided does so at their own risk. Political risk is unpredictable. Central bank actions can vary. Platform tools do not guarantee success.
USD/JPY Technical OutlookUSD/JPY Technical Outlook – Bearish Pressure Remains Dominant
On the 1H timeframe, USD/JPY continues to respect the descending trendline that has been guiding price action since mid-October. Every test of this structure has resulted in a clear rejection, confirming ongoing selling momentum.
Currently, price is consolidating below 0.00648, showing weak bullish reaction after a strong impulsive drop. The EMA curve (purple line) acts as dynamic resistance, aligning closely with the descending trendline — a confluence zone that traders should watch carefully.
Key Levels
Resistance: 0.00649 – 0.00652 (trendline & EMA rejection zone)
Support: 0.00645 – 0.00643 (previous low and liquidity zone)
Trading Strategy
Scenario 1 – Sell on pullback:
If price retests the 0.00649–0.00652 resistance zone and fails to close above the trendline, short entries may be considered with a target at 0.00645, extended towards 0.00643.
Scenario 2 – Breakout confirmation:
A clear break and close above 0.00652 (with volume) could invalidate the short bias, opening the door for a corrective move toward 0.00658.
Technical Bias
The market structure remains bearish with lower highs and lower lows intact. As long as price stays under the descending trendline, the probability favors continuation to the downside.
📈 Remember to follow for more daily insights and advanced trading strategies.
Save this analysis if you find it useful for your setup planning.

Fast Scalp on Gold
Executed a fast scalp on OANDA:XAUUSD , catching a nice move for a 15% return on margin. The 5-minute chart provided the perfect setup. #DayTrading #XAUUSD #Finance #Profit

Buy and HOLD OBOL for minimum $2.0 priceHello,
Obol go to $0.18 and 0.30$ very soon and very fast.
Just hold and increase your tokens during the fluctuations.
Thank you

StevenTrading - XAUUSD: Prioritize Buying – Leverage New...StevenTrading - XAUUSD: Prioritize Buying – Leverage New Bullish Structure and Await FED/Trade
Hello everyone, StevenTrading is back with a detailed Gold strategy!
Gold is currently restrained due to the reduced expectations of a Fed rate cut in December and optimism in US-China trade.
Nevertheless, the gold scenario is on a bullish structure, and we prioritize buying higher positions according to Fibonacci.
Macroeconomic factors such as the Fed meeting and high-level trade talks will drive XAU/USD action.
📰 MACRO ANALYSIS & SENTIMENT
Pressure 🔴: Gold prices have undergone a deep correction after opening higher in the week.
The US dollar index hovers around $99.50$ due to uncertainty surrounding the Fed's policy outlook.
Technical Outlook: The current technical outlook highlights a loss of short-term bullish momentum.
However, the bullish structure remains intact (refer to image_1df12a.png).
📊 TECHNICAL ANALYSIS & BUY PLAN
Priority: Buy higher positions according to Fibonacci.
Strategic Sell Rhythm: The sell rhythm will be at Fibonacci and previous support around $4059$.
🎯 DETAILED TRADING PLAN
We have a primary BUY scenario and a scalping SELL at resistance:
🟢 Primary BUY ScenarioLogic: Look to buy at liquidity and support zones.
Entry (BUY): $3960 - 3960$ (Support/Fibonacci Zone)
SL: $3954$
TP1/TP2: $3975$ | $3998 FWB:TP3 : $4020$
🔴 Scalping SELL Scenario
Logic: Look to sell at Fibonacci and previous support zone around $4059$.
Entry (SELL): $4058 - 4060$
SL: $4065$
TP1/TP2: $4033$ | $4018$TP3/TP4: $4000$ | $3978$
📌 SUMMARY & DISCIPLINE
Despite the short-term loss of momentum, the bullish structure remains prioritized.
Important: FED and trade uncertainties will create volatility.
Capital management discipline and adherence to SL are key.Do you agree with this buying strategy? Comment and follow!

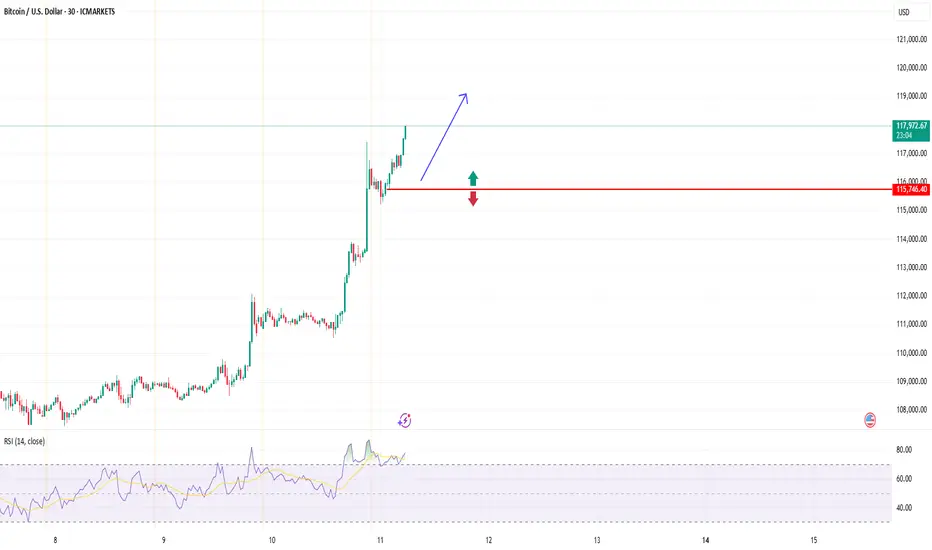
BTCUSD (Bitcoin): Forex Technical AnalysisDate: 11 July 2025
Momentum: Up
First Scenario : long positions above 115,706.14 with targets at 117,269.52, 117,904.51 and 118,513.05
Second Scenario : short positions below 115,706.14 with targets at 114,544.35, 113,774.89 and 113,053.39
Comment: RSI - Bullish.
Supports and resistances :
118,513.05 **
117,904.51 *
117,269.52
116,747.25 - Last price
114,544.35
113,774.89 *
113,053.39 **
Follow Up on Projected 400Pips on EURUSDPrice is running smoothly to the Bearish side as expected from our Earlier Projection. Now, here is a potential scenario to expect.
The Market being in an established Bearish state from the Intra weekly chart, it only makes sense to follow up on the Running trend.
Looking at the Intra day on 4Htf, we should expect another pullback to the 1.1600-1.1615 zone where we can prepare to add more positions from to aim for 1.1490 for a comfortable 1:4.5 Risk2Reward with StopLoss around 1.1630 and subsequently anticipate for the Last Target zones at 1.1470- 1.1395
Trade safe, Risk Responsibly
Patience is the Way! Ieios
