UBERAttractive P/E, popular stock, increasing revenue, well known brand - Looks like a solid medium term stock (12 months). Looking to buy calls / stock below $97.
Education purpose only, not a trade recommendation.
Gann

REVOX – Bullish Harmonic Setup in Play!
The weekly chart on REVOX/USDT shows a clean AB=CD harmonic pattern targeting a strong upside move.
📈 Current Price: $0.0649 (+19.62%)
🅰️ ➝ 🅱️ ➝ 🅲️ ➝ 🅳 sequence aligning perfectly
📦 Retest Zone: $0.0500–$0.0550
✅ Structure holding above resistance-turned-support
🎯 Target:
🥇 $0.1144 (Projected D leg – +76% potential)
⚠️ Watching for C-leg retrace entry before final push up
#REVOX #HarmonicPattern #CryptoSignals #AltcoinSetup #TradingView

DOT Breakout Incoming – Get Ready!
CRYPTOCAP:DOT Polkadot is showing early signs of a reversal from its long accumulation phase. After months of sideways action, the chart is hinting at a major upside move! 🧠📈
Targets to watch:
🎯 $8.54
🎯 $11.73
🎯 $14.41
This could be the start of a powerful rally. DOT is looking explosive! 💣

The sweetest goldmine of them all FY2 PE 2Like this one. Within 2 years time they will be able to:
- one positive Earnings
- double tonnage
- triple production
- quadruple revenue
- five to 10 fold profits (earnings growth to the moon)

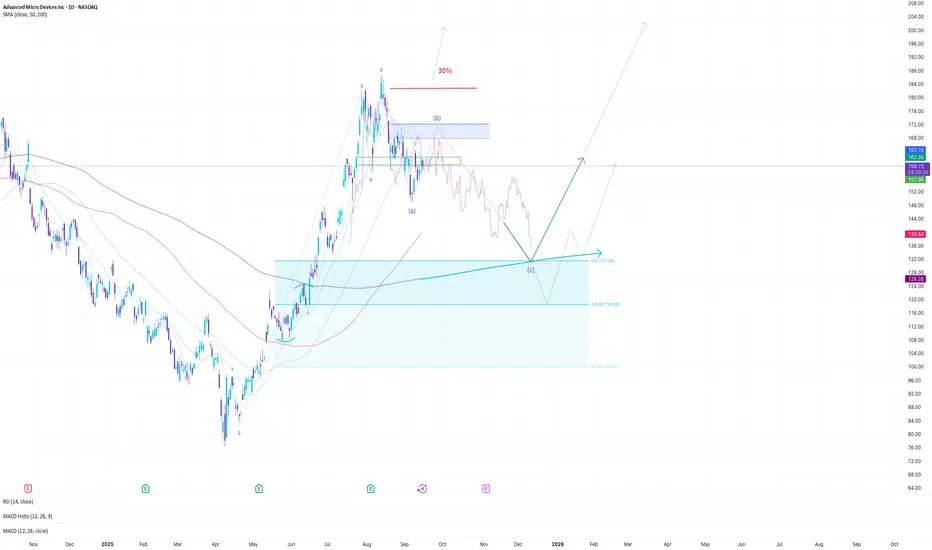
AMD Corrective - possible buy pointAt AMD, I currently see two possible scenarios:
1. The five-wave structure is not yet complete, and the stock could push above the current high. However, I consider this scenario less likely.
2. We are currently forming wave B of a correction. In this case, the stock should at least correct down to around $131, where both the 200-day moving average and the 0.5 Fibonacci retracement of the recent upward move are located.
In the following upward move, a target range of $250–$300 looks realistic.
hypeusdtHype analysis, waiting for a correction to enter a buy.
HypeUSD has risen that high, waiting for a correction.
The whale is looking to dump its goods.
Let's just wait and see if there will be a correction.

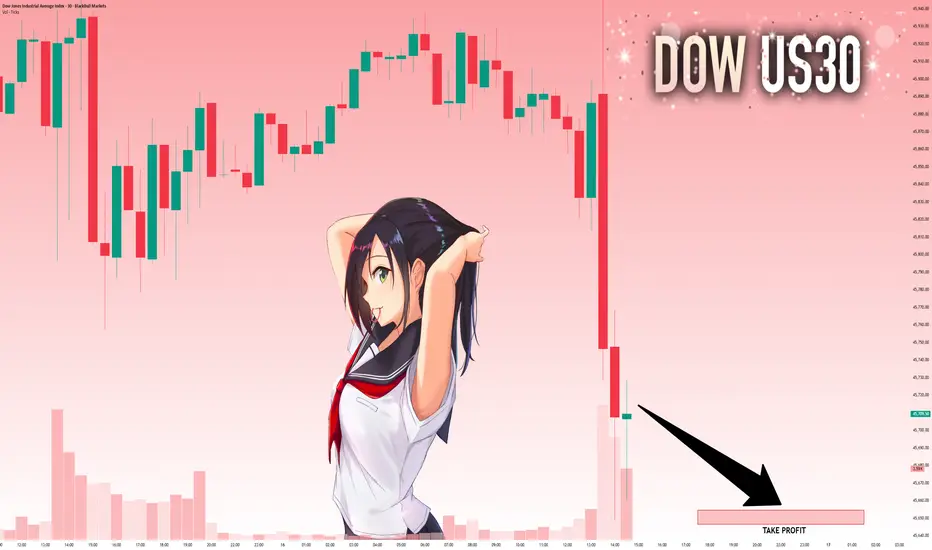
US30: Will Go Down! Short!
My dear friends,
Today we will analyse US30 together☺️
The recent price action suggests a shift in mid-term momentum. A break below the current local range around 45,713.96 will confirm the new direction downwards with the target being the next key level of 45,654.62 and a reconvened placement of a stop-loss beyond the range.
❤️Sending you lots of Love and Hugs❤️
GOLD: The Market Is Looking Down! Short!
My dear friends,
Today we will analyse GOLD together☺️
The in-trend continuation seems likely as the current long-term trend appears to be strong, and price is holding below a key level of 3,689.81 So a bearish continuation seems plausible, targeting the next low. We should enter on confirmation, and place a stop-loss beyond the recent swing level.
❤️Sending you lots of Love and Hugs❤️

SILVER: Strong Bullish Sentiment! Long!
My dear friends,
Today we will analyse SILVER together☺️
The market is at an inflection zone and price has now reached an area around 42.715 where previous reversals or breakouts have occurred.And a price reaction that we are seeing on multiple timeframes here could signal the next move up so we can enter on confirmation, and target the next key level of 42.879.Stop-loss is recommended beyond the inflection zone.
❤️Sending you lots of Love and Hugs❤️

EURUSD: Bulls Are Winning! Long!
My dear friends,
Today we will analyse EURUSD together☺️
The price is near a wide key level
and the pair is approaching a significant decision level of 1.18364 Therefore, a strong bullish reaction here could determine the next move up.We will watch for a confirmation candle, and then target the next key level of 1.18685.Recommend Stop-loss is beyond the current level.
❤️Sending you lots of Love and Hugs❤️

Bitcoin at a decision point. The next 2 days should be tellingBitcoin is either in the process of forming the 'killzone' to a new direction down, or threading itself onto the support line to continue a climb up
The next 2 days should give us what it's decided

Q3 W38 D16 Y25 Pre NY OutlookQ3 W38 D16 Y25 – Pre-NY Outlook
Today’s chart analysis will focus on:
EURGBP
AUDUSD
GBPUSD
GBPJPY
This is simply a forecast of price action and how I plan to react if and when the market presents opportunities.
Stay disciplined, trade what you see — not what you feel.
FRGNT

gold setup 4h analysis Here’s the simplified view for XAU/USD (Gold) 4H chart you shared:
---
📈 Best Buy Setup
Entry: Above 3,675 – 3,680 (only if price breaks and closes above this resistance).
Stop Loss (SL): Below 3,650.
Take Profit (TP):
TP1 → 3,700
TP2 → 3,720 – 3,730
➡ Reason: Breakout continuation in the uptrend.
---
📉 Best Sell Setup
Entry: If price rejects 3,675 – 3,680 with bearish confirmation candle.
Stop Loss (SL): Above 3,695.
Take Profit (TP):
TP1 → 3,600 – 3,610
TP2 → 3,575 – 3,550 (trendline support).
➡ Reason: Failed breakout → pullback to trendline.
---
🔑 Best option now → Wait for confirmation.
If it breaks up, go long (buy).
If it rejects, go short (sell).

Are you still holding your short position?Gold broke out of a low-level consolidation phase on Monday and experienced a significant upward movement. The primary drivers of this rally were heightened geopolitical tensions, which enhanced gold’s safe-haven appeal, as well as the weakening of the US dollar and declining US bond yields.
During this substantial price surge, many traders have been forced to exit their positions prematurely. While some continue to hold on, a large portion of market participants are making trading decisions based primarily on intuition rather than objective analysis. A common belief among traders is that a significant rise in price will likely be followed by a correction. However, in this case, gold has continued to rise steadily without any notable reversal.
Short-term trading strategy for gold: Consider opening a short position near or above the intact resistance level of 3685.
For those who are currently holding short positions at lower levels, please feel free to leave a comment and follow for further analysis and tailored guidance. OANDA:XAUUSD FX:XAUUSD FX:XAUUSD

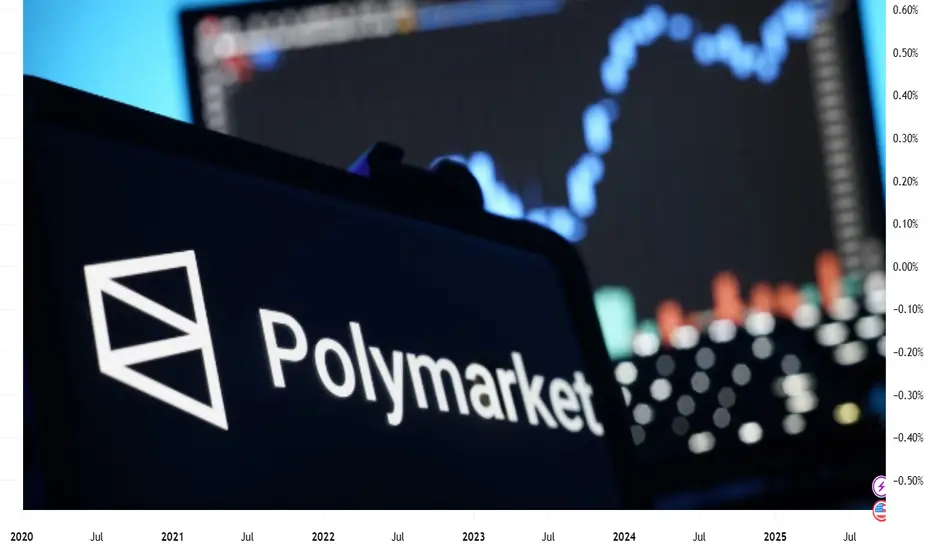
BIT500: Prediction Markets — From Polymarket to InfoFiIn the dynamic crypto landscape of September 2025, prediction markets are evolving into powerful tools for aggregating information and speculation. Polymarket is experiencing explosive growth, with trading volume up 50% month-over-month, reaching $1.16 billion in June and $7.5 billion for the year. This reflects a shift from simple betting to InfoFi—"information finance," where markets not only forecast events but also generate valuable analytics. From BIT500, a leading analytics platform focused on AI-driven signals and on-chain metrics, we analyze Polymarket’s rise, InfoFi signals, and trading opportunities. Our tools track volumes, RSI, and MACD for related assets (USDC, POLY-like tokens, DeFi tokens). Data as of September 16, 2025—perfect timing for positioning ahead of Q4 rallies.
BIT500 equips traders with real-time dashboards; sign up for demo access to seize the advantage.
Polymarket’s Growth: +50% Volume and Leadership in Predictions
Polymarket, a decentralized platform on Polygon, is recording record growth: trading volume up 50% in August-September, with $1.16 billion in June and a total of $7.5 billion in 2025. This is a 300% increase from 2024, driven by bets on elections, recessions, and crypto trends (e.g., “US recession in 2025” at 40% probability). The platform uses USDC for betting, capturing 75% of the prediction market share, surpassing Kalshi (a CEX alternative).
Growth drivers: Web3 integration (NFT betting, DAO voting), institutional inflows ($2 billion), and AI analytics for precise forecasts. On-chain: Transactions up 25%, holder count exceeds 1M, with TVL at $150 million. BIT500’s AI detects a 71% bullish sentiment: Polymarket correlates with BTC (0.6), boosting DeFi liquidity.
From Polymarket to InfoFi: The Evolution of Information Markets
InfoFi is the next frontier, where predictions become “information finance”: markets cover not only events (elections, sports) but also data (AI trends, social signals). Polymarket leads, but InfoFi extends to Kaito (tokenized insights), Cookie3 (social-fi predictions), and Galxe (quest-based markets). The InfoFi market grew 150% YTD, with TVL at $500 million, aggregating “crowd wisdom” for forecasts 20% more accurate than polls.
InfoFi signals: Polymarket/Kaito RSI at 55–60 (neutral-bullish), MACD divergence points to growth. On-chain: Inflows to InfoFi protocols up 30%, with whale activity in USDC (betting collateral). BIT500 forecasts $10 billion TVL by 2026, with a 0.7 correlation to ETH for DeFi integrations.
Trading Opportunities: MACD, RSI, and BIT500 Signals
BIT500 leverages AI for signals on related assets (USDC for betting, ETH/Polygon for platforms). Levels based on the April 2025 trend.
USDC (Polymarket betting): Support at $0.999–$1.000 (50% Fibonacci). Resistance at $1.001–$1.002. RSI at 58 (bullish momentum). MACD: Crossover above zero—signal for 0.2–0.5% arbitrage (Binance premium). On-chain: Inflows $2.5 billion, TVL +15% in InfoFi.
MATIC (Polygon, Polymarket’s base): Support at $0.45–$0.48 (38.2% Fibonacci). Resistance at $0.52–$0.55. RSI at 62 (healthy trend). MACD: Histogram +0.12—10% growth to $0.55. On-chain: Transactions up 20%, InfoFi integration +25% volume.
InfoFi Aggregate (Kaito/COOKIE tokens, ~$0.85 equivalent): Support at $0.75–$0.80 (61.8% Fibonacci). Resistance at $0.90–$0.95. RSI at 55 (bullish divergence). MACD: Bollinger squeeze—8–12% breakout. On-chain: Holder growth +10%, DeFi TVL $100 million.
Overall trend: RSI 56–60, MACD bullish—enter at supports for 10–20% upside in Q4. Risks: Regulation (CFTC scrutiny), hedge with USDC.
Conclusion: Trade Predictions with BIT500
Prediction markets, from Polymarket (+50% volume) to InfoFi, are a breakthrough, with $7.5 billion in trading and $500 million TVL. MACD and RSI signal a bullish trend for USDC/MATIC. BIT500’s AI is your guide for signals and on-chain insights.
Ready to bet? Join BIT500 for alerts. Which prediction market interests you? Comment below!
#PredictionMarkets #Polymarket #InfoFi #MACD #BIT500
#EIGENUSDT#EIGEN
The price is moving within a descending channel on the 1-hour frame, adhering well to it, and is heading for a strong breakout and retest.
We have a bearish trend on the RSI indicator that is about to be broken and retested, which supports the upward breakout.
There is a major support area in green at 1.46, representing a strong support point.
We are heading for consolidation above the 100 moving average.
Entry price: 1.55
First target: 1.61
Second target: 1.67
Third target: 1.74
Don't forget a simple matter: capital management.
When you reach the first target, save some money and then change your stop-loss order to an entry order.
For inquiries, please leave a comment.
Thank you.

#ZEC/USDT Breakout Confirmed - Bullish Rally Loading!#ZEC
The price is moving within a descending channel on the 1-hour frame, adhering well to it, and is heading for a strong breakout and retest.
We have a bearish trend on the RSI indicator that is about to be broken and retested, which supports the upward breakout.
There is a major support area in green at 48.26, representing a strong support point.
For inquiries, please leave a comment.
We are in a consolidation trend above the 100 Moving Average.
Entry price: 52.70
First target: 53.70
Second target: 54.90
Third target: 56.85
Don't forget a simple matter: capital management.
When you reach the first target, save some money and then change your stop-loss order to an entry order.
For inquiries, please leave a comment.
Thank you.

ADA USDT BULISH BREAKOUT Bullish breakout from accumulation zone ⚡️
Price is breaking out of a tight range after strong accumulation near 0.8522. If momentum holds, next target is 0.9110. Stop-loss below 0.8522.
#Crypto #PriceAction #Breakout #TradingView

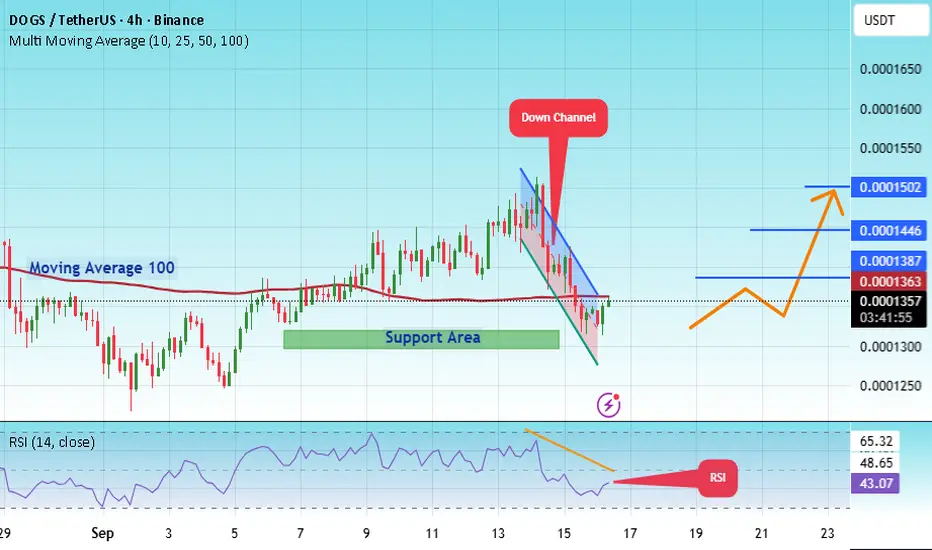
#DOGS – Launchpad or Breakdown?
#DOGS
The price is moving within a descending channel on the 4-hour frame and is expected to break and continue upward.
We have a trend to stabilize above the 100 moving average once again.
We have a downtrend on the RSI indicator that supports the upward break.
We have a support area at the lower boundary of the channel at 0.0001322, acting as strong support from which the price can rebound.
We have a major support area in green that pushed the price upward at 0.0001306.
Entry price: 0.0001360.
First target: 0.0001387.
Second target: 0.0001447.
Third target: 0.0001504.
To manage risk, don't forget stop loss and capital management.
When you reach the first target, save some profits and then change the stop order to an entry order.
For inquiries, please comment.
AUDUSD Daily Forecast -Q3 | W38 | D16 | Y25|📅 Q3 | W38 | D16 | Y25|
📊 AUDUSD Daily Forecast
🔍 Analysis Approach:
I’m applying Smart Money Concepts, focusing on:
Identifying Points of Interest on the Higher Time Frames (HTFs) 🕰️
Using those POIs to define a clear trading range 📐
Refining those zones on Lower Time Frames (LTFs) 🔎
Waiting for a Break of Structure (BoS) for confirmation ✅
This method allows me to stay precise, disciplined, and aligned with the market narrative, rather than chasing price.
💡 My Motto:
"Capital management, discipline, and consistency in your trading edge."
A positive risk-to-reward ratio, paired with a high win rate, is the backbone of any solid trading plan 📈🔐
⚠️ Losses?
They’re part of the mathematical game of trading 🎲
They don’t define you — they’re necessary, they happen, and we move forward 📊➡️
🙏 I appreciate you taking the time to review my Daily Forecast.
Stay sharp, stay consistent, and protect your capital
— FRNGT 🚀
FX:AUDUSD

#DOGS/USDT – Launchpad or Breakdown?#DOGS
The price is moving within a descending channel on the 1-hour frame and is expected to break and continue upward.
We have a trend to stabilize above the 100 moving average once again.
We have a downtrend on the RSI indicator that supports the upward break.
We have a support area at the lower boundary of the channel at 0.0001322, acting as strong support from which the price can rebound.
We have a major support area in green that pushed the price upward at 0.0001306.
Entry price: 0.0001360.
First target: 0.0001387.
Second target: 0.0001447.
Third target: 0.0001504.
To manage risk, don't forget stop loss and capital management.
When you reach the first target, save some profits and then change the stop order to an entry order.
For inquiries, please comment.
Thank you.

EURGBP Daily Forecast Q3 | W38 | D16 | Y25| Video Outlook📅 Q3 | W38 | D16 | Y25|
📊 EURGBP Daily Forecast
🔍 Analysis Approach:
I’m applying Smart Money Concepts, focusing on:
Identifying Points of Interest on the Higher Time Frames (HTFs) 🕰️
Using those POIs to define a clear trading range 📐
Refining those zones on Lower Time Frames (LTFs) 🔎
Waiting for a Break of Structure (BoS) for confirmation ✅
This method allows me to stay precise, disciplined, and aligned with the market narrative, rather than chasing price.
💡 My Motto:
"Capital management, discipline, and consistency in your trading edge."
A positive risk-to-reward ratio, paired with a high win rate, is the backbone of any solid trading plan 📈🔐
⚠️ Losses?
They’re part of the mathematical game of trading 🎲
They don’t define you — they’re necessary, they happen, and we move forward 📊➡️
🙏 I appreciate you taking the time to review my Daily Forecast.
Stay sharp, stay consistent, and protect your capital
— FRNGT 🚀

EURGBP Daily Forecast -Q3 | W38 | D16 | Y25|📅 Q3 | W38 | D16 | Y25|
📊 EURGBP Daily Forecast
🔍 Analysis Approach:
I’m applying Smart Money Concepts, focusing on:
Identifying Points of Interest on the Higher Time Frames (HTFs) 🕰️
Using those POIs to define a clear trading range 📐
Refining those zones on Lower Time Frames (LTFs) 🔎
Waiting for a Break of Structure (BoS) for confirmation ✅
This method allows me to stay precise, disciplined, and aligned with the market narrative, rather than chasing price.
💡 My Motto:
"Capital management, discipline, and consistency in your trading edge."
A positive risk-to-reward ratio, paired with a high win rate, is the backbone of any solid trading plan 📈🔐
⚠️ Losses?
They’re part of the mathematical game of trading 🎲
They don’t define you — they’re necessary, they happen, and we move forward 📊➡️
🙏 I appreciate you taking the time to review my Daily Forecast.
Stay sharp, stay consistent, and protect your capital
— FRNGT 🚀
FX:EURGBP
