Bullish engulfing candleSSR Mining Inc. is a leading, free cash flow focused gold company with four producing operations located in the USA, Türkiye, Canada, and Argentina. They produce over 700,000 oz of gold a year.
Friday had a bullish engulfing candle
I see a target price of $14.30 , where there is resistance.
War news again this weekend will push oil and gold up again.
Good luck traders
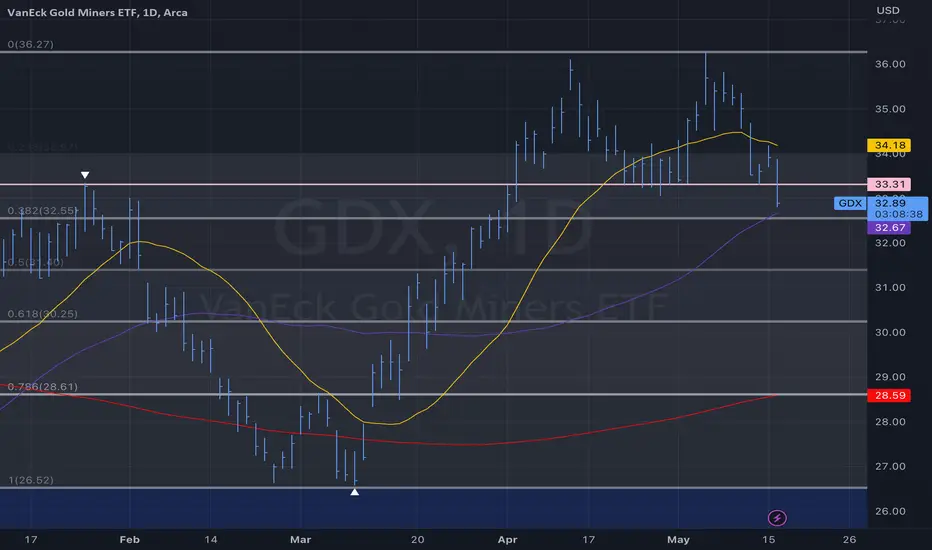
GDX

Bright future ahead for gold and silver minersAs long as the price holds recent Oct lows, I will continue to expect it to move towards next important resistance area: 31-35-38.
Afterwards it would be ideal for price to consolidate and form a handle part of the cup with later break out above 35 pivot to confirm its intentions to move to next important resistance areas: 43-48-52
Short-term trading thesis: I will wait for price to consolidate around prior highs (preferably 29-30), providing a low risk entry point to consider any long trades.
Long-term trading thesis: Establishing a position within this potential basing periods along the right side of the cup with later breakout - all these looks reasonable for me for any positive expectations in coming months and 2024.
Important notice: Elliot waves and fibonacci retracements are a very subjective form of analysis and I don't personally trade out of them. I use them only for the purpose of gauging structural potential of any assets, that allows me to put more confidence when low-risk trading set-up emerges. Analysis and opinion doesn't pay, only price pays.

The Day Ahead: TQQQ, GDXJ, USO, GDX, FXI Premium SellingIt's Friday ... the 13th. Here's what's shakin' in exchange-traded fund premium selling ... .
Top 5 Options Liquid ETF's Ranked by 30-Day IV:
TQQQ 22.9 IVR/60.4 IV
GDXJ 23.6/38.9
USO 46.4/38.8
GDX 26.0/33.6
FXI 14.8/31.4
Ideally, you want to have IVR at >50 and IV at >35% in ETF premium-selling land, but you can't have everything in this market ... .
Broad Market Shortest Duration <16 Delta Strike Paying 1% of the Strike Price In Credit:
IWM, the January 19th 151, paying 1.58 at the mid (14 delta)
QQQ, the January 19th 325, paying 3.44 at the mid (15 delta)
SPY, the February 16th 385, paying 3.93 at the mid (15 delta)
Me, Personally
Currently, I still have quite a bit of broad market on in fourth quarter expiries, with the majority being in the December monthly and the end-of-quarter December 29th. (I have one IWM straggler on in the November monthly). I've begun to deploy out a smidge into the 2024 first quarter), but may just sit on my hands this week depending on whether I can get in at strikes better than what I currently have on.
Because of that, I may dabble small with TQQQ as an engagement trade (and to see what all the fuss is about). Pictured here is a 16 delta short put at the 30 strike in the December 15th monthly paying 1.01 at the mid which I'll do as a starter position and then work it from there as I wait on my other positions.
I also already have a GDXJ covered call on (See Post Below), but may add a short put to give me a little extra sumthin' sumthin' on that play.

GDXJ: 3 Line Strike with Bearish Divergence Into US Bond DumpingUS Bonds are currently dumping once more as GDXJ and Gold Bearishly Diverges at resistance after printing a 3-Line Strike. If this goes as I would expect, then we will see GDXJ come down to recover the entire range.

The Day Ahead: GDXJ, FXI, EWZ, GDX Premium SellingIt's Friday, and the last trading day of September ... .
Here's what's at the top of my IV screener in the exchange-traded fund space:
TQQQ, IVR/IV 23.3/64.2%
GDXJ, 22.7/36.4% (2.52% yield)
FXI, 12.5/33.4% (2.26% yield)
EWZ, 11.1/31.9% (10.9% yield)
GDX, 26.0/31.5% (2.23% yield)
You'll notice that everything is still pretty much in the lower one-quarter of the IV range over the past 52 weeks, but there are a few instruments have popped above 30% 30-day. If you're big on divvies, EWZ stands out, but one potential drawback for some may be that it only distributes biannually in June and December.
In the broad market exchange-traded fund space:
QQQ, IVR/IV 22.2/22.3% with the shortest duration <16 delta strike that pays 1% of the strike price in the December 15th (the 321, paying 3.30 at the mid)
IWM, 21.6/20.8%, with the shortest duration <16 delta strike that pays 1% of the strike price in the December 15th (the 162, paying 1.72)
SPY, 22.1/17.1%, with the shortest duration <16 delta strike that pays 1% of the strike price in the January 19th contract (the 385, paying 3.91).
You can naturally opt for shorter duration and be more aggressive with your delta, with the trade-off being that you may end up being assigned shares more frequently or have to manage in-the-money's via roll, which is not the funnest way to manage a tested short put, depending how deep in-the-money it is. (I'm talking mostly about what I do strategically in my retirement account, which is short put/acquire/cover or "wheel").
Me Personally ... .
I pretty much mechanically put on the shortest duration <16 delta strikes paying around 1% in broad market (IWM, QQQ, SPY) on a weekly basis, so am going to do that today, assuming I don't already have rungs camped out where I'd want to pitch my tent with a secondary consideration being whether the contract represents a better strike than what I've currently got on.
And, in spite of the short term pain I'm experiencing in my attempt to acquire TLT shares at these levels, I'll probably also add in a rung (or two), since I have a maximal buying power that I want to devote to that position, and I'm not there yet. The probable result at the moment is that I will be assigned various lots at various strikes and will have to cover (i.e., sell call against) at various durations, some of which may be quite long-dated with my current highest strike at the 94 (in the November 17th) and the lowest at the 84 (in the December 15th). Naturally, were I to have followed my initial plan as to when I wanted to start picking up shares, (See Post Below), I would be "less red" ... .

GDXJ (+ Gold) "Bear Trap" LongGiven USD strength and the sustained pressure of ever-increasing US interest rates, gold has been taking it on the chin. However, we’re getting into buy levels/demand where it may be poised for a near-term recovery. Keep tabs on gold (spot, futures, GLD), but if you see signs of accumulation/trend reversal (use small timeframe charts), consider climbing aboard. FYI, gold futures (GC) have a yet-to-be-filled gap @ 1872.70, so we may drift lower in the immediate-term as the precious metal seeks that level. In the Jr. Miners space, we’re eyeing the 30.57-31.85 demand zone, which formed in November of '22. Protective stops should be placed below the lower bound of the buy zone. Targeting is a bit challenging, but GC futures should be able to rally to ~1910, if not higher. As everything is uncertain in trading, use your judgement. We always take mechanical profits en route to opposing zones, which are used for our target setting, and would highly recommend doing the same given the stress currently being reflected across markets.
Just a thought/idea – take it . This is a very aggressive trade given recent price action - be careful!
JHart @ LionHart Trading

GDX trade plan based on AMEX traders activityA significant straddle on GDX was concluded at the end of trading on September 06 on the AMEX exchange.
IMPORTANT! Based on our team's research of the options market, we expect buy activity at the support level or sell activity at the resistance.
We primarily consider levels to be activity zones, but not to be a super-fine level for establishing a limit order. Use them in combination with our own strategy, not in alone.

GOLD vs NASDAQ- Which is better ?Over a period of time what is better to trade and invest in a gold futures based ETF or instead
the TQQQ , a leveraged and popular ETF tracking the NAS100 and NASDAQ. To analyse, this
I put NUGT on the daily chart and superimposed the price action of TQQQ.
Starting one year ago, NUGT had the better price action in an upward facing megaphone
pattern reflecting high volatility and topped out 70% over the last August start in a double top.
After its retracement, it is now positioned perhaps for bullish continuation.
TQQQ on the otherhand since a low at the end of 2022 has been in a less volatile trend up
topping out at 50% last month but now also with a bit of a pullback and retracement.
I conclude that one is not better than the other and that a lot depends on a traders
appreciation of market tops. Swing trades in both managed well may give diversity to
the trades and allow for profitable outcomes. As a well established gold bug, however, I
believe that gold will shine moving forward especially if a BRICS currency is launched with
a real gold standard.

Long Gold, Long JNUG, Long ZcashThey're all the same sort of asset, but their eccentricities is what distinguishes their beta value.
A simple, secure digital currency that protects your privacy. For everyday purchases, sending money to a friend, and your favorite crypto applications, too.

#Silver UpdateSilver outperformed my outlook and its peer gold by any measure. And at this point, it should turn lower to shape an ending diagonal as there are no other alternatives left (at least I struggle to find one) other than recycling the bigger picture.

#Gold UpdateIn the chart above, I highlighted the preferred scenario now in Gold and Silver - flat. Since wave is a clear double zigzag and because Silver invalidated a symmetrical triangle, I would discount the probability of such a triangle in Gold as well. That leaves me with ABC flat, or the whole thing is something else.
However, even one scenario with ABC flat may have a great degree of uncertainty as wave C can take the shape of an ending diagonal as indicated below, or an impulse with wave w relabeled as wave (1) - less likely considering complex structures on minute timeframes. It can also be an expanded diagonal which is always a nightmare for ElliottWave traders.

Local Bottom In #Gold #XAUUSD It seems that gold has has just made a local bottom! I maintain a couple of scenarios at this point.

GDX heading down... It has been more than 6 months since I looked at GDX proper. Yes, I might have missed the last Gold/GDX rally, but I think that short run is about over...
Looking at the weekly chart for GDX, a decisive lowest close since March 2023 is representative of a end of a bull trend, if it is not already obvious enough. The near marubozu type down candle came after a quick dip and a lower high, to get a close near the lower low... which just prevails the downward momentum.
Few other notes...
1. a trendline support breakdown this coming week would accentuate the downside bias;
2. the MACD and VolDiv have crossed down and looks determined to crossunder the zero line;
3. any further breakdown bring it into the previous consolidation range. And a break in into the range suggest an extrusion on the other (lower) side of the range;
4. Noted that the USD appear to be gaining strength and the equity markets are about ripe for a retracement. Furthermore, the Gold analysis point to a further slide in Gold prices. Taken together, these 3 critical pillars for GDX are impacted, whcih gives little for the bullish case on GDX.
Down it goes... heads up!

#GOLD miner to 5XI see $3.85 to $5 dollars on the roadmap for this beaten #Miner
Much like in #Crypto the miners lag the underlying commodity
UNTIL a high range has been established
then the speculative fervour starts to filter through into these low cap gems.

GDX: Will you make it? 💪This is what we ask GDX regarding our primary scenario. The ETF has shown momentum in both directions: upward and downward. However, we expect the bulls to win this fight, pushing GDX above the resistance at $32.58 and into the turquoise zone between $33.93 and $35.57. There it should finish wave ii in turquoise and turn southward again, heading back below $32.58. However, our secondary scenario shouldn’t be disregarded! There is a 40% chance for the bears to triumph. In that case, we would have to wait for wave alt.(5) in yellow to expand first, which would then include a new low.

$GDX short term support & major supportAMEX:GDX short term support at the 50 day moving average next major support will be around $30
NEWMONT Mining Showing weaknessIs Newmont mining telling us that gold is about to correct more or is this isolated to the miners?
This leading gold miner could be signaling headwinds for miners.
We have seen Gold outperform miners which tells us that this move in gold is likely from the banking crisis...fear.

Imminent breakout setup in GDXSo many indicators and time frames are bullish GDX right now with bull divergences and montly MacD cross. Classic cup n handle formation with a backtest of cup in progress. Im no EW guru but it looks like we are at the beginning of wave 3. Good RR here with a stop at $31. Let me know what you think of analysis. Cheers.

Elliott Wave Expects Gold Miners ETF (GDX) Buyers expect soonGold Miners ETF (GDX) shows a bullish sequence from 9.26.2022 low favoring further upside. The 100% – 161.8% Fibonacci extension target from 9.26.2022 low comes at 38.3 – 45.7 area. Rally from there is unfolding as a nest where wave ((1)) ended at 33.34 and wave ((2)) pullback ended at 26.64. Wave ((3)) is in progress as another 5 waves in lesser degree. Up from wave ((2)), wave (1) ended at 36.10. Pullback in wave (2) is in progress to correct cycle from 2.24.2023 low in 3, 7, or 11 swing before the rally resumes.
Internal of wave (2) is in progress as a double three Elliott Wave structure. Down from wave (1), wave ((a)) ended at 34.38, wave ((b)) ended at 35.19, and wave ((c)) ended at 34.07. This completed wave W in higher degree. Corrective rally in wave X ended at 35.19. Wave Y lower is in progress as a zigzag structure. Down from wave X, wave ((a)) ended at 33.60, wave ((b)) ended at 34.63, and wave ((c)) of Y should reach the extreme area at 31.9 – 33.15 blue box area. From this area, the ETF can extend higher in wave (3) or rally in 3 waves at least.

XAU trouble for gold n silver is here The chart posted is now setup with a Negative Divergence see RSI I am buying puts in slv and gld this week

Gold is shining...is it going to breakout?Gold has rallied over 26% in a few months.
That is a massive deviation from the mean move in Gold, ofcourse much of this move is from banking fear.
With an upsloping wedge pattern forming, gold is likely going to make a new directional move.
Probabilities favor a break lower from this pattern but we shall see if Gold has other plans.

Rolling Waves (up)The bear leg could have probably ended.
Confirmation should come next week if it begins to move up sharply as I think.
In short term (two weeks) back at 38$
And probably end of May back to 48$.
Again GDXJ is on major support and this last week was a tipical shaking move before a large one.
The sector is moving up, and up, but remenber always that corrects in a hard way, so trading is the best attitude to make money.
I am long.
Rolling waves (The naked and famous).
www.youtube.com
Salud para todos.

Wild S&P Nonsensery Who could have guessed markets would rally in an ocean of bad news:
Worse than expected CPI
Worse than expected PCE
Worse than expected Chicago PMI
Joblessness Rising
Missed Earnings
Q2 GDP Contraction in Recession
Collapsing Home and Auto Sales
Who knew you could miss earnings, lose millions in revenue and your stock price rallies like Microsoft, Boeing, and Google. BestBuy which is a horrible performer in economic downturn also slashed guidance and their stock price rallied 10%. This market has become an utter joke and its pure manipulation due to QE and Buy Backs. At this point, I'm bullish. The more the bad news, the higher the market goes.
Targets for S&P
- 4209
- 4293
- 4340
If we break the dotted yellow line, we could see this going up towards the 4300 mark to the MA of 4350ish. If WWIII gets announced, I suspect this will rally to well over 7,000 or higher. There is no danger of a double top either at 4200, that is now a myth. Recession is a myth. Americans are actually FLUSHED with cash and prices aren't high enough and things in the US couldn't be better.
